💽 SKHY — Five Legs, Three Timestamps, and a Bullish Tilt That Resolved Bigger Than It Looked
🔄 Updated August 10, 2026. Four of the five legs confirmed as opens. The fifth inverted the structure. The January $180 call we described as the short side of a bull call spread was not sold to open — it was sold to close, with open interest falling 7,225 → 3,115. That makes the January trade a roll down from $180 to $160, not a capped spread: the upside is not given up above $180 at all. The position is more bullish than we described it. Corrected below.
SKHY traded across three separate windows today at $136.26, $139.23 and $135.30. Follow it on the SKHY ticker page.
⚠️ A note on what we could and could not establish. We were unable to source a company profile, market capitalisation, sector classification, 52-week range, earnings date or analyst coverage for this ticker in the time available. Rather than fill those in with plausible-sounding estimates, we are leaving them out and saying so. Verify the instrument and its calendar before trading an expiry around it. Everything below about the trades themselves comes from the tape and is solid.
🤝 Three Separate Trades — Not One Package
These printed at three different times and must be read separately.
09:53:12, spot $139.23 — a stock-plus-options cross: Buy 4,000 December-18 $150 calls at $28.90 — $11,560,000.
10:31:32, spot $135.30 — two legs, different mechanisms: Buy 1,000 June-2028 $200 calls at $51.95 — $5,195,000 (this one printed lit, the only genuinely lit leg on today's whole board) Sell 1,000 June-2027 $130 puts at $36.95 — $3,695,000 (floor-negotiated)
12:46:51, spot $136.26 — a bull call spread, both legs floor-negotiated: Buy 5,975 January-2027 $160 calls at $24.05 — $14,369,875 Sell 5,975 January-2027 $180 calls at $18.95 — $11,322,625
| Time | Buy/Sell | C/P | Expiration | Strike | Size | Volume | OI (prior) | Option Price | Premium | Spot | Option Symbol |
|---|---|---|---|---|---|---|---|---|---|---|---|
| 09:53:12 | BUY | CALL | 2026-12-18 | $150 | 4,000 | 4,000 | 14,055 | $28.90 | $11,560,000 | $139.23 | SKHY20261218C150 |
| 10:31:32 | BUY | CALL | 2028-06-16 | $200 | 1,000 | 1,000 | 2,459 | $51.95 | $5,195,000 | $135.30 | SKHY20280616C200 |
| 10:31:32 | SELL | PUT | 2027-06-17 | $130 | 1,000 | 1,000 | 2,417 | $36.95 | $3,695,000 | $135.30 | SKHY20270617P130 |
| 12:46:51 | BUY | CALL | 2027-01-15 | $160 | 5,975 | 6,000 | 293 | $24.05 | $14,369,875 | $136.26 | SKHY20270115C160 |
| 12:46:51 | SELL | CALL | 2027-01-15 | $180 | 5,975 | 6,200 | 7,225 | $18.95 | $11,322,625 | $136.26 | SKHY20270115C180 |
Net across everything: a $16,107,250 DEBIT. Combined delta +358,395 shares — a bullish tilt.
Only one leg is a proven open: the January-2027 $160 call, 5,975 against prior open interest of just 293. The other four all traded below existing open interest and cannot be resolved from today's tape.
🤓 What This Actually Means — Plain English
The January trade is a roll down, not a spread — and this is the correction the August 10 snapshot forced. We read it as buy the $160 call, sell the $180 against it, capped at the $20 strike width. But the $180 open interest fell by 4,110, which means that leg was sold to close an existing long, not sold to open a short. So the sequence is: give up a $180 call bought earlier, take a $160 call instead. Net cost is still $5.10 a share ($3,047,250), but nothing is capped — moving a strike $20 closer to the money buys more delta and leaves the upside open. Same cash, materially more exposure.
Selling a put while buying a long-dated call — the 10:31 pair — is a bullish combination. The put sale collects premium and takes on an obligation to buy at $130; the 2028 call buys upside far out in time. Together they lean long.
The December $150 call is a straightforward long, though it came as a stock-plus-options cross, meaning a non-option leg exists that we cannot see.
Why the separate timestamps matter: three trades across three hours may be one desk working an order or three unrelated participants. We cannot tell, and presenting them as a single designed structure would overstate the evidence. What is solid is the aggregate: +358,395 shares of delta, net bullish, $16.1M committed.
✅ RESOLVED — The August 10 Snapshot, and It Reshaped the January Trade
Resolving OPRA open interest is timestamped August 10 and reflects the August 7 close. We said this snapshot carried real weight on this board. It did.
| Leg | Baseline (Aug-7) | Resolving (Aug-10) | Δ | Print size | Δ as % | Day vol | Verdict |
|---|---|---|---|---|---|---|---|
| Jan-2027 $160 call (bought) | 293 | 6,230 | +5,937 | 5,975 | 99.4% | 6,125 | ✅ OPEN (BTO) — as predicted |
| Jan-2027 $180 call (sold) | 7,225 | 3,115 | −4,110 | 5,975 | −68.8% | 6,197 | 🔄 CLOSE (STC) — not a short |
| Dec-18 $150 call (bought) | 14,055 | 16,943 | +2,888 | 4,000 | 72.2% | 4,725 | ✅ OPEN (BTO) — partial |
| Jun-2028 $200 call (bought) | 2,459 | 5,952 | +3,493 | 1,000 | 349% | 3,523 | ✅ OPEN (BTO) — and then some |
| Jun-2027 $130 put (sold) | 2,417 | 2,914 | +497 | 1,000 | 49.7% | 1,014 | ✅ OPEN (STO) — partial |
The $180 call is the inversion. A sale that reduces open interest is somebody exiting a long, not somebody establishing a short. The line had been built on August 3 — it went 1,116 → 6,161 in one session — and 4,110 of it came off on August 7. So the January trade is a roll down from $180 to $160, and the "gives up everything above $180" sentence in the original article was wrong. There is no short call there to cap anything.
Two legs opened for more than we flagged. The June-2028 $200 call gained 3,493 contracts against our 1,000-lot print on 3,523 of volume — so there was substantially more buying at that strike than the block we wrote up. The December $150 call opened ≈72% of its print.
The put sale is confirmed but half-size. +497 of new short puts against a 1,000-lot print: roughly half opened, half changed hands.
Net effect on the read: more bullish, not less. We published +358,395 shares of aggregate delta with the January piece capped at $180. Removing that cap and adding the extra $200-strike buying makes the tilt larger than the original article stated. The one thing that has not changed is the caveat that follows — we still cannot tell whether these three timestamps are one participant or three.
📊 The Charts
One-Year Price Action
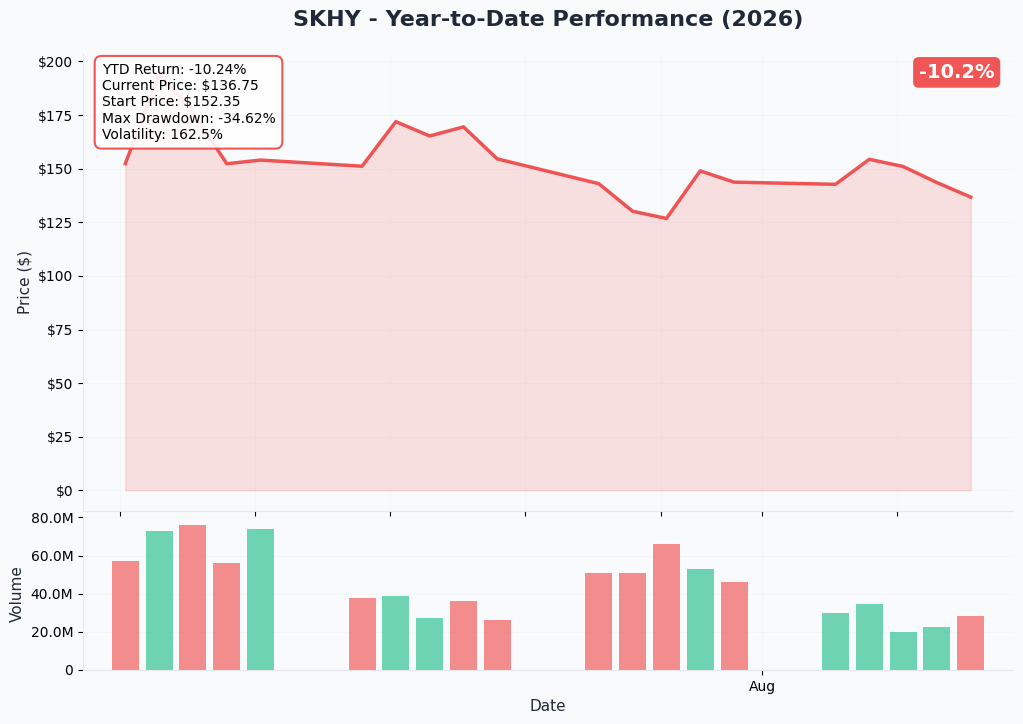
SKHY is −10.2% over the past year. A bullish position is being built on a name that has drifted lower, not one chasing strength.
Gamma Support and Resistance
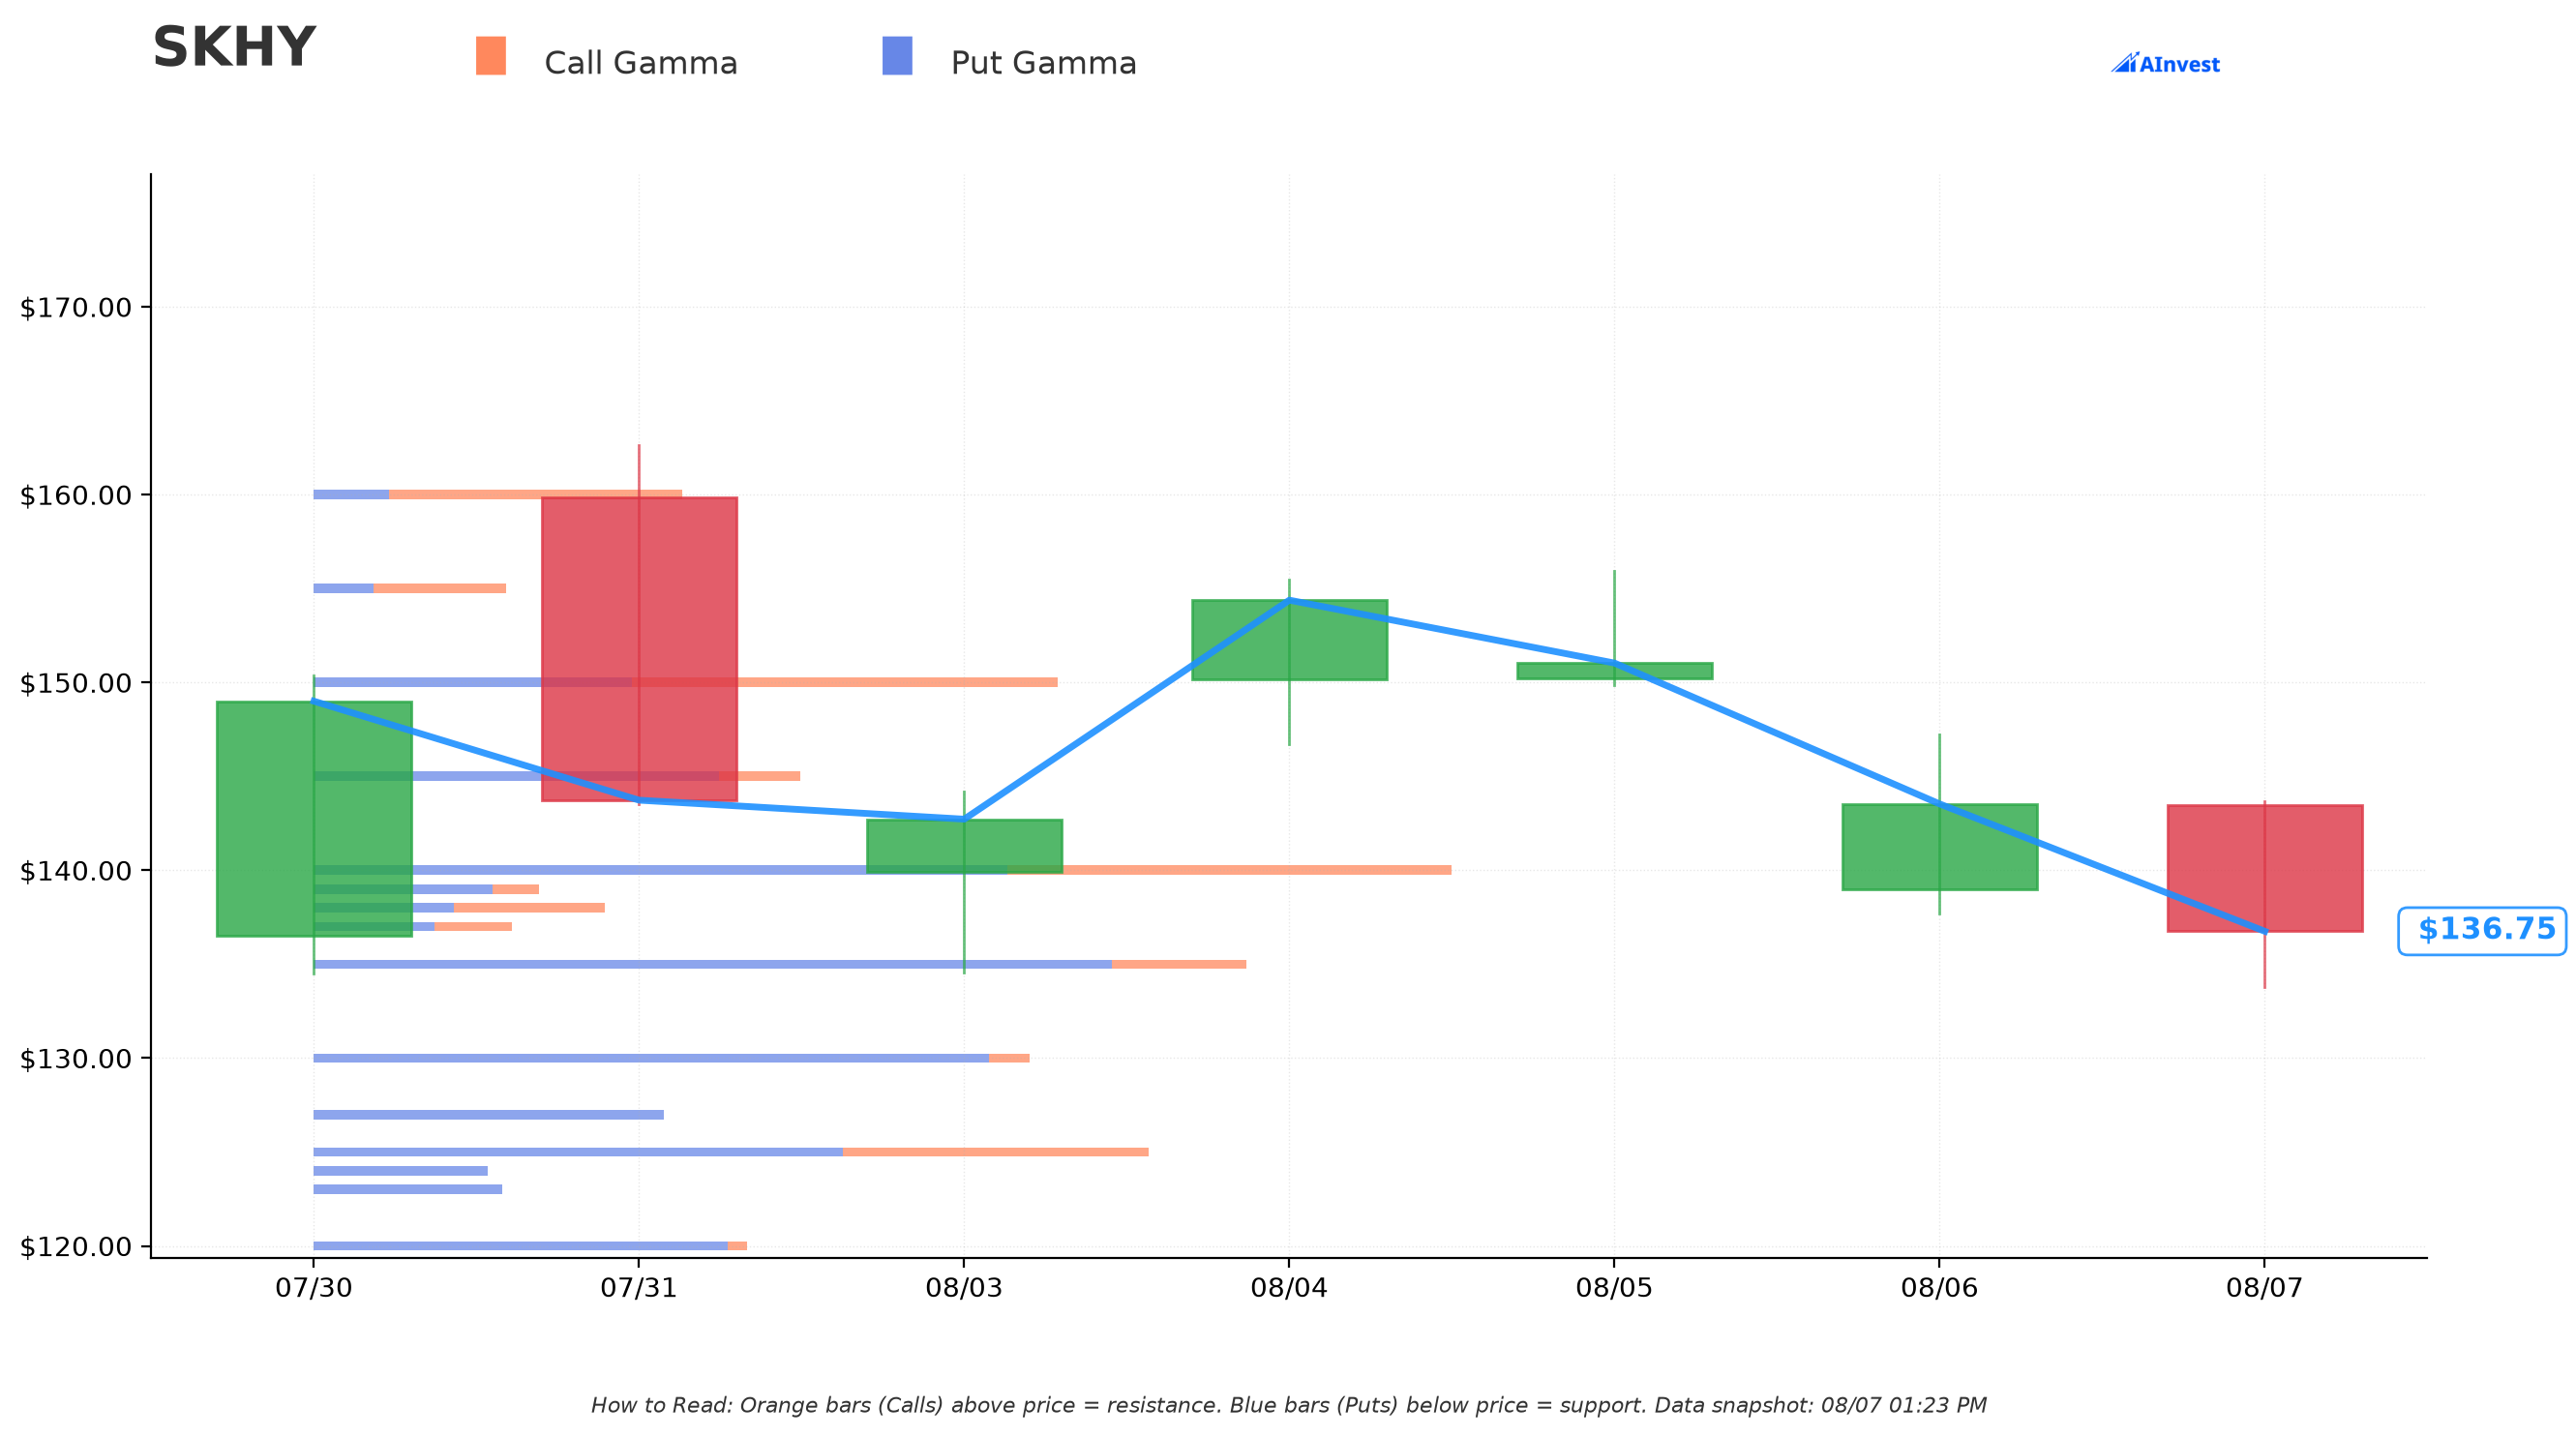
Dealer gamma identifies support at $135, $130 and $127, with resistance at $140 and $145. The stock is sitting on the $135 support shelf. Every call strike in today's trades — $150, $160, $180, $200 — is above the entire resistance structure, so all of them need the stock to clear $140–$145 first.
Implied Move
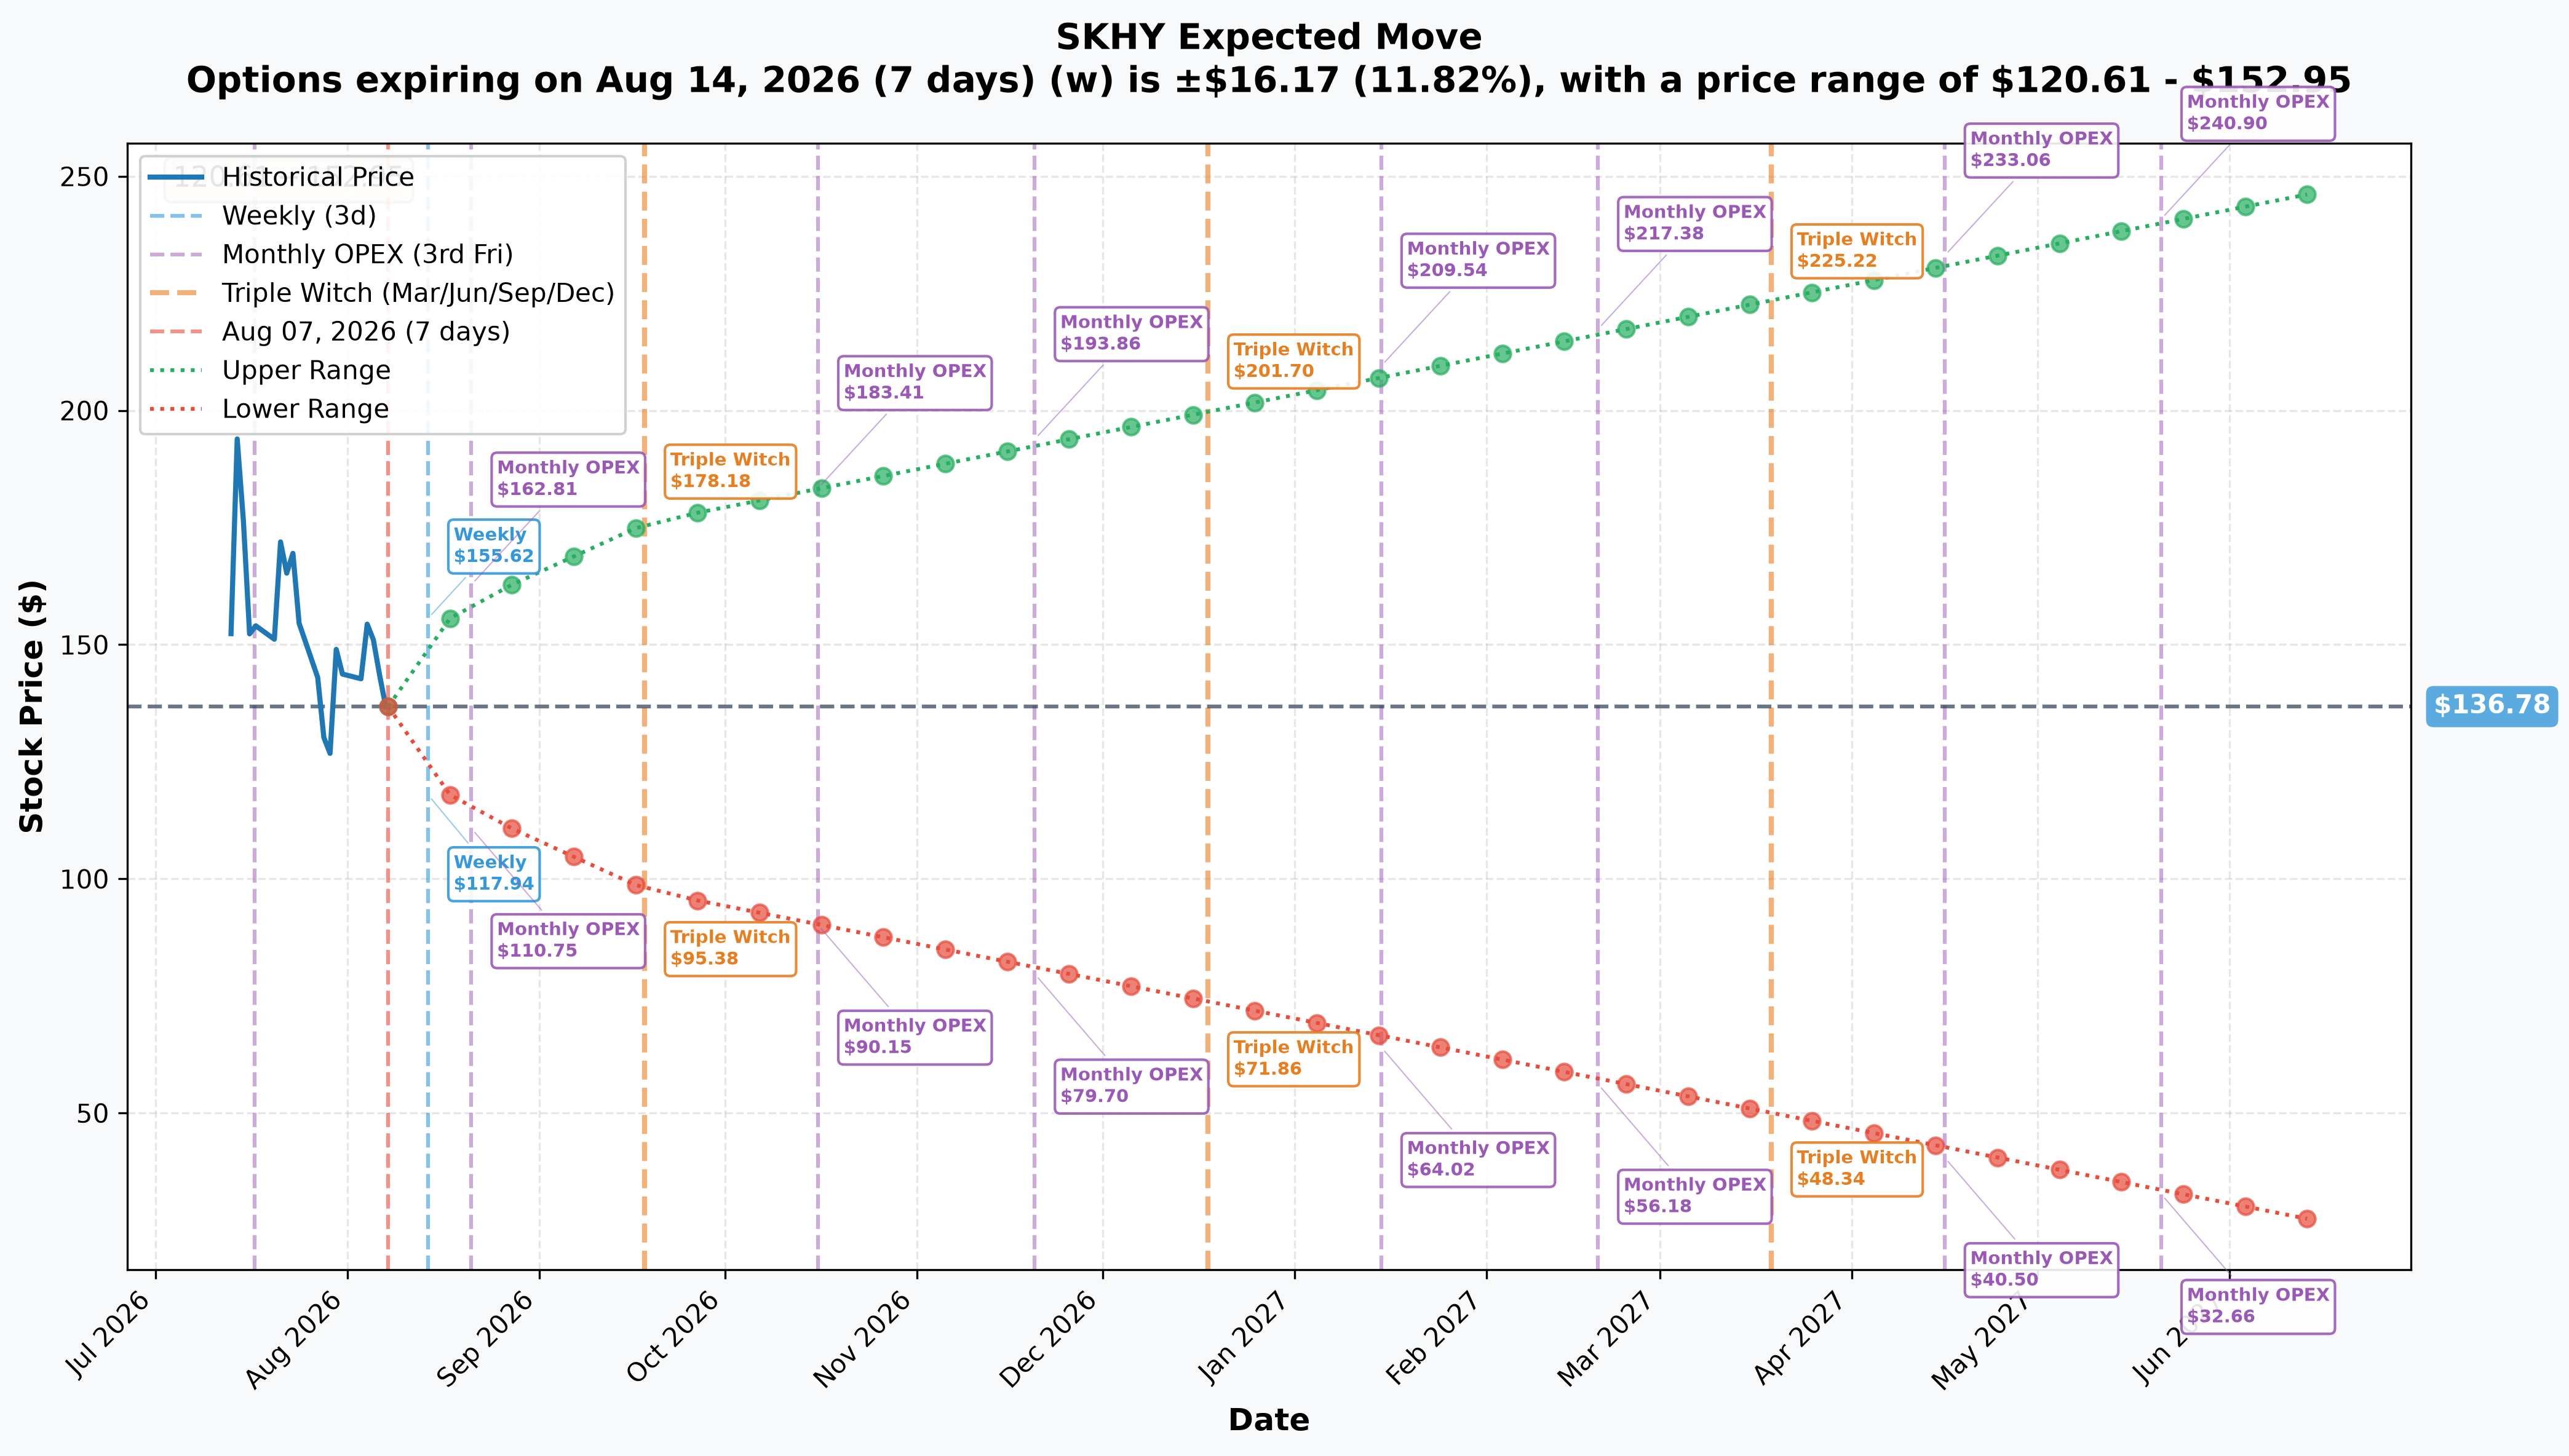
The chain prices ±11.82% by August 14 ($120.61–$152.95), ±16.38% by August 21 ($114.37–$159.19), ±28.74% by September 18 ($97.47–$176.09), and ±80.70% out to June 2027 ($26.39–$247.17).
Those are wide bands — this is a volatile name. The $160 strike sits inside the September range, and the $200 strike sits inside the June-2027 range, so neither is a far-fetched level on the market's own numbers. The $130 put sold is near the lower edge of the near-term ranges, which is why it fetched $36.95.
📅 Catalysts
- Sector context is the honest framing here. Today's board shows memory and semiconductor names moving in different directions: SNDK is sliding after a guidance disappointment, while MCHP jumped 14.34% on a raise. The sector is not moving as one.
- SMH, the semiconductor ETF, has returned +103.12% over a year (StockAnalysis) and also saw a large trade today — useful context for anyone positioning in the sector.
- The Fed held at 3.50–3.75% on July 29 on a 9–3 vote with three officials preferring a hike (Federal Reserve). Several meetings fall inside these expiries (Federal Reserve).
- ⚠️ No company-specific catalyst, earnings date or analyst coverage could be sourced. We are not going to invent one.
👥 Four Ways to Read This
🎲 The YOLO trader — the June-2028 $200 call is the lottery leg, and notably it printed lit — the only genuinely lit trade on the board today. But $51.95 is not cheap, and the strike is ≈48% above spot.
📈 The swing trader — the levels are clear: $135 support, $140–$145 resistance, and every call strike sits above them. Until the stock clears $145 none of these positions start working.
💰 The premium collector — only one leg here is genuinely premium collection: the June-2027 $130 put, $36.95 collected for an obligation to buy at $130, an effective entry near $93. The January $180 call looked like a second sale and was not — open interest proved it an exit from a long. A sale is only premium collection if it opens a short, and here that was one for two.
🌱 The beginner — the lesson is about when not to call something a structure, and it got sharper on resolution. Five legs across three hours look like a grand design, and we declined to name one — correctly. But we did name the January pair a "bull call spread" on the strength of matching size, strike and timestamp, and that was a step too far: the sold leg turned out to be an exit, which makes it a roll, not a spread. Two legs printing together tells you they are related. Only open interest tells you whether each one opened or closed — and until you know that, you do not know the shape of the trade.
⚠️ Honest Risk and Limits — What the Tape Cannot Prove
- We could not source basic company data, an earnings date or analyst coverage. That is a real gap and we would rather state it than paper over it, and resolution did nothing to fill it.
- ✅ All five legs are now resolved — four opens, one close. The close (January $180) inverted the structure from a capped spread to an uncapped roll down.
- The three timestamps may be one participant or three. We still do not know, and open interest cannot tell us. This is the caveat that matters most for the aggregate-delta figure.
- A stock-plus-options cross means a non-option leg exists on the December leg that we cannot see.
- Every call strike is above the gamma resistance structure, so all of these need a break higher first.
Nothing here is investment advice.
Last updated: August 10, 2026 — ⏳ provisional open/close flags resolved against the August 10 OPRA open-interest snapshot. The January $180 call resolved as a close, converting the "bull call spread" into an uncapped roll down; four other legs confirmed as opens.