🛡️ SKHY (SK Hynix ADR) — A $4.15M Collar Locks In Downside After the 12-Bagger Turned Into a −34.6% Drop
📅 August 10, 2026 | 🤝 Block Cross Detected
🎯 The Quick Take
Someone with a real position in SK hynix's US-listed ADR just built a collar — buying 5,000 January-2027 $120 puts (≈$9.47M) while selling 5,000 January-2027 $220 calls (≈$5.32M), for a ≈$4.15M net debit. This is not a speculative bet on direction. It's insurance, paid for by giving up upside above $220, on a stock whose Korean underlying 12-bagged and then lost more than half its value in five weeks. The structure only makes sense if the trader already owns the ADR (or the economically equivalent Korean shares) and wants to survive the next drawdown without selling.
📊 Company Overview — What SKHY Actually Is
SKHY is the Nasdaq-listed American Depositary Receipt (ADR) of SK hynix Inc., the South Korean memory-chip maker — it is not an ETF, not a tracking fund, and not a US company in its own right.
- What you actually own: each SKHY ADR represents 1/10 of one Seoul-listed common share (ticker 000660 on the Korea Exchange). Ten ADRs = one Korean share. If you're used to trading a domestic name, that ratio matters — the price you see on your US screen is a fraction of the "real" Korean share price, converted through the won.
- Listing: SKHY began trading on Nasdaq on July 10, 2026, priced at $149.00 in a $26.5 billion capital raise — described as the largest US share sale ever by a foreign company. It opened at $170 and closed its first day at $168.01, up ≈13% versus the offer.
- Sector: Technology / Semiconductors — memory. SK hynix is the world's #2 supplier in both DRAM (33% share) and NAND (21% share), and the leading HBM (High Bandwidth Memory) supplier feeding Nvidia's AI accelerators.
- Where it trades now: spot ≈$136.15 at the time of this trade — below the $149 offer price, and well off the July 14 record close of $193.92.
- US market cap: roughly $718.65B–$978.96B depending on how the conversion is done (see the ⚠️ parity note below); the Seoul-listed company itself is worth ≈₩1,035 trillion.
What the 1:10 ratio means for a US options trader: you are trading a Korean equity on a US clock. Seoul closes around 02:30 ET, roughly seven hours before US options open, so most of the ADR's opening gap is set by an overnight Korean session you can't watch live. Two extra risk factors ride along with every SKHY option that don't exist on a domestic name like Micron: the KRW/USD exchange rate, and the ADR-to-Seoul price relationship itself.
💰 The Trade — A Collar, Not a Directional Bet
At 13:58:19, two legs printed simultaneously as a negotiated block, both 5,000 contracts, both expiring January 15, 2027:
- 🟢 BOUGHT 5,000 $120 puts for ≈$9.47M (paid $18.93/contract) — downside protection
- 🔴 SOLD 5,000 $220 calls for ≈$5.32M (collected $10.63/contract) — capped upside, funds the protection
Net cost: ≈$4.15M debit.
| Time | Buy/Sell | Call/Put | Expiration | Premium | Strike | Volume | OI | Size | Spot | Option Price | Option Symbol | Order Type | Strategy |
|---|---|---|---|---|---|---|---|---|---|---|---|---|---|
| 13:58:19 | BUY | PUT | 2027-01-15 | $9.47M | $120 | 5,000 | 2,700 | 5,000 | $136.15 | $18.93 | SKHY20270115P120 | BTO | Collar (long $120 put / short $220 call) |
| 13:58:19 | SELL | CALL | 2027-01-15 | $5.32M | $220 | 5,000 | 142 | 5,000 | $136.15 | $10.63 | SKHY20270115C220 | STO | Collar (long $120 put / short $220 call) |
Both legs printed as a 🤝 BLOCK CROSS — a negotiated block matched off the lit book with a known counterparty on the other side. There's no urgency here; this is two parties who already agreed on price, not a sweep chasing liquidity.
The asymmetry is the real story. The $120 put sits ≈11.9% below spot; the $220 call sits ≈61.6% above spot — the call strike is more than five times farther from the current price than the put strike. And yet the far-away call still fetched $10.63 against the near put's $18.93. That gap tells you the options market is pricing a genuinely large right tail into this name — SK hynix option buyers think a run to $220+ is plausible enough to bid it up even at that distance. Selling that expensive, far-out upside to help fund much closer-in protection is the entire logic of the trade.
✅ RESOLVED — The Call Leg Landed Exactly; the Put Leg Opened Only ≈36%
Updated 2026-08-11 pre-market. Resolving OPRA snapshot timestamped August 11 (reflects the August 10 close); baseline is the August 10 snapshot (reflects August 7 — before these prints).
| Leg | Baseline (Aug-10) | Resolving (Aug-11) | Δ | Print size | Δ as % | Day vol | Our published prediction | Verdict |
|---|---|---|---|---|---|---|---|---|
| Jan-15-2027 $220 call (sold) | 142 | 5,110 | +4,968 | 5,000 | +99.4% | 5,008 | ≈5,142 | ✅ OPEN (STO) |
| Jan-15-2027 $120 put (bought) | 2,683 | 4,476 | +1,793 | 5,000 | +35.9% | 5,042 | ≈7,700 | ✅ OPEN (BTO) — partial |
The short call leg is essentially exact — open interest rose 4,968 against a 5,000-lot sale, printing 5,110 against our ≈5,142 prediction. That side of the collar is unambiguously new.
The put leg opened, but only about a third of it was net-new — and the wrinkle we flagged is exactly why. We noted honestly that the $120 put's open interest had fallen from 4,881 to 2,683 over the prior session, meaning ≈2,200 contracts were already being retired at that strike, and warned the predicted ≈7,700 assumed "a clean new open and not partly matched against an existing holder unwinding." That caveat proved to be the whole story: open interest rose just 1,793 against the 5,000-lot purchase, landing at 4,476 rather than ≈7,700. Roughly 64% of the put purchase was matched against holders exiting, not fresh contracts.
The collar is confirmed as a real new position on both legs — direction and structure stand — but a reader sizing the downside protection should note that only ≈1,793 contracts of net new put open interest were created at the $120 strike, even though this buyer took on the full 5,000-lot position. Both statements are true at once: the buyer opened 5,000; the market's outstanding total grew by 1,793.
🤓 What This Actually Means — Plain English
A collar is one of the simplest ways to protect a stock position you already own without selling it. It has two parts:
- Buy a put below the current price. This is your insurance policy — if the stock craters, the put gains value and offsets your loss on the shares. Here, the $120 strike is the "deductible": you're protected against anything below $120, but you eat the first ≈$16 of decline from $136.15 down to $120 yourself.
- Sell a call above the current price. This is how you pay for the insurance without reaching into your pocket for the full premium. You collect cash upfront, but in exchange you agree to give up any gains above $220 — if the stock rockets past that, your upside gets capped there.
Do both at the same time and it's called a "collar" because it puts a ceiling and a floor around the position — like a collar on a shirt. Here the collar isn't free: the put ($18.93) costs more than the call collects ($10.63), so the trader pays a ≈$4.15M net debit to put it on.
Why would someone want this specific shape right now? Look at what the underlying just did. The Seoul-listed shares fell 54.7% from their June 22 peak to a July 30 trough in about 5.5 weeks, including a +30.0% single session on July 31 and a −10.37% single session on August 6 — moves that would be shocking for almost any large-cap stock. The ADR itself dropped 34.6% from its July 14 record close to its July 29 low in just eleven trading sessions. A holder who has ridden this stock from its IPO — or bought it after the initial pop — has already lived through one violent round trip. This trade reads as someone who wants to make sure they can live through a second one without being forced to sell into a panic.
The strike selection reinforces that. The $120 put sits below the ADR's entire 52-week low of $124.80 — this isn't insurance against ordinary noise, it's insurance against a fresh new low. The $220 call sits ≈10% below the Wall Street average price target of $244.92 — the seller is capping gains at a level the sell side still broadly expects the stock could reach, accepting that real chance of being "called away" in exchange for financing the put. That's a textbook trade for someone who wants to survive volatility, not someone betting the stock is about to crash or fly.
📈 Technical Setup
YTD Chart
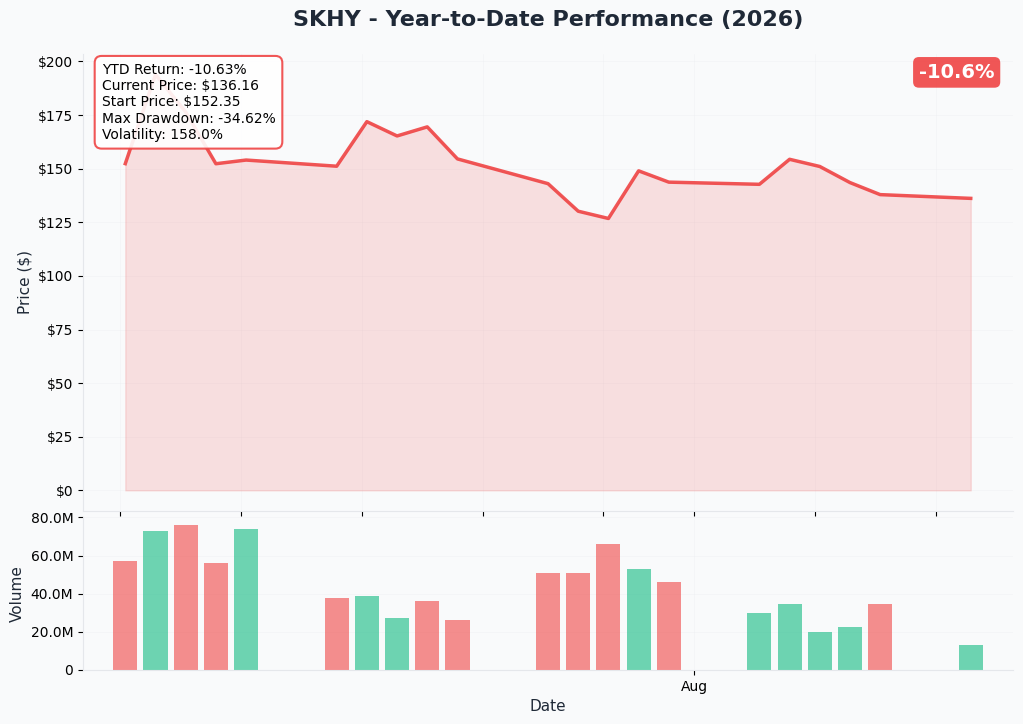
A quick note on this chart: SKHY only started trading on July 10, 2026, so what you're looking at is roughly a month of real history, not a full year — this is not missing data, it's simply all the trading history that exists for this ADR. In that short window the stock has already traced its entire range: a record close of $193.92 on July 14, a crash to $126.79 on July 29 (Q2 earnings day), and a slow grind back to today's ≈$136.15.
Gamma-Based Support & Resistance
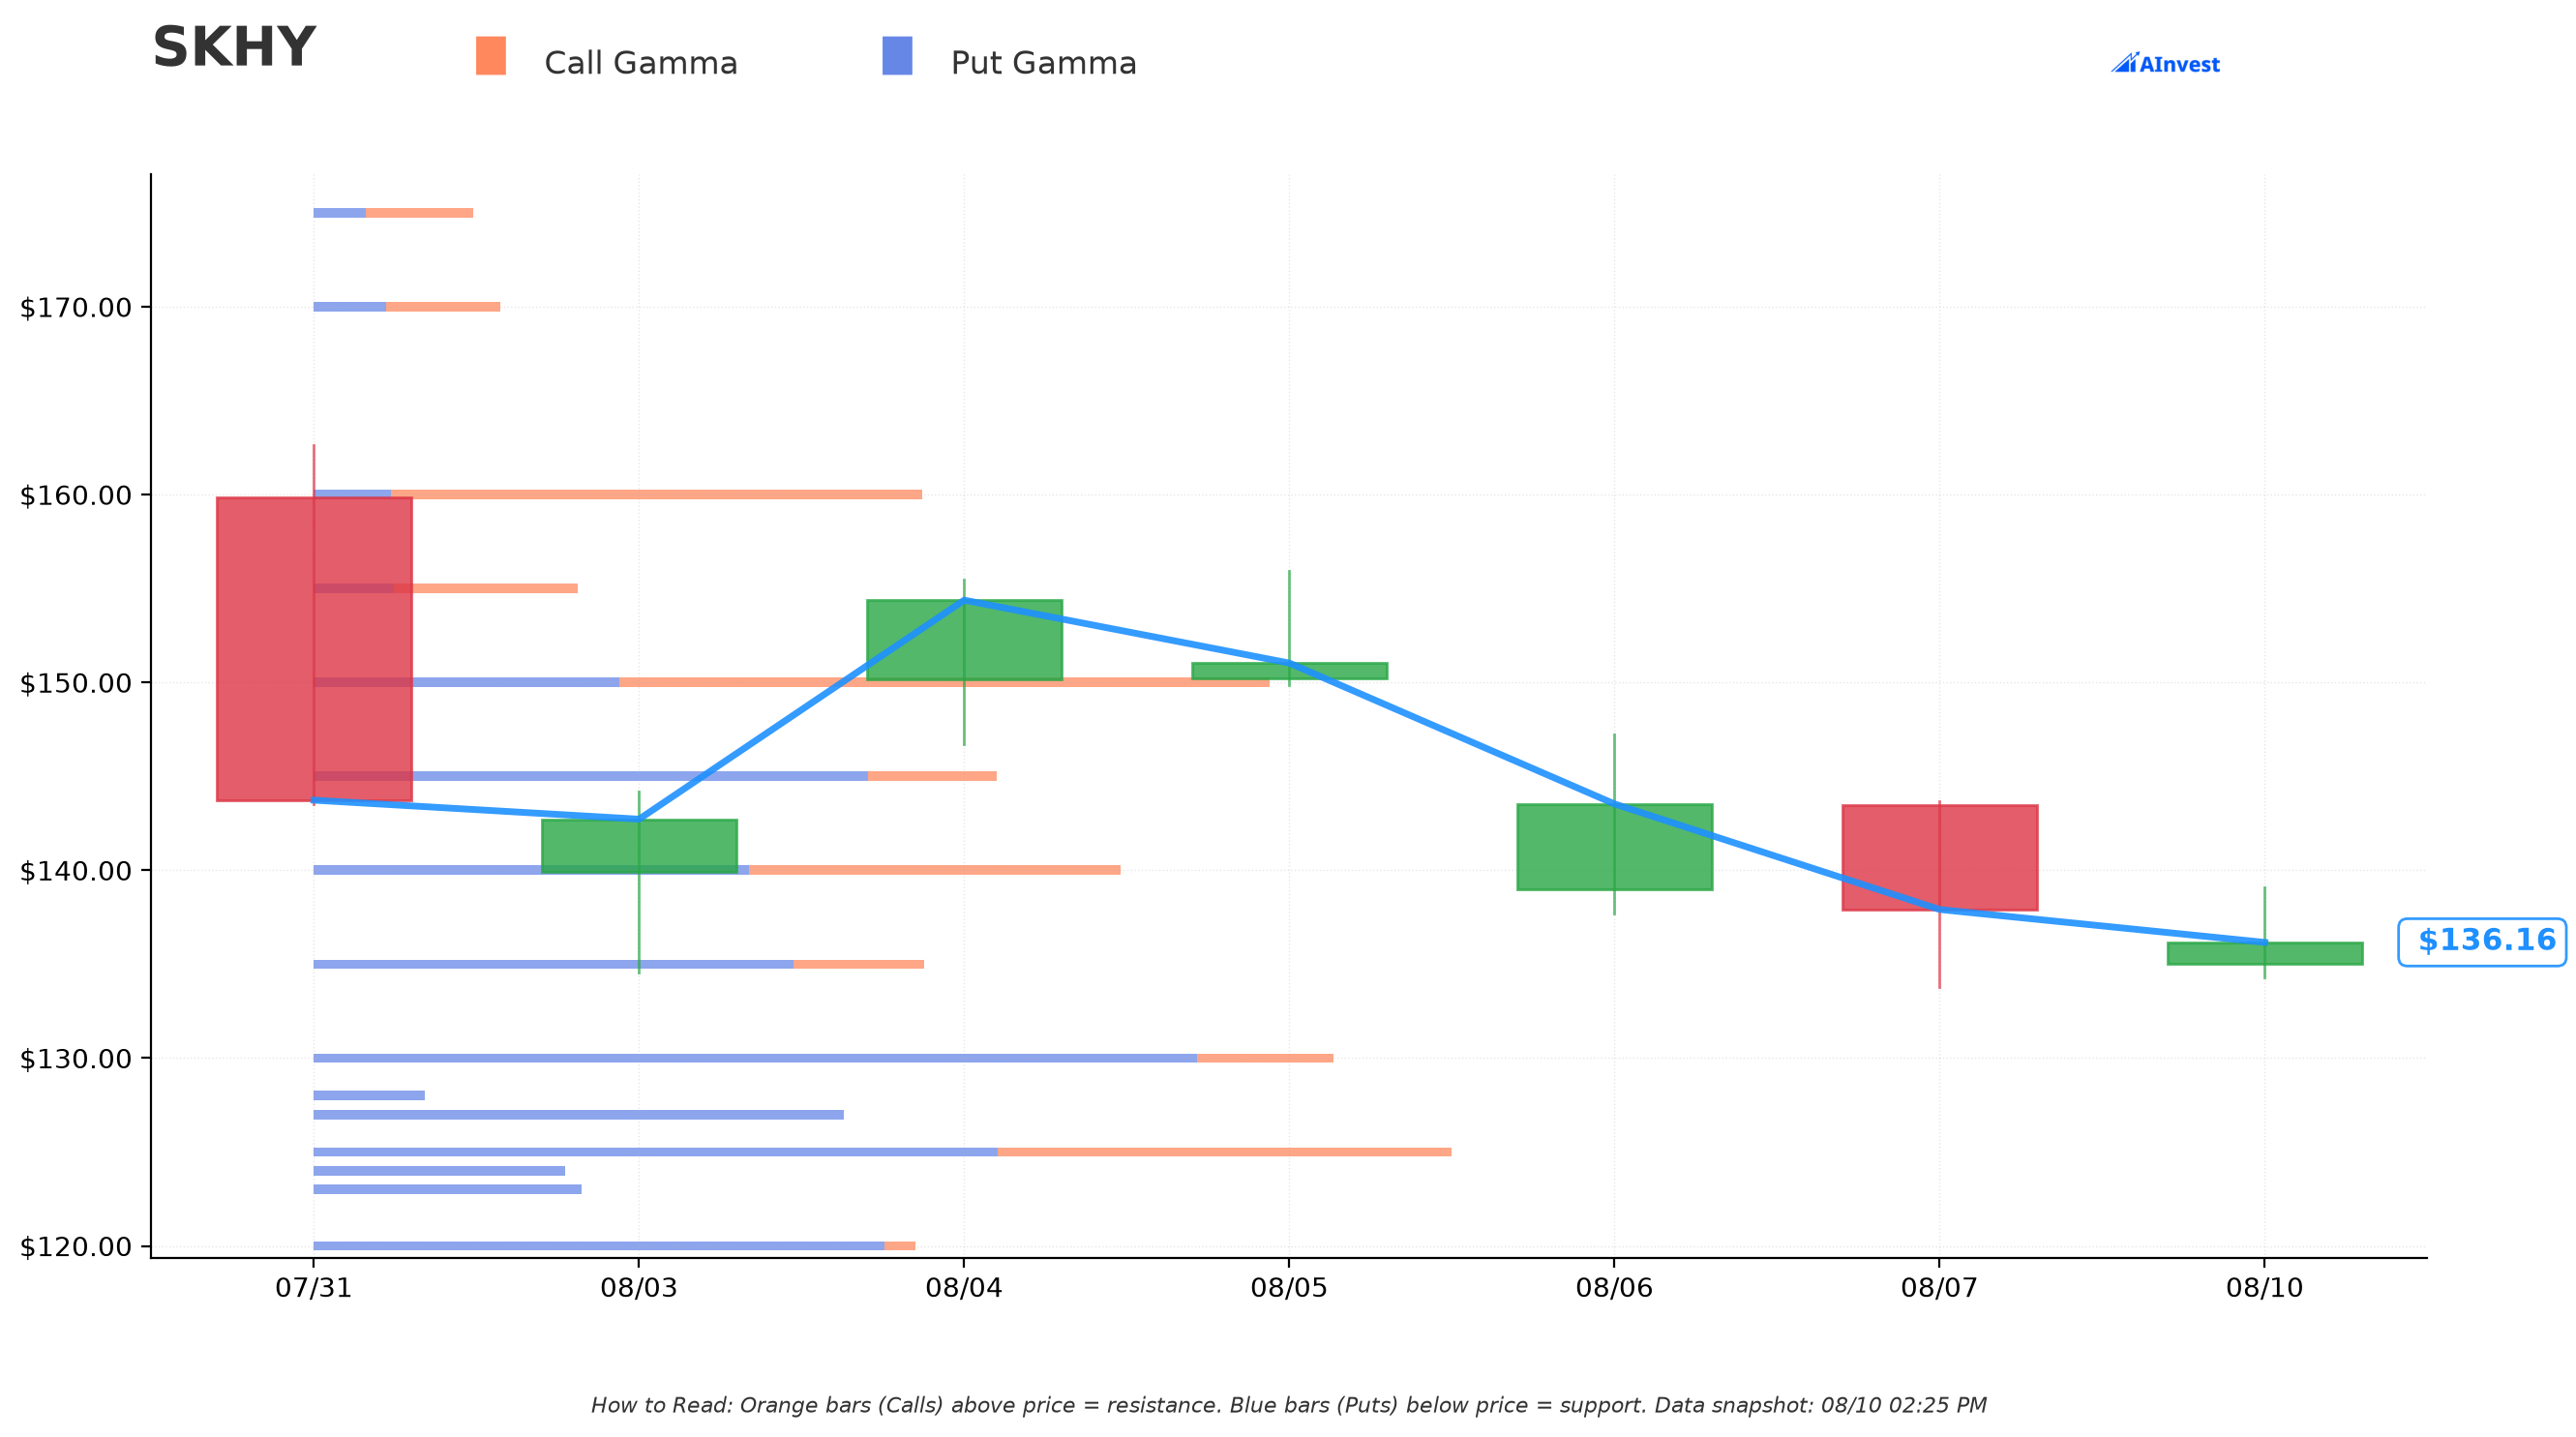
With spot at $136.12, the gamma map shows dealer positioning clustering close to price:
- 🔵 $135 — moderate support, total gamma exposure ≈3.6, dominated by put gamma (≈2.83 vs ≈0.77 call) — essentially right where price is sitting now.
- 🔵 $130 — the strongest nearby support, total gamma ≈6.03 (put-dominated, ≈5.23 vs ≈0.81 call), ≈4.5% below spot.
- 🔵 $127 — secondary support, total gamma ≈3.14, almost entirely put gamma, ≈6.7% below spot.
- 🟠 $140 — nearest resistance, total gamma ≈4.76, ≈2.9% above spot.
- 🟠 $145 — secondary resistance, total gamma ≈4.04, ≈6.5% above spot.
- Gamma walls further out: a support wall at $125 (total gamma ≈6.73, ≈8.2% below spot) and a resistance wall at $150 (total gamma ≈5.65, ≈10.2% above spot).
Reading this in plain English: dealer hedging flows are concentrated in a fairly tight band around $127–$145, which is consistent with a stock that's calming down after a violent month rather than one about to make another explosive move. The $120 put strike in today's collar sits below every one of these gamma levels — the trader isn't hedging against a normal pullback to $130 or $127, they're hedging against a break of the entire recent gamma structure.
Implied Move
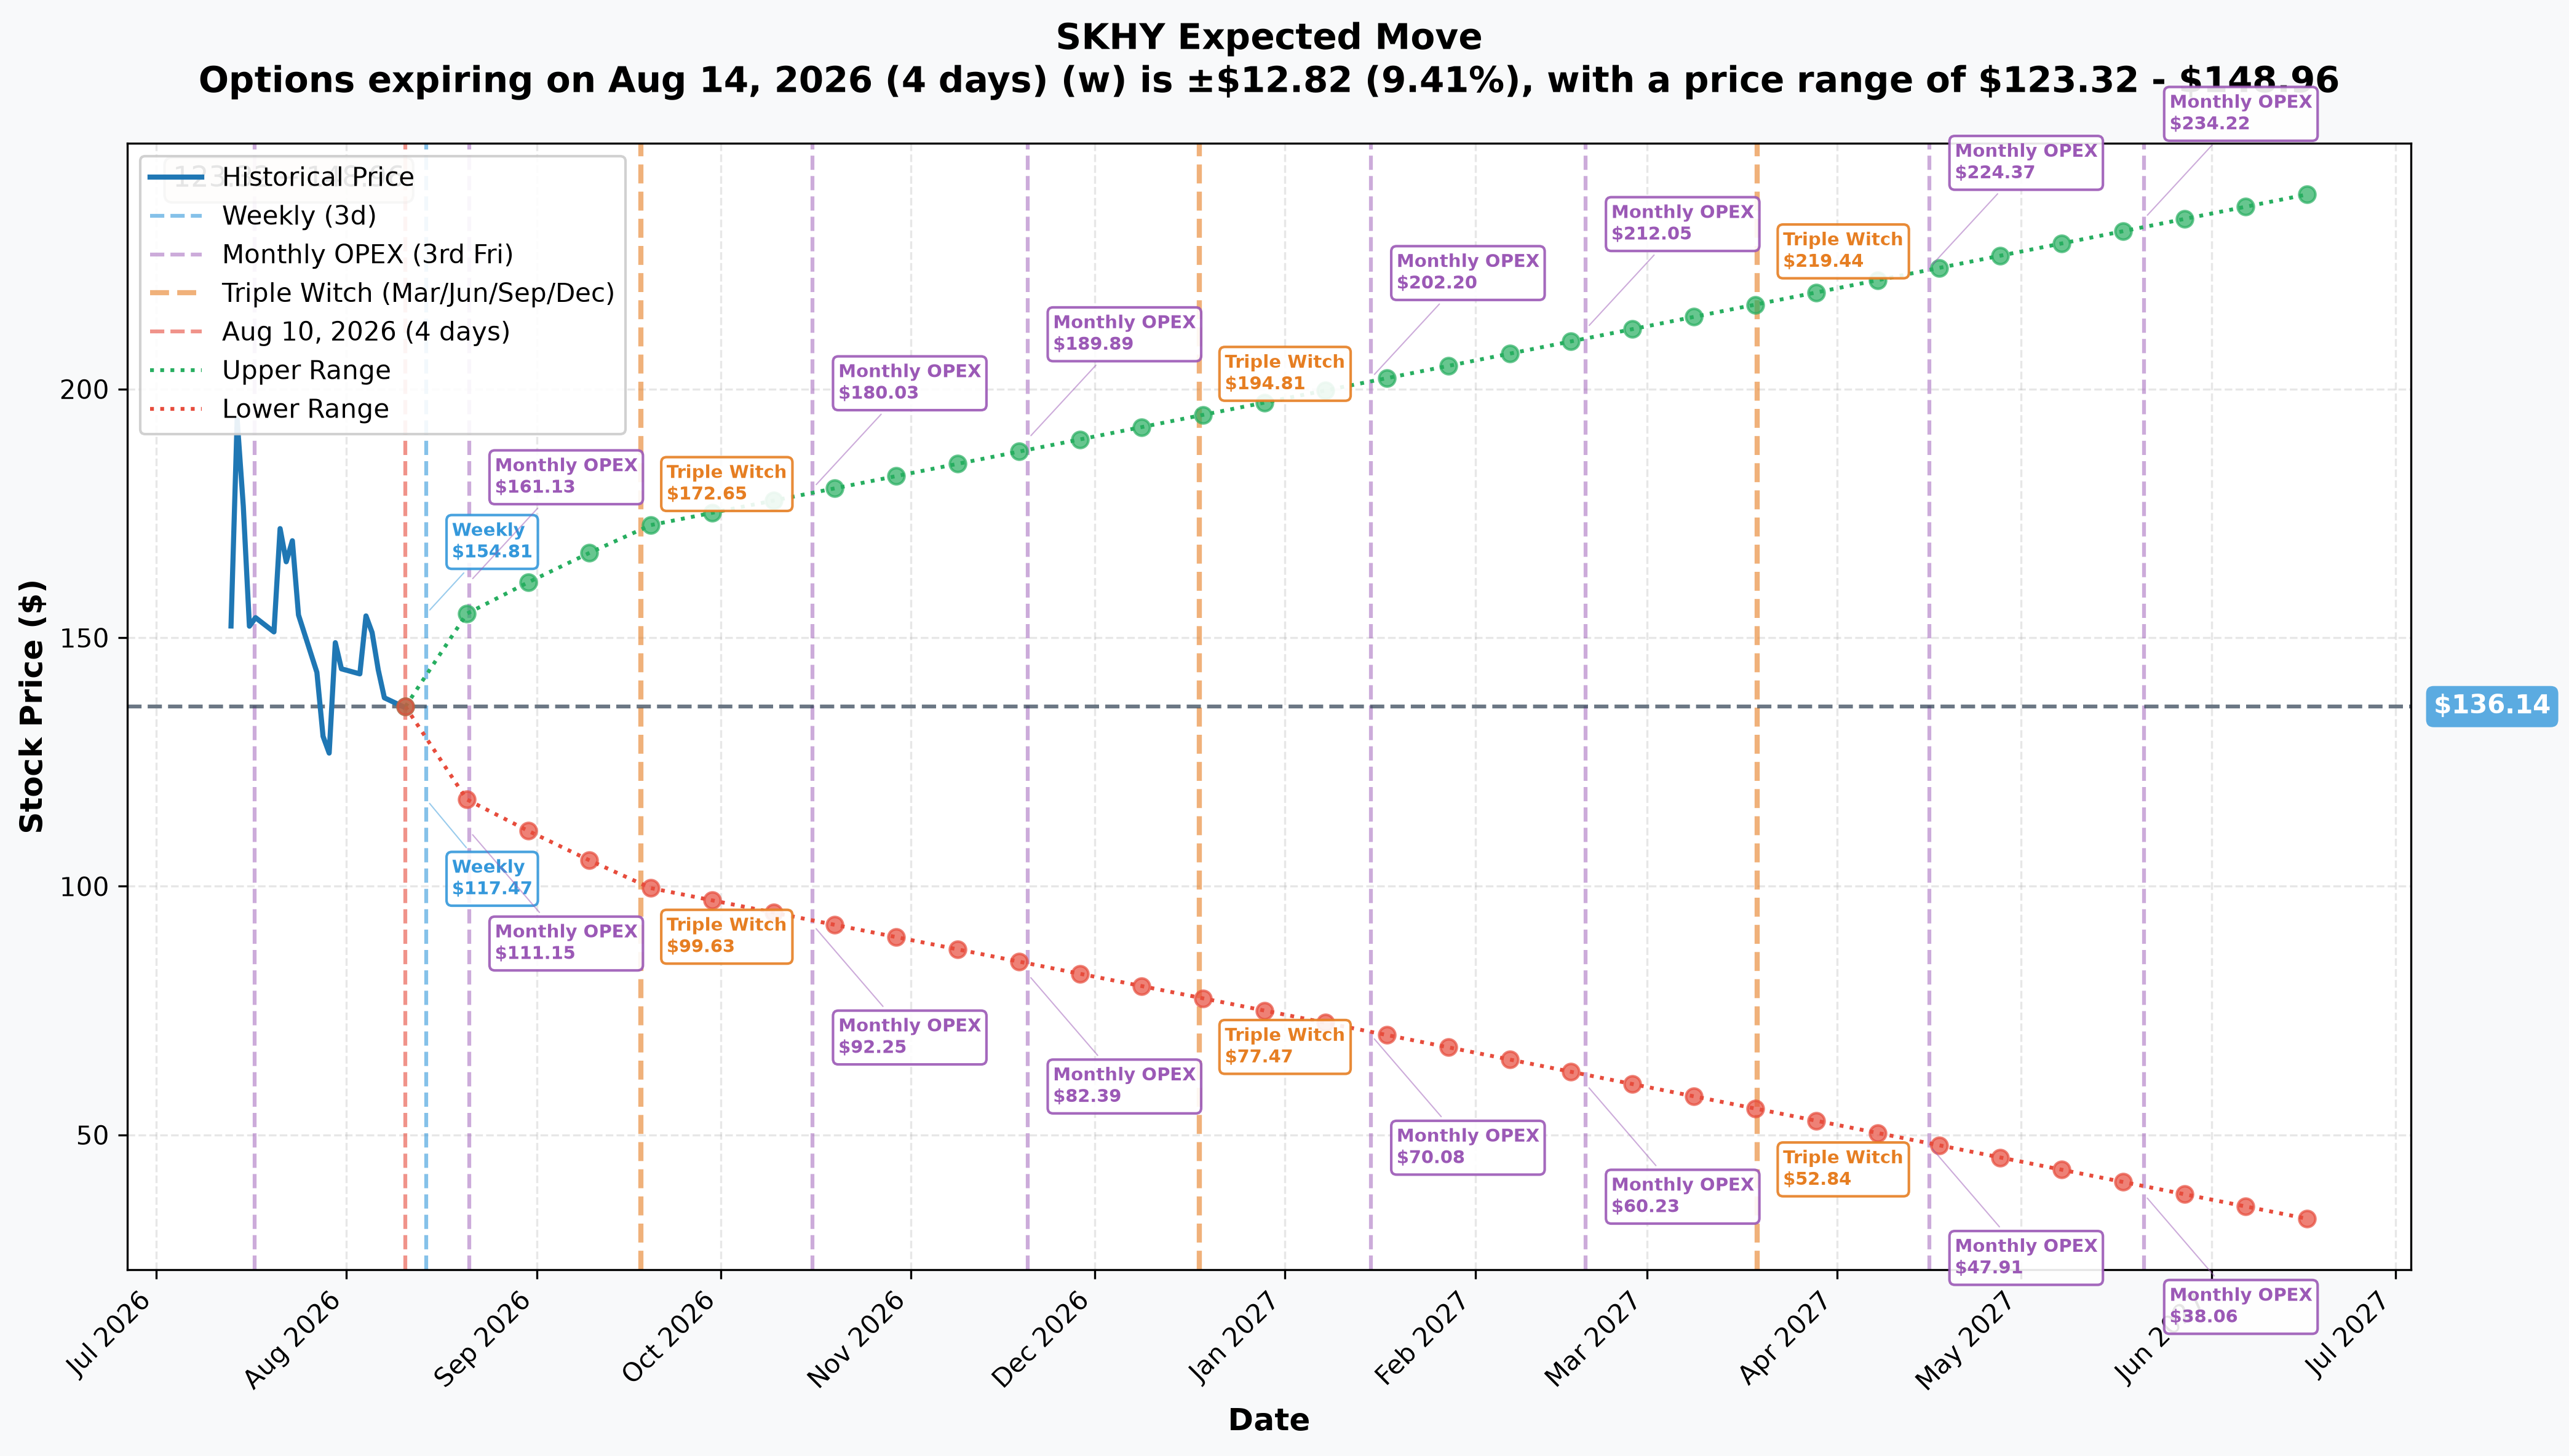
Options pricing (spot $136.14) currently implies:
- Weekly (Aug 14, 4 days): ±9.41% (±$12.82) → range $123.32 – $148.96
- Monthly OPEX (Aug 21, 11 days): ±14.43% (±$19.65) → range $116.49 – $155.79
- Quarterly triple witch (Sep 18, 39 days): ±26.63% (±$36.26) → range $99.88 – $172.40
- LEAPS-horizon (Jun 17, 2027, 311 days): ±75.84% (±$103.25) → range $32.89 – $239.39
That weekly range alone — a ±9.4% implied move in just four days — tells you how much realized volatility this name is still carrying. For context, the January 15, 2027 expiration used in today's collar sits at an implied upper/lower band of roughly $70.08 – $202.20 per the OPEX-label projections embedded in the same pricing surface — a huge range that underscores why a holder would pay real money for a floor at $120 rather than trust the stock to behave.
🎪 Catalysts
Confirmed, inside the January 15, 2027 window
- NVIDIA earnings, August 26, 2026 — the single most important read-through for HBM demand and pricing, arriving just 16 days from today.
- Micron earnings, September 22, 2026 — the cleanest US-calendar read on whether the DRAM +20–30% / NAND +35–40% Q3 pricing forecast from TrendForce/Adata actually lands.
- Nasdaq-100 index dates — reconstitution reference date November 30, 2026, announcement ≈December 11, 2026, effective December 21, 2026, all per the official Nasdaq-100 methodology. Treat this as a likely false catalyst: the methodology counts only the "depositary shares listed" for a Non-Primary ADR like SKHY, not the whole Korean company. The $26.5B raise at $149/ADR implies only ≈178 million ADRs — an index-relevant float of roughly $24B at current prices — which is very unlikely to clear the bar for inclusion.
Estimated, inside the window (not company-confirmed)
- SK hynix Q3 2026 results, ≈late October 2026 (≈Oct 21–29) — the only SK hynix earnings print the January 15, 2027 expiration will see. This date is derived from the company's own confirmed cadence (Q4'25 reported Jan 22, 2026; Q1'26 reported Apr 22, 2026; Q2'26 reported Jul 29, 2026, per the company's call invitation) — SK hynix has not itself announced a Q3 date.
⚠️ Critical: the FY2026 print falls just outside the window
SK hynix's Q4/FY2026 results, estimated ≈late January 2027 (≈Jan 21–28), fall roughly a week AFTER this option's January 15, 2027 expiration. Do not confuse the estimated Q3 print (inside the window) with the annual FY2026 results (outside it) — a holder wanting protection through the annual guide and profit-sharing decision would need a later expiration than the one used here.
The trigger for the crash this collar is insuring against
Q2 2026 results, reported July 29, 2026: EPS of $8.76 crushed the $5.12 consensus (a 71% beat), operating margin hit 76%, but revenue of $52.83B missed the $59.05B consensus by ≈10.5% (MarketBeat). The market read the revenue miss as a volume/mix problem rather than a pricing one, and that single data point is what triggered both the ADR's record-low close of $126.79 and the Seoul line's 54.7% peak-to-trough collapse.
Other live but undated risks inside the window
- A live labor dispute: ≈3,800 employees (11% of the domestic workforce) formed a new organizing group on August 5, 2026, in a standoff over paying profit-sharing in restricted stock — five negotiation rounds have already failed, per the Korea Herald. No strike date exists.
- A live competitive threat: Samsung's HBM4 yield reportedly hit 80% — matching SK hynix's own ≈80% — as of August 10, 2026, with Samsung targeting ≈38% HBM market share by year-end, per TrendForce.
- A live FX overhang: the company is converting an estimated ≈$1 billion/day of the raise's proceeds from dollars into won, "extending the dollar supply effect into September," per the Korea Herald.
🎭 Four Ways to Read This Trade
🎰 YOLO Trader
This isn't your trade to copy directly — a collar is what you build when you already have big unrealized gains you don't want to give back, not a way to speculate fresh. If you want the same shape of exposure without owning shares, buying the $120 put outright is the closest single-leg analog, but understand you'd be paying $18.93 for pure protection with no offsetting call premium — and the stock has already shown it can whipsaw +30% or −10% in a single Seoul session. Sizing this like a lottery ticket, on a name this volatile, is how accounts get wrecked fast.
🎯 Swing Trader
The gamma map gives you real levels to trade around: $130 is the nearest meaningful support (total gamma ≈6.03), $140 the nearest resistance (≈4.76). A range trade between roughly $130 and $145 — consistent with where dealer gamma is concentrated — is a more tactical way to play this than chasing the collar's own strikes. Just remember the weekly implied move alone is ±9.4%; normal position sizing rules for a mega-cap don't apply here.
💰 Premium Collector
The $220 call being sold for $10.63 against a spot of $136.15 — 61.6% out of the money — and still commanding real premium is itself the signal: this name's volatility skew is rich enough that selling far OTM calls against existing shares (a standard covered-call approach, not a naked short) can generate meaningful income. But be honest about the flip side: anyone who sold that same $220 call naked, rather than against stock, would be exposed to unlimited risk if the AI-memory narrative reignites and the stock actually clears $220 before January 2027 — do not sell uncovered calls on a name that has already proven it can move 30% in a day.
🌱 Beginner
This trade is a genuinely good teaching example of what a collar is, because both pieces are so cleanly visible: buy a put below the price (floor), sell a call above the price (ceiling), and the two premiums partly offset. Think of it like buying home insurance (the put) and partially paying for it by renting out your driveway to a neighbor who can use it whenever they want (the call) — you're protected from disaster, but you've given up some of your own flexibility in exchange. The lesson to take from SKHY specifically: this is a stock that gained over 1,000% in Korea before falling more than half in five weeks — even people who believe in the long-term story are choosing to protect themselves rather than simply "hold and hope."
⚠️ Honest Limits — What the Tape Cannot Prove
- We cannot see who is on the other side of the trade or why. The tape proves the trade happened as a negotiated block cross; it cannot prove the trader owns 500,000 ADRs, owns the underlying Korean shares, or is running some other portfolio hedge entirely. The collar shape strongly implies an existing long position, but that is an inference, not a fact from the print itself.
- We cannot see the sign of any pre-existing position with certainty. "Size > prior OI" on both legs strongly supports a fresh open, but it does not rule out the possibility that some portion nets against an existing holder on the other side of the cross — the next-day OI move (see the ✅ RESOLVED box above) was the actual confirming test — and on the $120 put it landed well below the full 5,000, rising just 1,793, which is exactly the scenario described here.
- ⚠️ The ADR does not currently reconcile to Seoul parity, and no one has a good explanation why. On August 10, 2026, SK hynix closed in Seoul at ₩1,420,000 with the won at 1,418.4/USD — at the stated 1:10 ratio, that implies ≈$100.1 per ADR-equivalent, versus SKHY's actual $135.88–$136.15. That's an apparent ≈36% ADR premium to the underlying Korean shares, and it could not be sourced or explained (candidates include limited DR-to-local convertibility, quote-timing mismatches, or a data discrepancy at the pricing source). Anyone assuming this collar hedges 1:1 against the "real" Korean stock should confirm the depositary agreement's actual conversion terms first — this gap is large enough to matter.
- ⚠️ No lock-up expiration date for the ADR could be sourced anywhere. Neither the company's own listing announcement nor the available press coverage discloses lock-up terms. If a standard 180-day lock-up applies from the July 10, 2026 listing, it would fall in early January 2027 — just inside this option's window — but that is an unverified assumption, not a confirmed date, and should not be relied upon when reasoning about this trade's timing.
- The SK hynix Q3 and Q4/FY2026 earnings dates used above are both estimates, derived from the company's own historical reporting cadence, not company-confirmed dates.
Disclaimer: Options trading involves substantial risk of loss and may not be suitable for all investors. This analysis is for educational purposes only and is not financial advice. SKHY carries additional risks beyond a typical US stock — currency exposure, an unresolved ADR-to-underlying pricing gap, and a very short trading history — that should be understood before trading it in any form. Nothing here should be read as a recommendation to replicate this specific collar. Always size positions to what you can afford to lose, and consider consulting a licensed financial advisor.
Last updated: 2026-08-11 (pre-market) — the next-day OPRA open-interest snapshot resolved this session's provisional flags. Jan-15-2027 $220C 142 → 5,110 (+4,968 on a 5,000-lot sale): OPEN (STO), essentially exact. Jan-15-2027 $120P 2,683 → 4,476 (+1,793): OPEN (BTO) but only ≈36% net-new — the caveat published here about the strike's recent unwind proved decisive, and ≈64% of the purchase matched against exiting holders rather than creating contracts. The collar is confirmed on both legs with a corrected net-new size. The ⏳ callout and honest-limits were updated.