⚠️ SLV: The $10M Print That Wasn't — a Busted Cross, and What Actually Stands ($1.005M)
📅 2026-08-04 | 🔥 Unusual Activity Detected — and Cancelled
🎯 The Quick Take
At 11:13:00 ET, a 30,009-lot block of the March 2027 $70 call printed on SLV as a stock-plus-options cross — a headline number north of $10M. Four and a half minutes later, at 11:17:48 ET, the exchange cancelled it. The identical size, the identical price, gone. What's actually still standing on the tape is a much smaller trade: 3,000 contracts at $3.35, or $1,005,000, hedged with a 75,000-share stock block. This is the most useful lesson on today's board, not the biggest trade — a headline print can evaporate hours after it hits your screen, and the only way to know is to go back and re-read the tape.
🏢 Company Overview
SLV — the iShares Silver Trust — is a physically-backed silver trust managed by BlackRock, launched April 21, 2006. It holds bullion in London vaults and tracks the LBMA Silver Price, less a 0.50% annual sponsor's fee that is paid in metal, not cash. Net assets sit at ≈$28.02B against 534.1 million shares outstanding, with a NAV of $52.46. There is no earnings, no management team, no product cycle here — SLV moves purely with the silver spot price and the trust's own bullion-per-share math.
The bullion math matters for reading this trade. SLV holds roughly 0.907 ounces of silver per share (an author-derived figure from net assets, shares outstanding, and silver's spot price — the trust's own official ounce count wasn't independently confirmed for this piece). That means silver spot at $70/oz corresponds to an SLV price near $63.50, not $70. A lot of retail traders instinctively read an SLV $70 call strike as "silver goes to $70" — it's actually a bet that silver clears roughly $77-78/oz, since $70 in SLV-share terms needs silver at ≈$70 ÷ 0.907. Convert every strike through that ratio before sizing up how far out-of-the-money a position really is.
💰 The Trade — And the Bust That Changes Everything
⚙️ Mechanism map — read this before the trade table
Both the cancelled print and the surviving print used the same execution mechanism: a stock-plus-options cross (a single negotiated package pairing an options block with a matching equity block, printed off the open order book — a known counterparty on both sides, not an aggressive sweep). The only thing that changed between 11:13:00 and 11:17:48 was that the exchange broke the larger of the two.
What printed, in order
| Time (ET) | Event | Size | Price | Premium | Mechanism | Status |
|---|---|---|---|---|---|---|
| 11:13:00.210 | 30,009 contracts | $3.35 | ≈$10.05M | Stock-plus-options cross | ❌ CANCELLED at 11:17:48 | |
| 11:17:48.824 | Cancellation | 30,009 contracts | $3.35 | — | Cancel (identical size/price to the 11:13:00 print) | Removed from the tape |
| 11:13:05 | Surviving trade | 3,000 contracts | $3.35 | $1,005,000 | Stock-plus-options cross | ✅ Stands |
Full trade details (the trade that stands)
| Field | Value |
|---|---|
| Time | 11:13:05 ET |
| Buy/Sell | BUY |
| Call/Put | CALL |
| Expiration | 2027-03-19 |
| Strike | $70 |
| Option Price | $3.35 |
| Premium | $1,005,000 |
| Volume (day) | 63,121 |
| Prior OI | 7,708 |
| Size | 3,000 |
| Spot | $53.85 |
| Option Symbol | SLV20270319C70 |
| Flow tag | 🤝 BLOCK CROSS (stock-plus-options) |
How we know it's really 3,000, not 30,009 — the equity tape corroborates it independently. The only SLV stock block anywhere in the surrounding window is 75,000 shares at $53.76, printed at 11:13:31. At the option's delta of ≈0.317, a proper hedge for that block is 75,000 ÷ (0.317 × 100) ≈ 2,366-3,000 contracts — in the same ballpark as the 3,000-lot that survived, not anywhere near 30,009 (which would need roughly 950,000 shares of stock to hedge). The busted print left no matching equity footprint anywhere on the tape; the surviving print does. Two independent tapes — options and equity — tell the same story.
The $70 strike is ≈30% above spot ($53.85), expiring March 19, 2027 — a LEAPS-dated, moderately out-of-the-money call, converted through the bullion ratio that's roughly a bet on silver spot clearing ≈$77/oz.
✅ RESOLVED — The Falsifiable Test Passed, on Both Counts
Updated 2026-08-05 pre-market. The ≈06:30 ET OPRA snapshot (reflecting the August 4 close) has published, and it landed on the first of the three outcomes above — the one we predicted.
| Leg | Baseline OI (Aug-4 snap) | Resolving OI (Aug-5 snap) | Δ | Print size | Δ as % of print | Verdict |
|---|---|---|---|---|---|---|
| Mar-19-2027 $70 C (bought) | 7,708 | 10,351 | +2,643 | 3,000 | ≈88.1% | ✅ OPEN (BTO) — was ⏳ provisional |
Two things got confirmed at once, and the second one matters more.
- The surviving 3,000-lot opened. OI rose 2,643 — about 88% of the print created brand-new contracts. The BTO framing is confirmed; the "it might have been a close" branch is closed out.
- The bust read was right. This is the important one. If the full 30,009-contract print had actually stood, open interest would have jumped by roughly 30,000, to ≈37,700. It rose by 2,643. The cancellation at 11:17:48 really did wipe out the entire 30,009-lot — confirmed independently by the open-interest record, not just by the condition code on the tape.
Any scanner that flagged a "$10M SLV call buy" on August 4 was flagging a print that no longer exists. The real trade was a $1.0M, 3,000-contract, stock-hedged long call.
🤓 What This Actually Means — Plain English
What is a "busted" trade? Exchanges occasionally cancel a trade after it prints — this is officially called a "trade bust" or "trade cancellation." It happens for reasons like a clerical error in size or price, a system glitch during a negotiated block's reporting, or a dispute between the counterparties about the terms that got resolved by unwinding the print entirely. It is not common — most prints stand as-is — but it is a real, documented feature of how exchanges operate, and OPRA (the options tape) carries a specific cancellation condition code for exactly this situation. When a trade busts, it's as if it never happened: no position was created, no premium changed hands, and any "unusual options activity" scanner that flagged the original 30,009-lot print was flagging something that no longer exists.
What is a "stock-plus-options cross"? This is a single negotiated package where a broker matches a buyer and seller for both an options block and a related stock block at the same time, printed together off the open order book. It's a known-counterparty, pre-arranged trade — not a sweep lifting offers in the lit market. The stock leg is typically there to delta-hedge the options leg, which is exactly what we see in the surviving 3,000-lot: 75,000 shares against 3,000 calls at ≈0.317 delta lines up almost exactly.
Why does the size mismatch prove the bust, rather than just suggest it? Because the option tape and the equity tape are two independently maintained records. If the full 30,009-lot had truly executed and needed hedging, we'd expect to see a stock block roughly ten times larger than the 75,000 shares we actually find — closer to 950,000 shares. There is no such block anywhere in the window. The math only closes for the 3,000-lot. That's strong, independent confirmation that the cancellation at 11:17:48 really did wipe out the entire 30,009-lot, not some smaller portion of it.
Bottom line on order type: the surviving 3,000-lot is BTO (bought to open) — a long call, hedged with stock — now confirmed by the next-day OI snapshot (open interest rose 2,643 against the 3,000-lot; see the RESOLVED box above).
📈 Technical Setup
YTD Chart
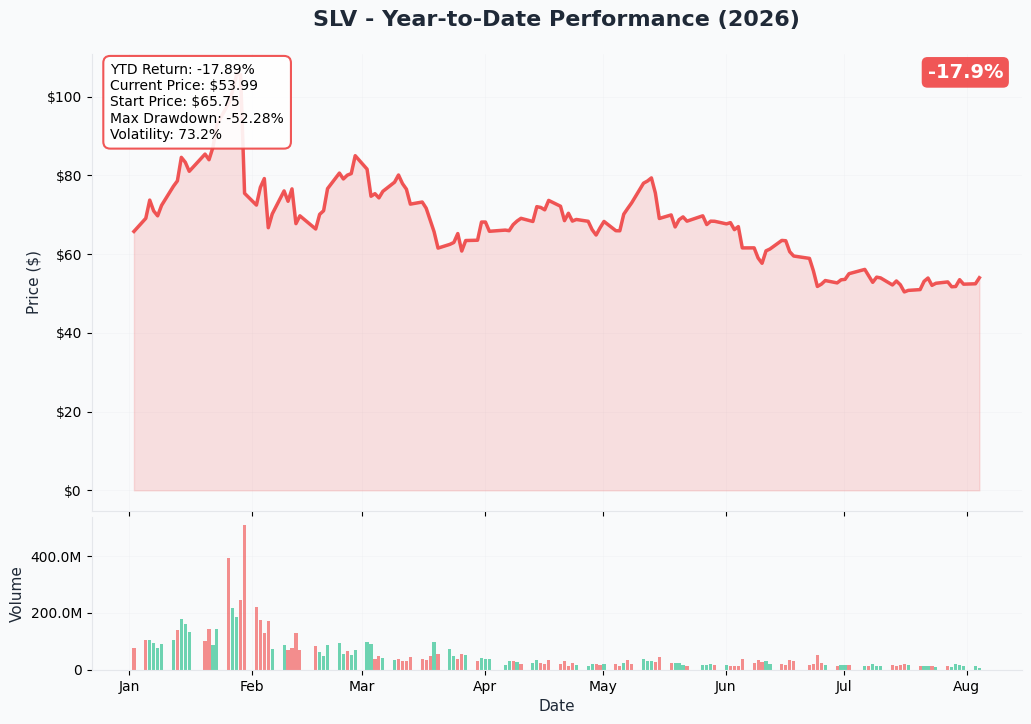
SLV is −17.9% over the past year, a chart that tells a boom-bust story in one line: silver spiked above $121/oz in late January 2026, and has since round-tripped down to ≈$59.89/oz spot (SLV itself at $53.85). The trust's own 52-week range is $33.85–$109.83, meaning SLV currently sits roughly 51% below its 52-week high. This is a stock recovering from a violent unwind, not one making new highs — worth keeping in mind against a $70-strike call that's still 30% above where SLV trades today.
Gamma-Based Support & Resistance
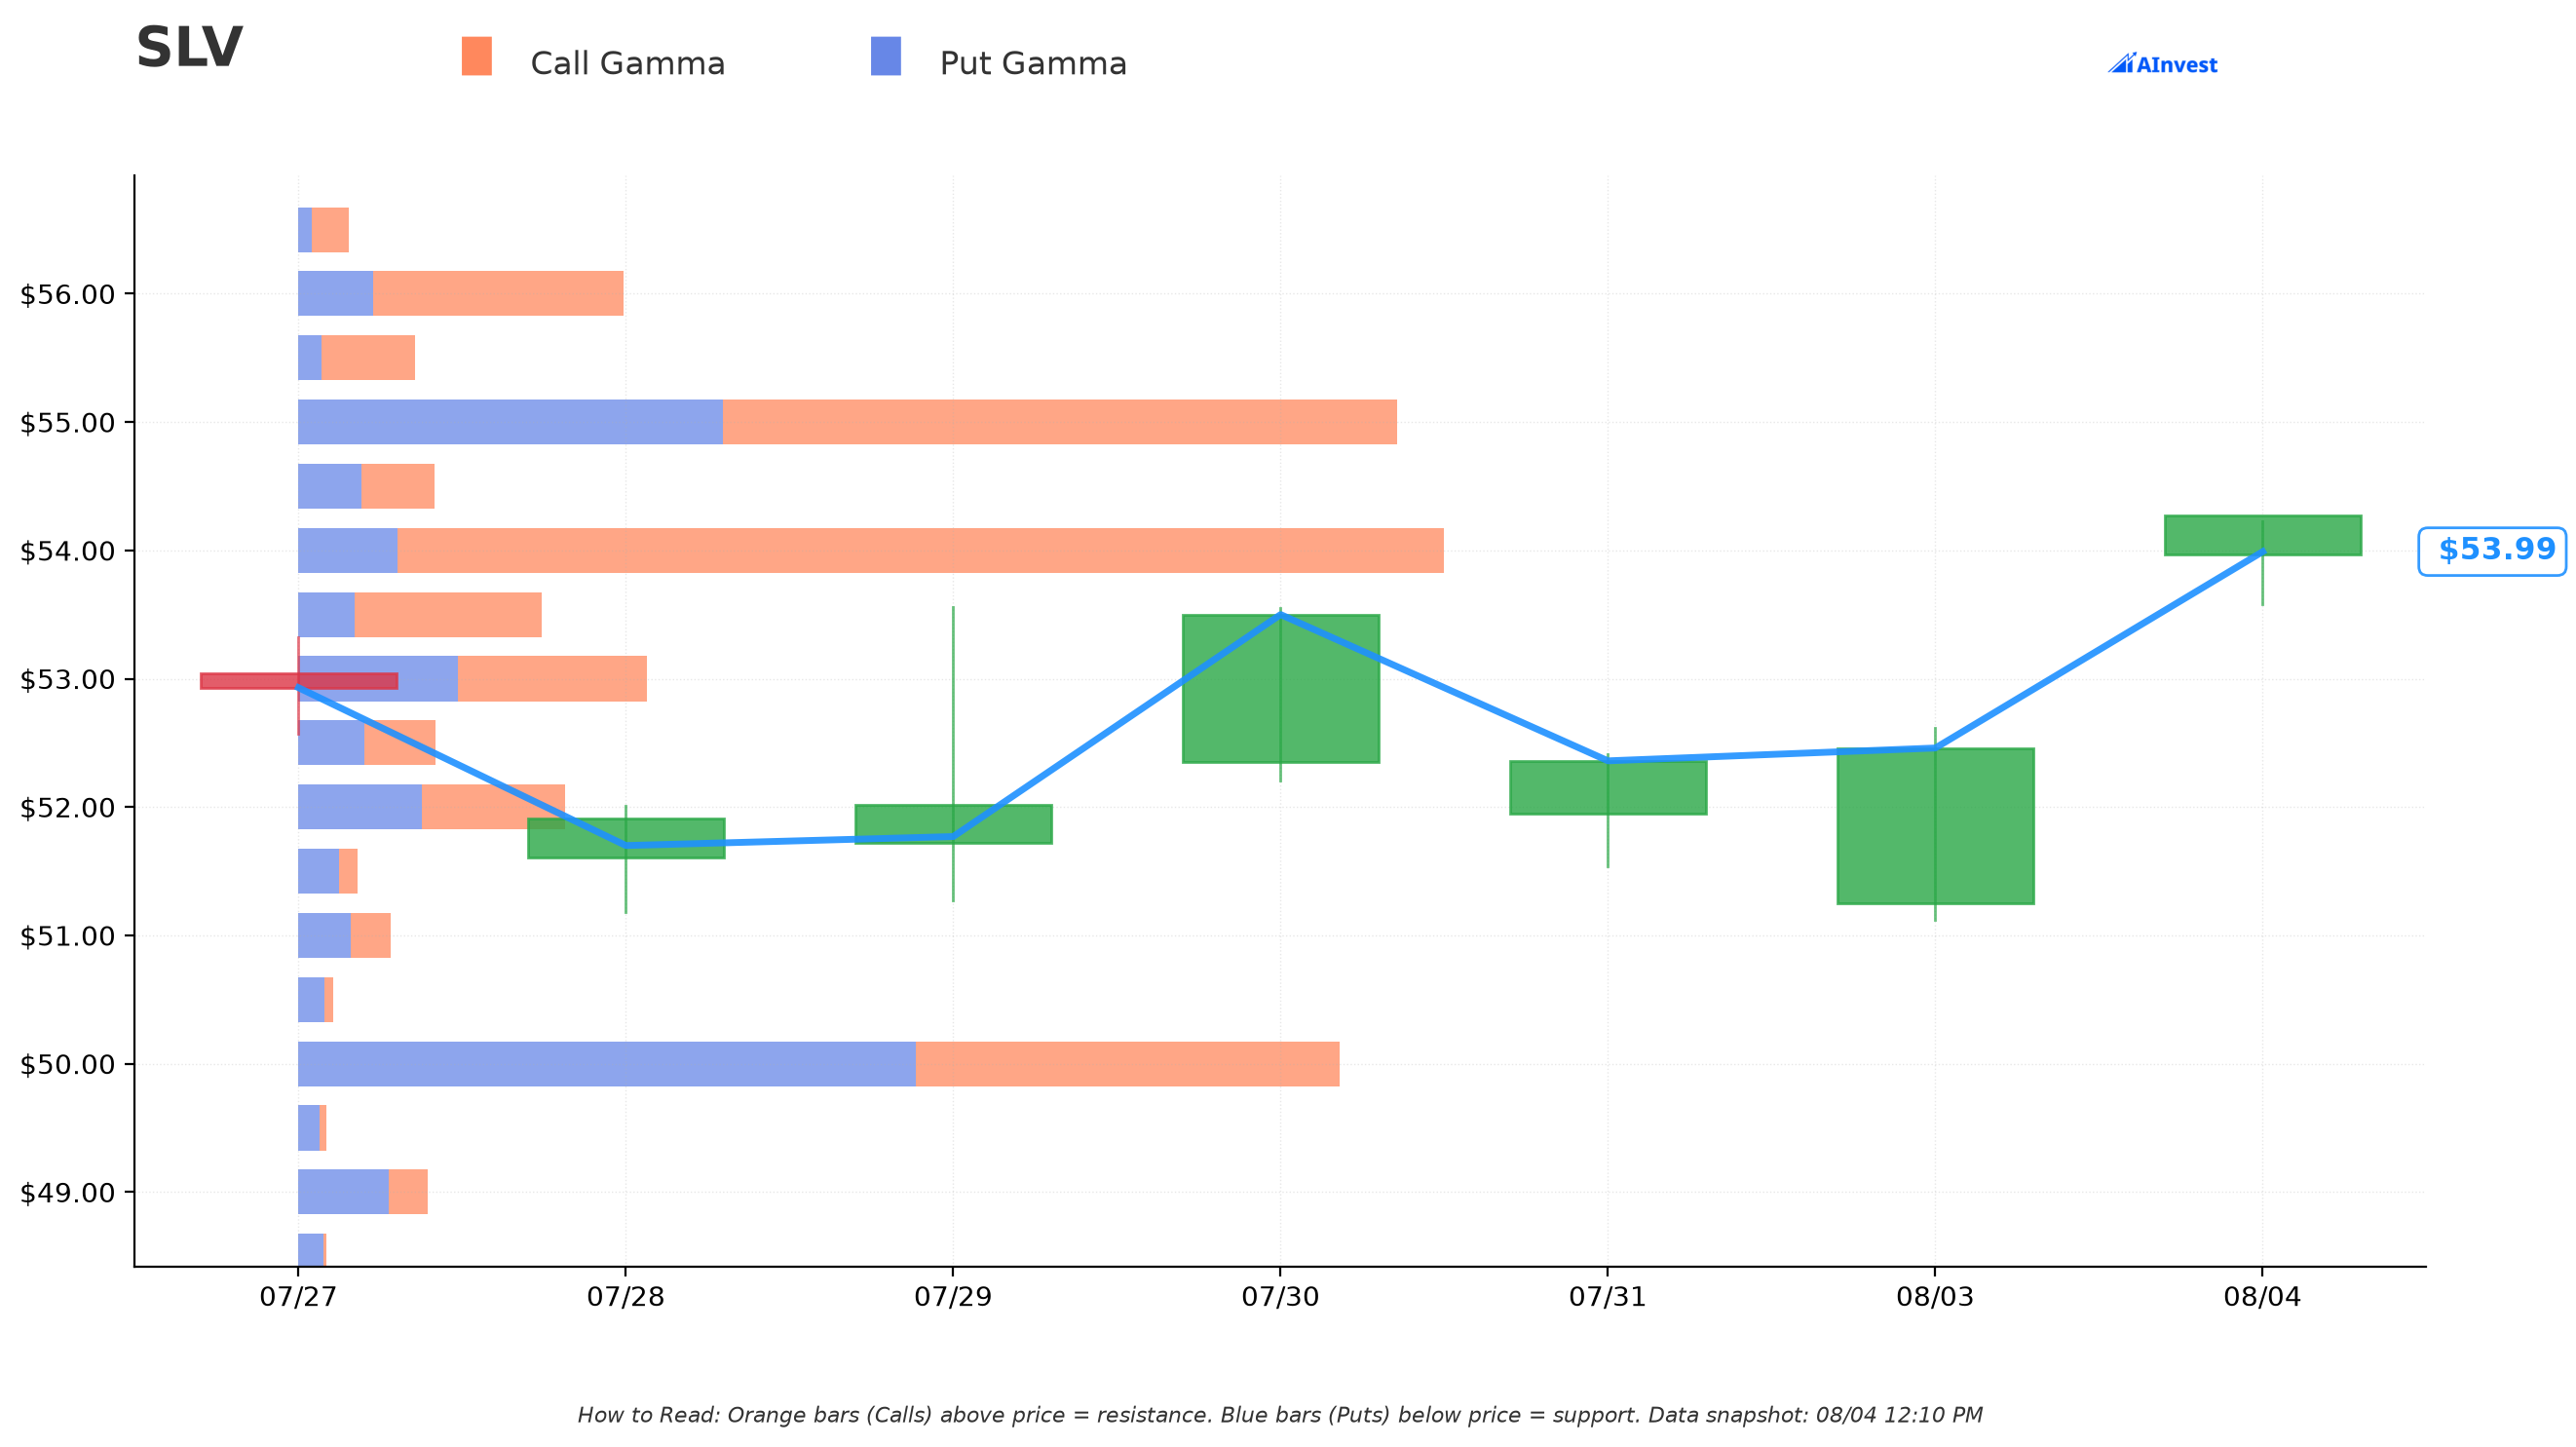
Reference spot for this map: $53.98.
- Resistance: $54.00 — essentially at-the-money, and the single strongest level on the board (≈$64.4M total gamma, overwhelmingly call-side at ≈$58.8M call gamma vs. only ≈$5.6M put gamma). Dealer hedging is concentrated right at today's price.
- Support: $50.00 (≈7.4% below spot) — ≈$58.5M total gamma, put-dominated (≈$34.7M put vs. ≈$23.8M call), the strongest floor below current levels.
- Further out, $60.00 carries ≈$70.5M total gamma (call-dominated, ≈$51.6M call vs. ≈$18.9M put) — the next real resistance wall above spot, ≈11.2% away.
- Out at the $70 strike from today's trade, total gamma is a comparatively modest ≈$27.5M (call-leaning, ≈$19.6M call vs. ≈$7.9M put), ≈29.7% above spot — this strike sits well outside the market's current gamma center of gravity, consistent with a long-dated, speculative-tail position rather than a near-term directional lever.
Implied Move
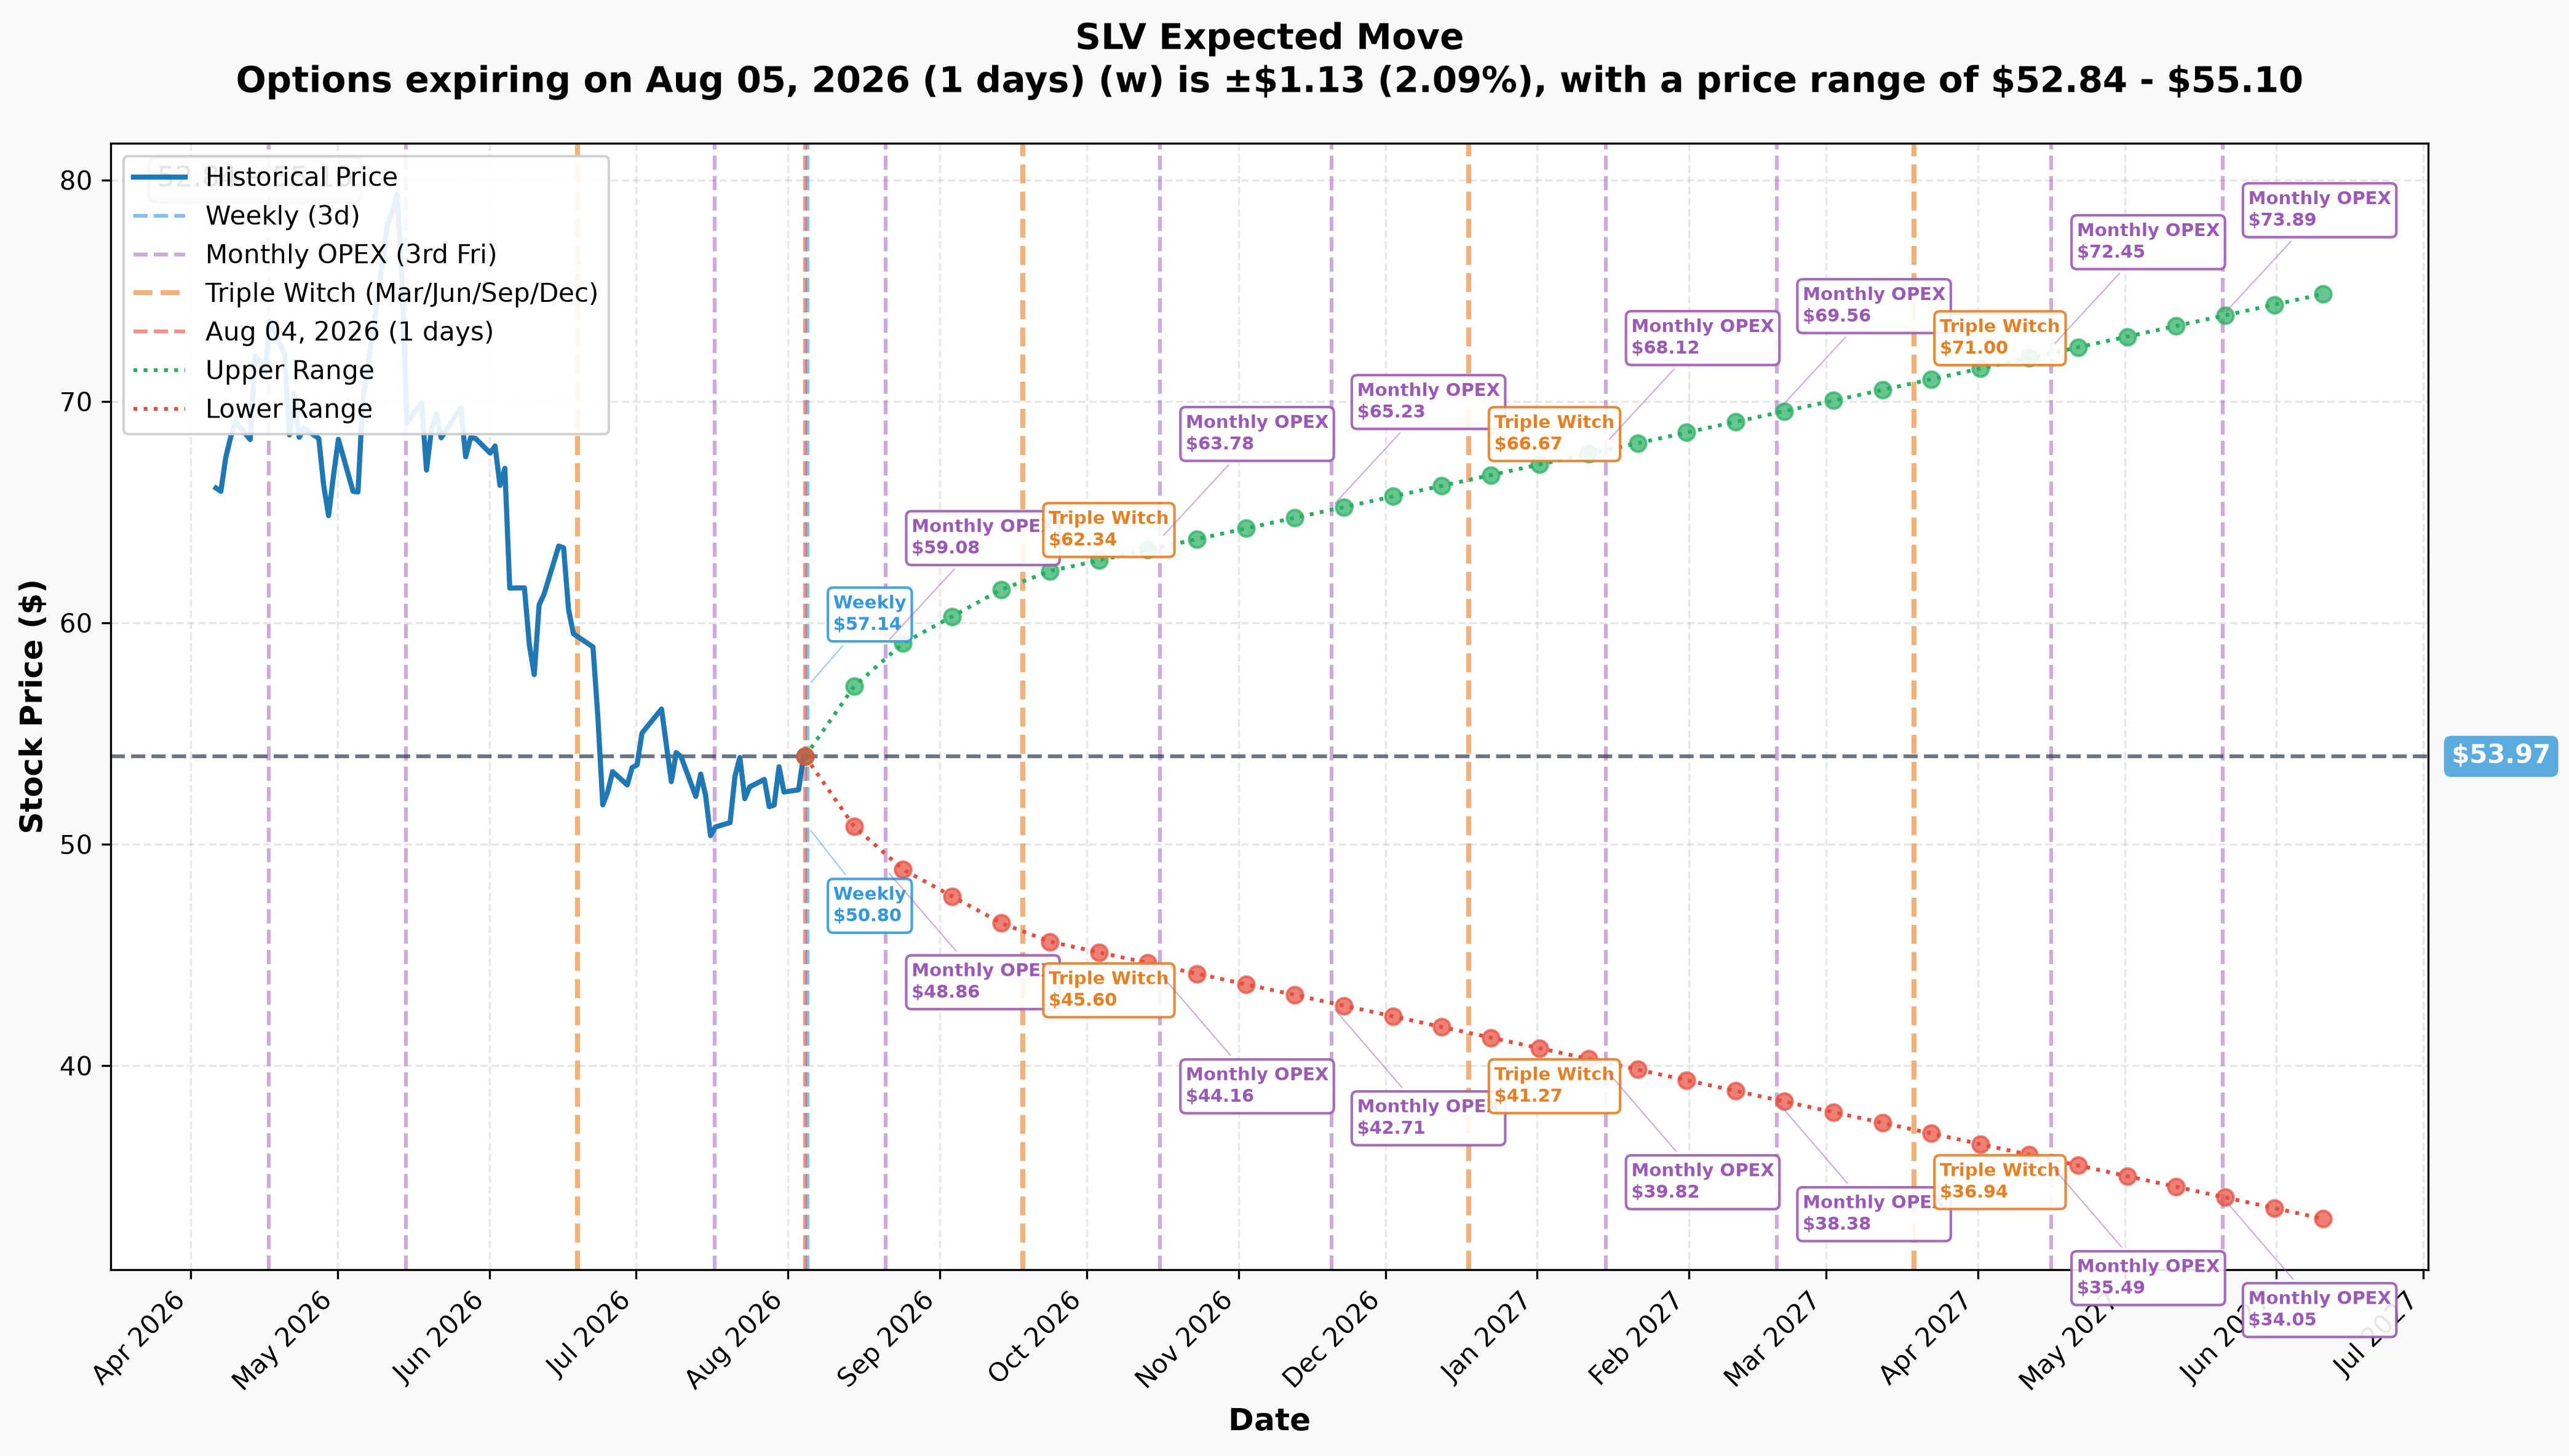
| Expiry | Days to expiry | Implied move | Range |
|---|---|---|---|
| Weekly (2026-08-05) | 1 | ≈2.09% (≈$1.13) | $52.84 – $55.10 |
| Monthly OPEX (2026-08-21) | 17 | ≈8.81% (≈$4.75) | $49.22 – $58.72 |
| Quarterly / Triple Witch (2026-09-18) | 45 | ≈15.06% (≈$8.13) | $45.84 – $62.10 |
| Yearly LEAPS (2027-06-17) | 317 | ≈39.32% (≈$21.22) | $32.75 – $75.19 |
The March 19, 2027 expiry used in today's trade sits beyond even the yearly-LEAPS reading above (317 days to expiry vs. ≈360+ for March 2027), so there's no directly labeled implied-move number for that exact date — but the trend is unmistakable: the market is pricing an ever-widening cone the further out you go, and the $70 strike ($75.19 upper bound on the nearest labeled LEAPS expiry) sits right at the edge of what the options market currently considers a plausible one-year move. That's a real bet on continuation of silver's volatility regime, not a layup.
⚡ Catalysts
🟡 Near-term, dated
- August 12, 2026 — July CPI report. Kitco frames markets as "in limbo until the August 12 CPI report and September FOMC meeting" (Kitco). This is the highest-density near-term catalyst — eight days out.
- September 15-16, 2026 — FOMC meeting with a Summary of Economic Projections. Markets currently price ≈60% odds of a 25bp hike, not a cut (Kitco, Jul 30, 2026). A dot plot showing a 2026-27 hiking path would be the single biggest bearish catalyst for silver in this window.
- Already passed: the July 29, 2026 FOMC held rates at 3.50%-3.75% on a 9-3 vote, with three dissents — Hammack, Kashkari, and Logan — all favoring a hike (Federal Reserve). This is a Fed debating hikes, not cuts.
- December 8-9, 2026 — FOMC with a second dot plot, sets the 2027 real-rate path.
- Monthly LBMA vault data, published the fifth business day of each month (LBMA) — June's reading showed London silver vaults rising 1.7% month-over-month to 902.3 million ounces, evidence the physical squeeze that drove January's spike has eased, not worsened.
🔵 Structural, inside the March 2027 expiry
- The gold/silver ratio sits at ≈69.1, well above the Silver Institute's estimated long-run equilibrium of "just under 60:1" (Silver Institute, Jul 21, 2026) — the cleanest bull argument on the table, though the ratio was below 50 as recently as January 2026, so it has already de-rated sharply once this year.
- Industrial demand is shrinking structurally. 2026 fabrication is forecast to hit a four-year low near 650 million ounces on solar-panel "thrifting and substitution" away from silver (Silver Institute, Feb 10, 2026) — a largely irreversible design change, not a cyclical dip.
- The deficit narrative got revised down materially: the Silver Institute's 2026 deficit estimate fell from 67 million ounces (February) to 46.3 million ounces (April) (Feb 10 vs. Apr 15) — a 31% cut. Both numbers still circulate; treat "structural deficit" as a real but shrinking tailwind, not a squeeze trigger.
👥 Four-Reader Interpretation
🎲 YOLO trader: There isn't a real trade to copy here — the headline print you may have seen this morning doesn't exist anymore. What's left is a comparatively small $1M position on a strike that, once you convert through SLV's ≈0.907 oz/share ratio, needs silver near $77-78/oz to pay off from a $53.85 stock. If you want silver upside exposure, size to the real trade (3,000 lots, not 30,009) and understand you're buying a multi-year LEAP, not a quick swing.
📊 Swing trader: The gamma map is the more actionable read here than the busted print. $54 is the strongest level on the board right now — essentially at spot — with $50 the next real floor and $60 the next real ceiling. That $50-$60 band, inside the ≈8.8% monthly-OPEX implied move, is a cleaner near-term frame than trying to draw a conclusion from a trade that no longer exists.
💰 Premium collector: Nothing here screams premium-selling setup — the surviving trade is a long call, not a short one. But the lesson generalizes: before you sell premium against any "whale flow" headline, verify the print actually stands. A busted cross that still shows up in a stale scanner could lead you to misprice risk against a position that was never real.
🌱 Beginner: Two lessons in one trade. First, a $10M headline can vanish — exchanges cancel trades for legitimate operational reasons, and a mid-morning print is not proof a position exists by afternoon. Second, SLV is not silver spot — it's ≈0.907 ounces of silver per share, and shrinking every year because the trust pays its 0.50% fee in metal. A "silver $70" story does not mean "SLV $70." Always convert the strike before you decide how far out-of-the-money a call really is.
⚠️ Honest Risk & Limits
- We cannot see the reason the exchange cancelled the 30,009-lot. OPRA tells us a cancellation happened, at the identical size and price, four and a half minutes after the original print — it does not tell us why (clerical error, counterparty dispute, reporting glitch, or something else). That's an honest gap.
- Open vs. close on the surviving 3,000-lot is not provable from today's tape. Size (3,000) sits below prior open interest (7,708) — see the falsifiable OI test above.
- The tape cannot tell us broker identity, counterparty identity, order ID, or any additional hedge sitting behind this position (futures, other option strikes, or an offsetting stock position beyond the 75,000-share block we matched).
- The ≈0.907 oz/share figure for SLV's bullion holding is an author calculation, derived from net assets, shares outstanding, and silver's spot price — not sourced directly from the trust's official holdings file, which returned an access error when checked.
- The 2026 silver deficit estimate is genuinely unsettled — 67 million ounces (February) vs. 46.3 million ounces (April) are both still-circulating, sourced figures from the same publisher. We present the conflict rather than picking one.
- Options trading involves substantial risk of loss and is not suitable for all investors. Long-dated LEAPS calls, silver's elevated volatility regime (≈3.5% average daily true range), and the structural fee drag on SLV all compound the risk here. Nothing in this piece is a recommendation to buy or sell any specific position — it is a forensic read of what printed, and un-printed, on the tape today.
Resolved 2026-08-05 pre-market: SLV's March-2027 $70 call open interest moved to 10,351 — against a prediction of ≈10,700. The surviving 3,000-lot opened, and the 30,009-contract bust is confirmed by the open-interest record. See the ✅ RESOLVED box above.
Last updated: 2026-08-05 — next-day OPRA open-interest resolution added: confirmed OPEN (BTO); the 30,009-lot bust independently confirmed by open interest.