🎯🛡️ SMH ≈$44M Premium Harvest — Delta-Hedged Bet That Semis Stay Boxed Between $500-$550
📅 July 30, 2026 | 🔥 Unusual Activity Detected
🔄 CORRECTION + ✅ UPDATE — July 31, 2026 pre-market. Two things changed after the next-day check. (1) The call leg was smaller than first reported. One of the two 5,000-lot call clips was cancelled by the exchange and re-reported at 2,000, so the call sale was 8,000 contracts for ≈$17.6M, not 10,000 for $22M. That takes the program's total premium from $49M down to ≈$44M, and this article's figures have been corrected throughout. (2) Both legs are confirmed OPENING (STO) — open interest rose 1,867 → 10,006 on the calls and 185 → 3,139 on the puts. The delta-hedged, short-volatility interpretation is unchanged; only the scale is smaller. See the ✅ RESOLVED box below.
🎯 The Quick Take
Someone just collected ≈$44 MILLION in option premium on the VanEck Semiconductor ETF (SMH) today — but before you get excited about a "$44M whale bet," here's the twist: every single leg was paired with a matching stock block, meaning this trader is fully delta-hedged and has zero net directional exposure to SMH's price. This is a short-volatility, premium-harvesting program, not a bullish or bearish wager. Translation: smart money isn't betting semis go up or down — they're betting semis go sideways inside a $500-$550 box while collecting rich premium left over from July's brutal selloff.
📊 Company Overview
SMH (VanEck Semiconductor ETF) is the benchmark U.S. semiconductor ETF, tracking the 25 largest, most liquid U.S.-listed chip companies:
- AUM: ≈$69 billion
- Holdings: ≈26 names, top 10 ≈71% of assets
- Top 5 weights: Nvidia (NVDA) ≈20.8%, Taiwan Semiconductor (TSM) ≈9.2%, Broadcom (AVGO) ≈6.2%, AMD ≈6.0%, Micron (MU) ≈5.3%
- Current price: ≈$538-540, in a $524.62-$544.61 intraday range
- 52-week range: $279.19 – $671.83
SMH is basically a leveraged proxy on AI-accelerator demand — nearly a third of the fund is NVDA + AVGO + AMD combined. After a record Q2, the Philadelphia Semiconductor Index (SOX) fell >20% from its late-June peak into bear-market territory, dragging SMH from ≈$612 down to ≈$538 on AI-capex-return skepticism, profit-taking, and a hawkish Fed under new Chair Kevin Warsh.
💰 The Option Flow Breakdown
📊 What Just Happened — The Tape
All three legs printed as negotiated 🤝 block crosses (known counterparty, off the open book) — and each one is verified delta-hedged against a matching stock block. This is one coordinated premium-harvest program, not three separate bets.
| Time | Symbol | Buy/Sell | Call/Put | Expiration | Premium | Strike | Volume | OI | Size | Spot | Option Price | Option Symbol |
|---|---|---|---|---|---|---|---|---|---|---|---|---|
| 09:53:06 | SMH | SELL | CALL | 2026-08-21 | $11.0M | $550 | 5,200 | 1,867 | 5,000 | $534.16 | $21.96 | SMH20260821C550 |
| 09:54:08 | SMH | SELL | CALL | 2026-08-21 | $4.4M | $550 | 10,000 | 1,867 | 2,000 (originally printed 5,000 — cancelled and re-reported) | $535.83 | $21.96 | SMH20260821C550 |
| 09:56:35 | SMH | SELL | CALL | 2026-08-21 | $2.3M | $550 | 11,000 | 1,867 | 1,000 | $536.32 | $22.71 | SMH20260821C550 |
| 11:27:49 | SMH | SELL | PUT | 2028-01-21 | $26.8M | $500 | 3,000 | 185 | 3,000 | $535.81 | $89.35 | SMH20280121P500 |
🔄 Note on the corrected size. The second call clip originally printed as 5,000 contracts at 09:54:08. Roughly two minutes later the exchange cancelled that print and re-reported it at 2,000 — a routine size correction, but one that matters, because it removes 3,000 contracts (≈$6.6M of premium) from the headline. A third 1,000-lot clip followed at 09:56:35. The genuine call sale is 8,000 contracts for ≈$17.6M, and the next-day open-interest build of +8,139 confirms that figure almost exactly. Anyone reading the raw tape without filtering the cancellation would overstate this trade by 25%.
🤝 Flow-type tags:
- Call legs (8,000 total Aug-21 $550 calls, ≈$17.6M combined credit): 🤝 Block Cross → Delta-Hedged Covered Call / Overwrite
- Put leg (3,000 Jan-21-2028 $500 LEAP puts, ≈$26.8M credit): 🤝 Block Cross → Delta-Hedged Short Put
Combined: ≈$44M in premium collected across the program.
✅ RESOLVED — Both Legs Confirmed Opening, and the OI Caught the Cancelled Clip
Both structures printed well above their prior open interest, so the "fresh open" read was already likely. The July 31 pre-market OPRA snapshot confirms both legs — and independently proves the corrected call size:
| Leg | Baseline OI (Jul 30 snap) | Resolving OI (Jul 31 snap) | Δ | Corrected size | Δ as % of size | Verdict |
|---|---|---|---|---|---|---|
| Aug-21-2026 $550 Call (sold) | 1,867 | 10,006 | +8,139 | 8,000 | ≈102% | ✅ OPEN (STO) |
| Jan-21-2028 $500 Put (sold) | 185 | 3,139 | +2,954 | 3,000 | ≈98% | ✅ OPEN (STO) |
The call leg is the interesting one. We told you to expect open interest to jump "from ≈1,160 toward ≈11,000+." It landed at 10,006 — a build of 8,139, which is ≈102% of the corrected 8,000-contract size but only ≈81% of the originally-reported 10,000. That gap is not a partial open or a transfer; it is the cancelled 3,000 contracts showing up in the data. Open interest and the corrected tape agree with each other to within 139 contracts, which is exactly the small amount of ordinary lit trading that also happened at the strike. Two independent records telling the same story is as clean a confirmation as this data offers.
The put leg is a straightforward full open: 185 → 3,139 against a 3,000-lot print, ≈98% — essentially every contract sold was brand new. No cancellations appeared anywhere on the put tape.
What this does and does not change. The structure is unchanged: this is still a delta-hedged covered call plus a delta-hedged short LEAP put — a short-volatility, premium-harvest program with no net directional bet. What changed is the scale: ≈$44M collected rather than $49M, and 8,000 calls of upside rented out rather than 10,000. One honest limit worth stating: the three equity hedge blocks (205,000 + 205,000 + 41,000 = 451,000 shares) were sized against the originally reported call quantity. Whether the stock leg paired with the cancelled clip was separately adjusted is not visible on either the options or equity tape — so treat the precise hedge ratio as approximate, even though the hedged, non-directional character of the trade is not in doubt.
🤓 What This Actually Means — Plain English
Let's decode this piece by piece, because the headline "≈$44M!" number is misleading on its own.
1. The ≈$17.6M Aug-21 $550 call sale = a covered call, not a naked bearish bet. Selling 8,000 calls naked would be a big bearish/leveraged bet with theoretically unlimited risk. But the tape shows this seller simultaneously bought SMH stock in blocks alongside every call clip (205,000 + 205,000 + 41,000 shares), sized to the calls' ≈0.41 delta. That combo — long stock + short calls — is the textbook covered call / overwrite. It's an income strategy: the trader already owns (or just bought) a big chunk of SMH and is renting out the upside above $550 through August 21 in exchange for ≈$17.6M cash today. If SMH stays below $550, they keep the stock AND the premium. If it rips through $550, their upside gets capped there — but they don't lose money, they just stop gaining above the strike.
2. The $27M Jan-2028 $500 put sale = a delta-hedged short put, not a leveraged bearish gamble. Selling puts naked means being on the hook to buy shares at $500 if SMH craters — a real directional risk. But this seller also traded a stock block (≈84,000 shares) sized to offset the put's ≈0.28 delta almost exactly. That neutralizes the day-to-day directional exposure. What's left is a pure premium-harvest / short-volatility position: they're getting paid $27M today to be willing to own SMH near $500 (≈7% below spot) over an ≈18-month window, while hedging out the immediate up-down risk with the stock leg.
3. Put it together: this is a $500-$550 "stay in the box" bet. A near-term cap at $550 (the sold calls) plus a longer-term floor around $500 (the sold puts) is a classic range/premium-harvest posture — the trader is monetizing SMH's still-elevated implied volatility after the July drawdown, not making a directional call on where semis go next. Even more telling: both strikes sit almost exactly on major dealer gamma walls (see the chart section below) — $500 is one of the strongest gamma support levels on the whole chain, and $550 is one of the strongest resistance levels. This trader picked strikes the options market is already treating as natural pivots.
Bottom line: don't read the ≈$44M headline as "someone is bullish" or "someone is bearish" on SMH. Read it as "someone thinks SMH chops around in a well-defined range and is getting paid handsomely to bet on that."
📈 Technical Setup / Chart Check-Up
YTD Performance Chart
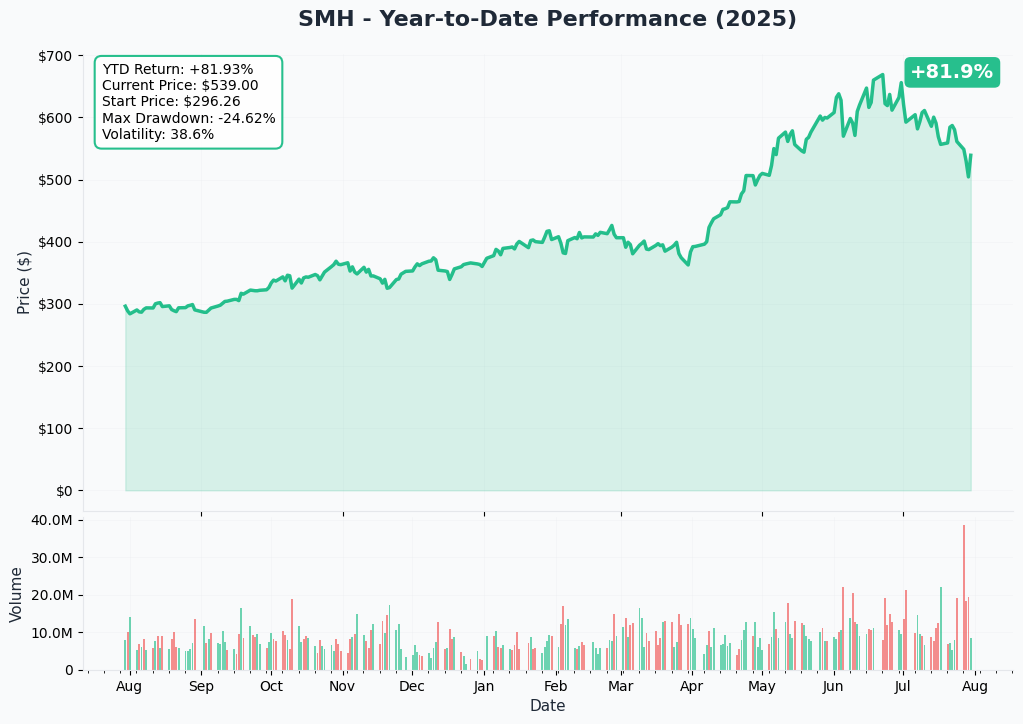
SMH has had a wild 2026 — a record Q2 run took it to an all-time high near $672, followed by a savage >20% drawdown that dragged it down to the ≈$538-540 zone it's trading in now. The July selloff was driven by AI-capex-return skepticism, profit-taking after historic crowding (82% of fund managers called semis the most crowded trade ever), SK Hynix HBM-expansion-slowdown headlines, and a hawkish Fed. That combination of a sharp drop + still-elevated implied volatility is exactly the backdrop that makes premium-selling attractive — which is what today's flow is doing.
Gamma-Based Support & Resistance Analysis
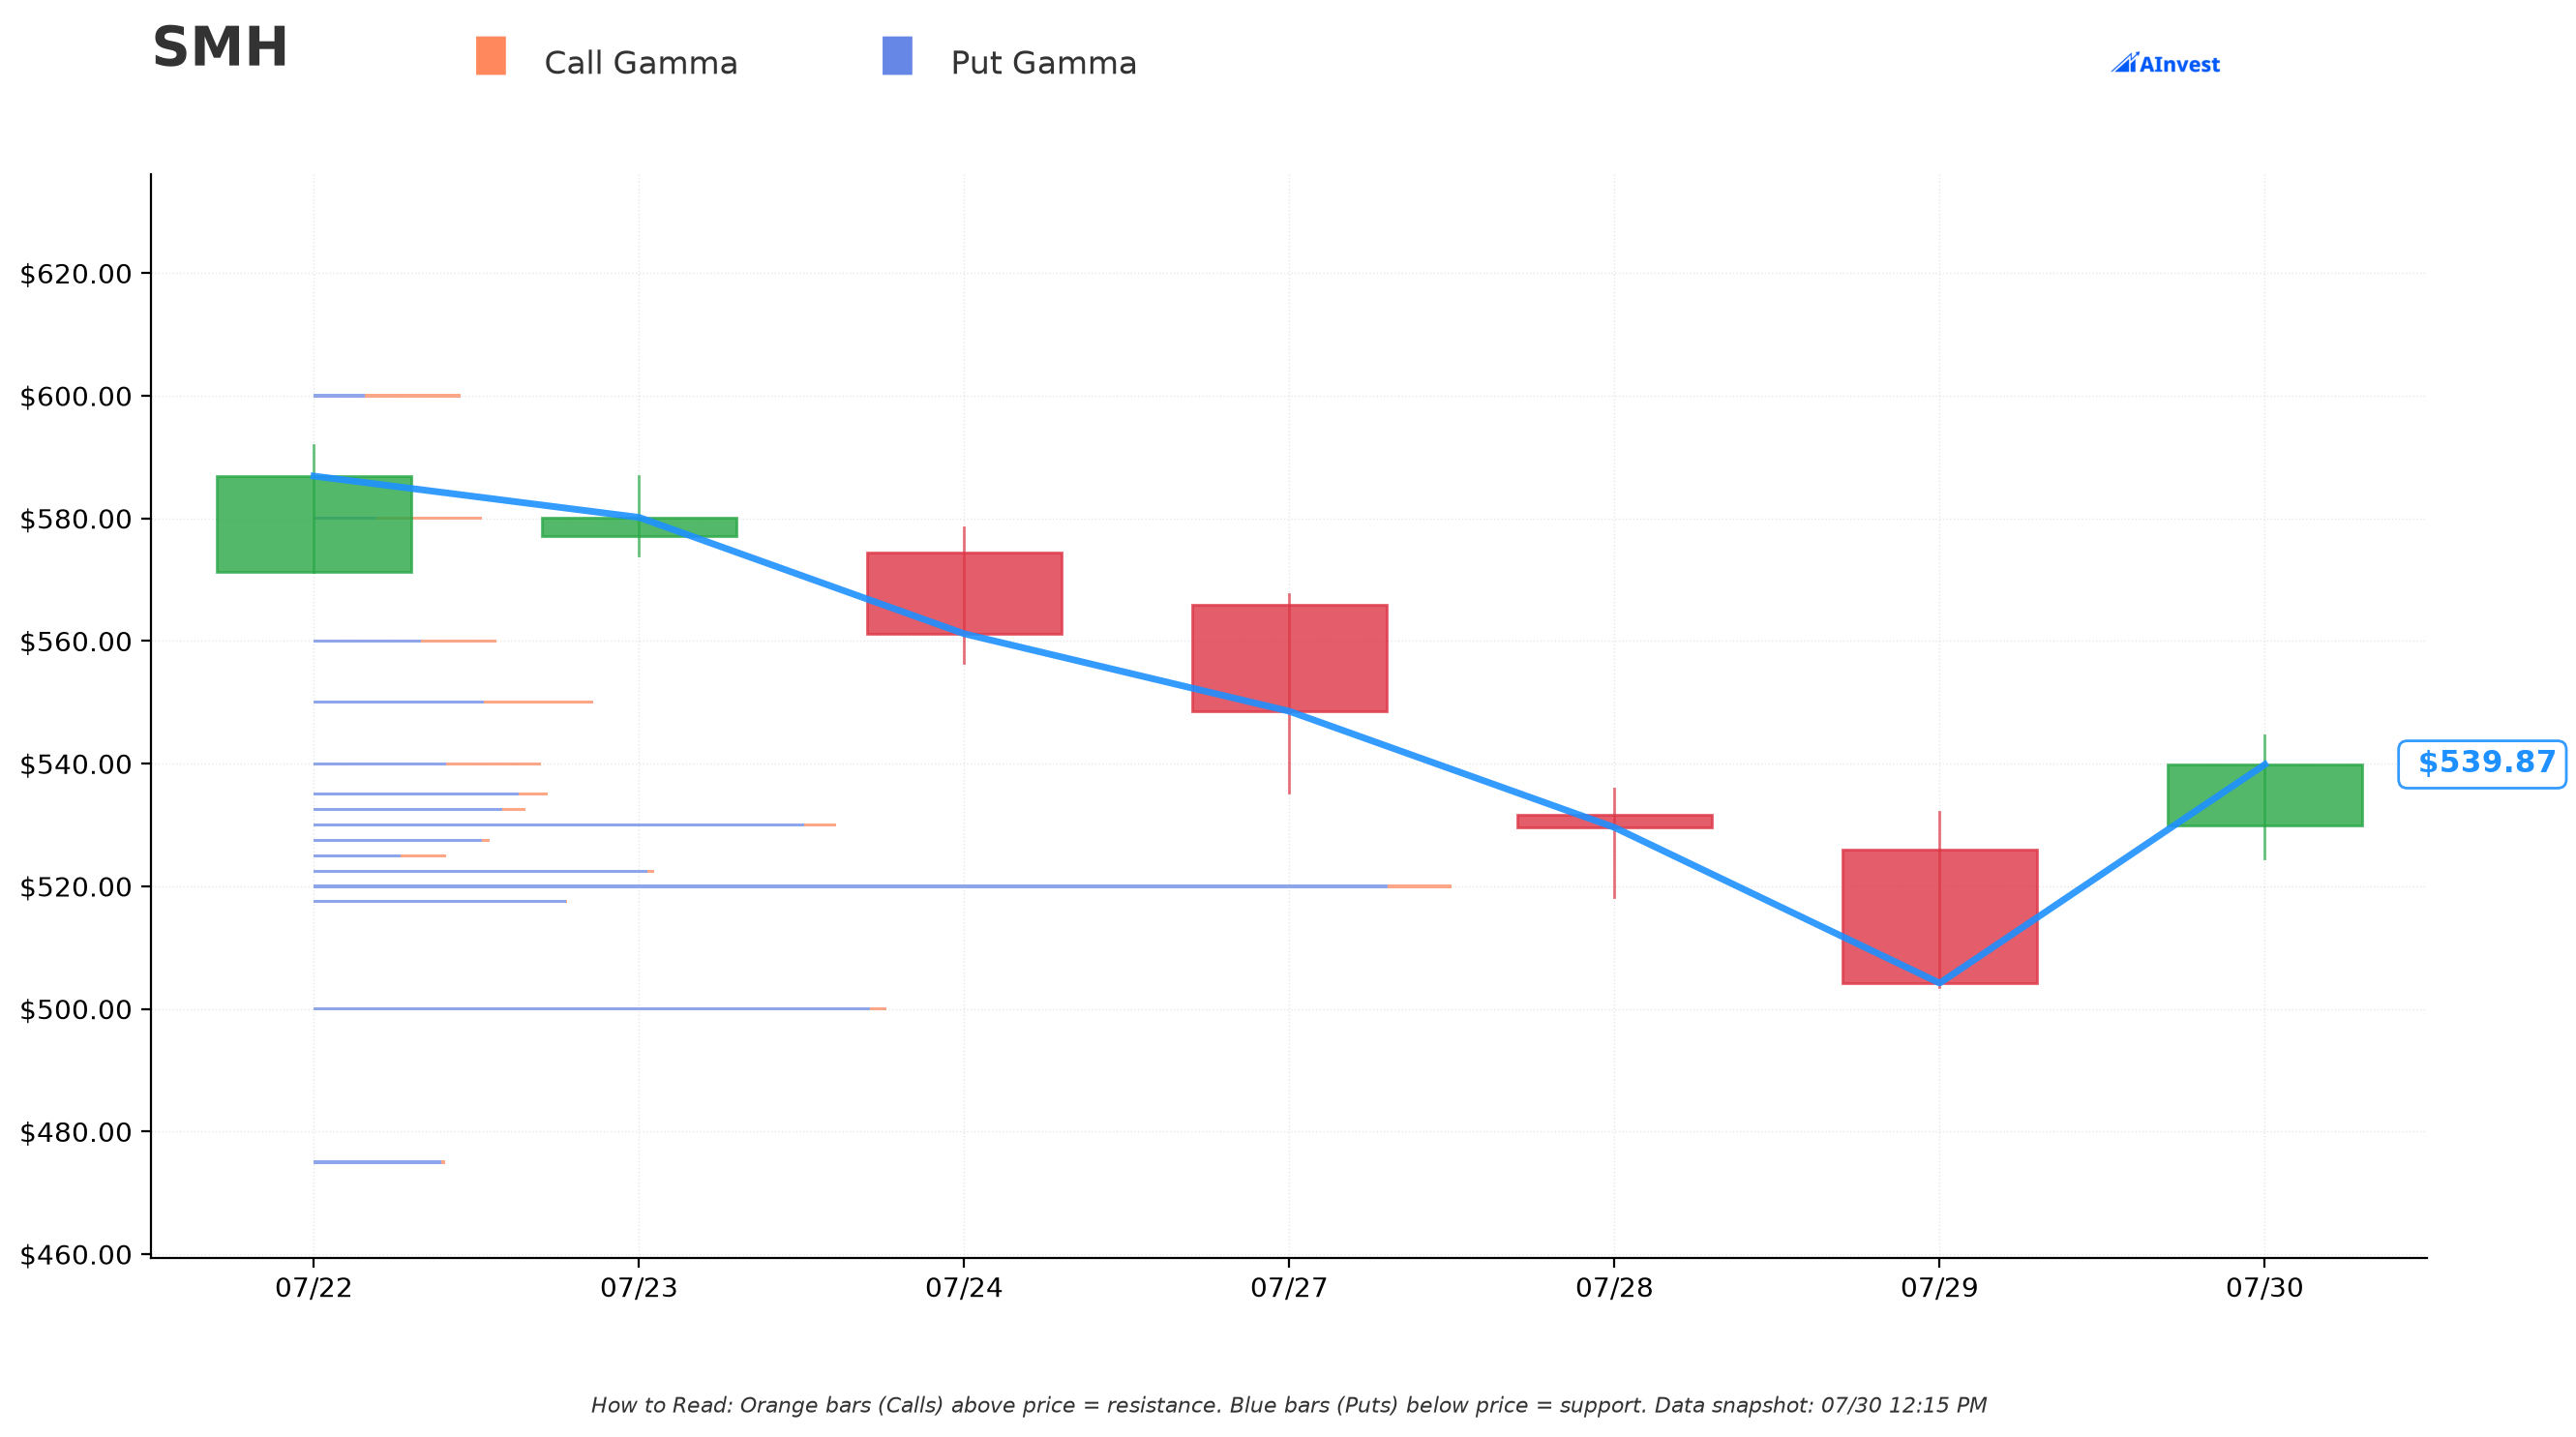
Current Price: ≈$540
🔵 Support Levels (Put Gamma Below Price):
- $540 — essentially at-the-money, "Very Strong" (14.6B total gamma)
- $530 — "Very Strong" support (33.7B gamma, ≈1.8% below spot)
- $520 — "Very Strong" support (74.0B gamma — the single biggest gamma wall on the chain, ≈3.7% below spot)
- $500 — "Very Strong" support (37.0B gamma, ≈7.4% below spot) — exactly where the sold LEAP put is struck
🟠 Resistance Levels (Call Gamma Above Price):
- $540 — "Very Strong" (right at spot)
- $550 — "Very Strong" resistance (18.0B gamma, ≈1.9% above spot) — exactly where the sold near-term call is struck
- $560 — "Very Strong" resistance (11.7B gamma, ≈3.7% above spot)
What this means for traders: Dealers have some of the heaviest gamma positioning on the whole SMH chain clustered right around this trade's two strikes. The $500 floor and $550 ceiling aren't random numbers this seller picked — they're levels the options market itself already treats as strong pivots. That reinforces the "range trade" read: this program is harvesting premium at strikes where price is statistically likely to stall anyway.
Implied Move Analysis
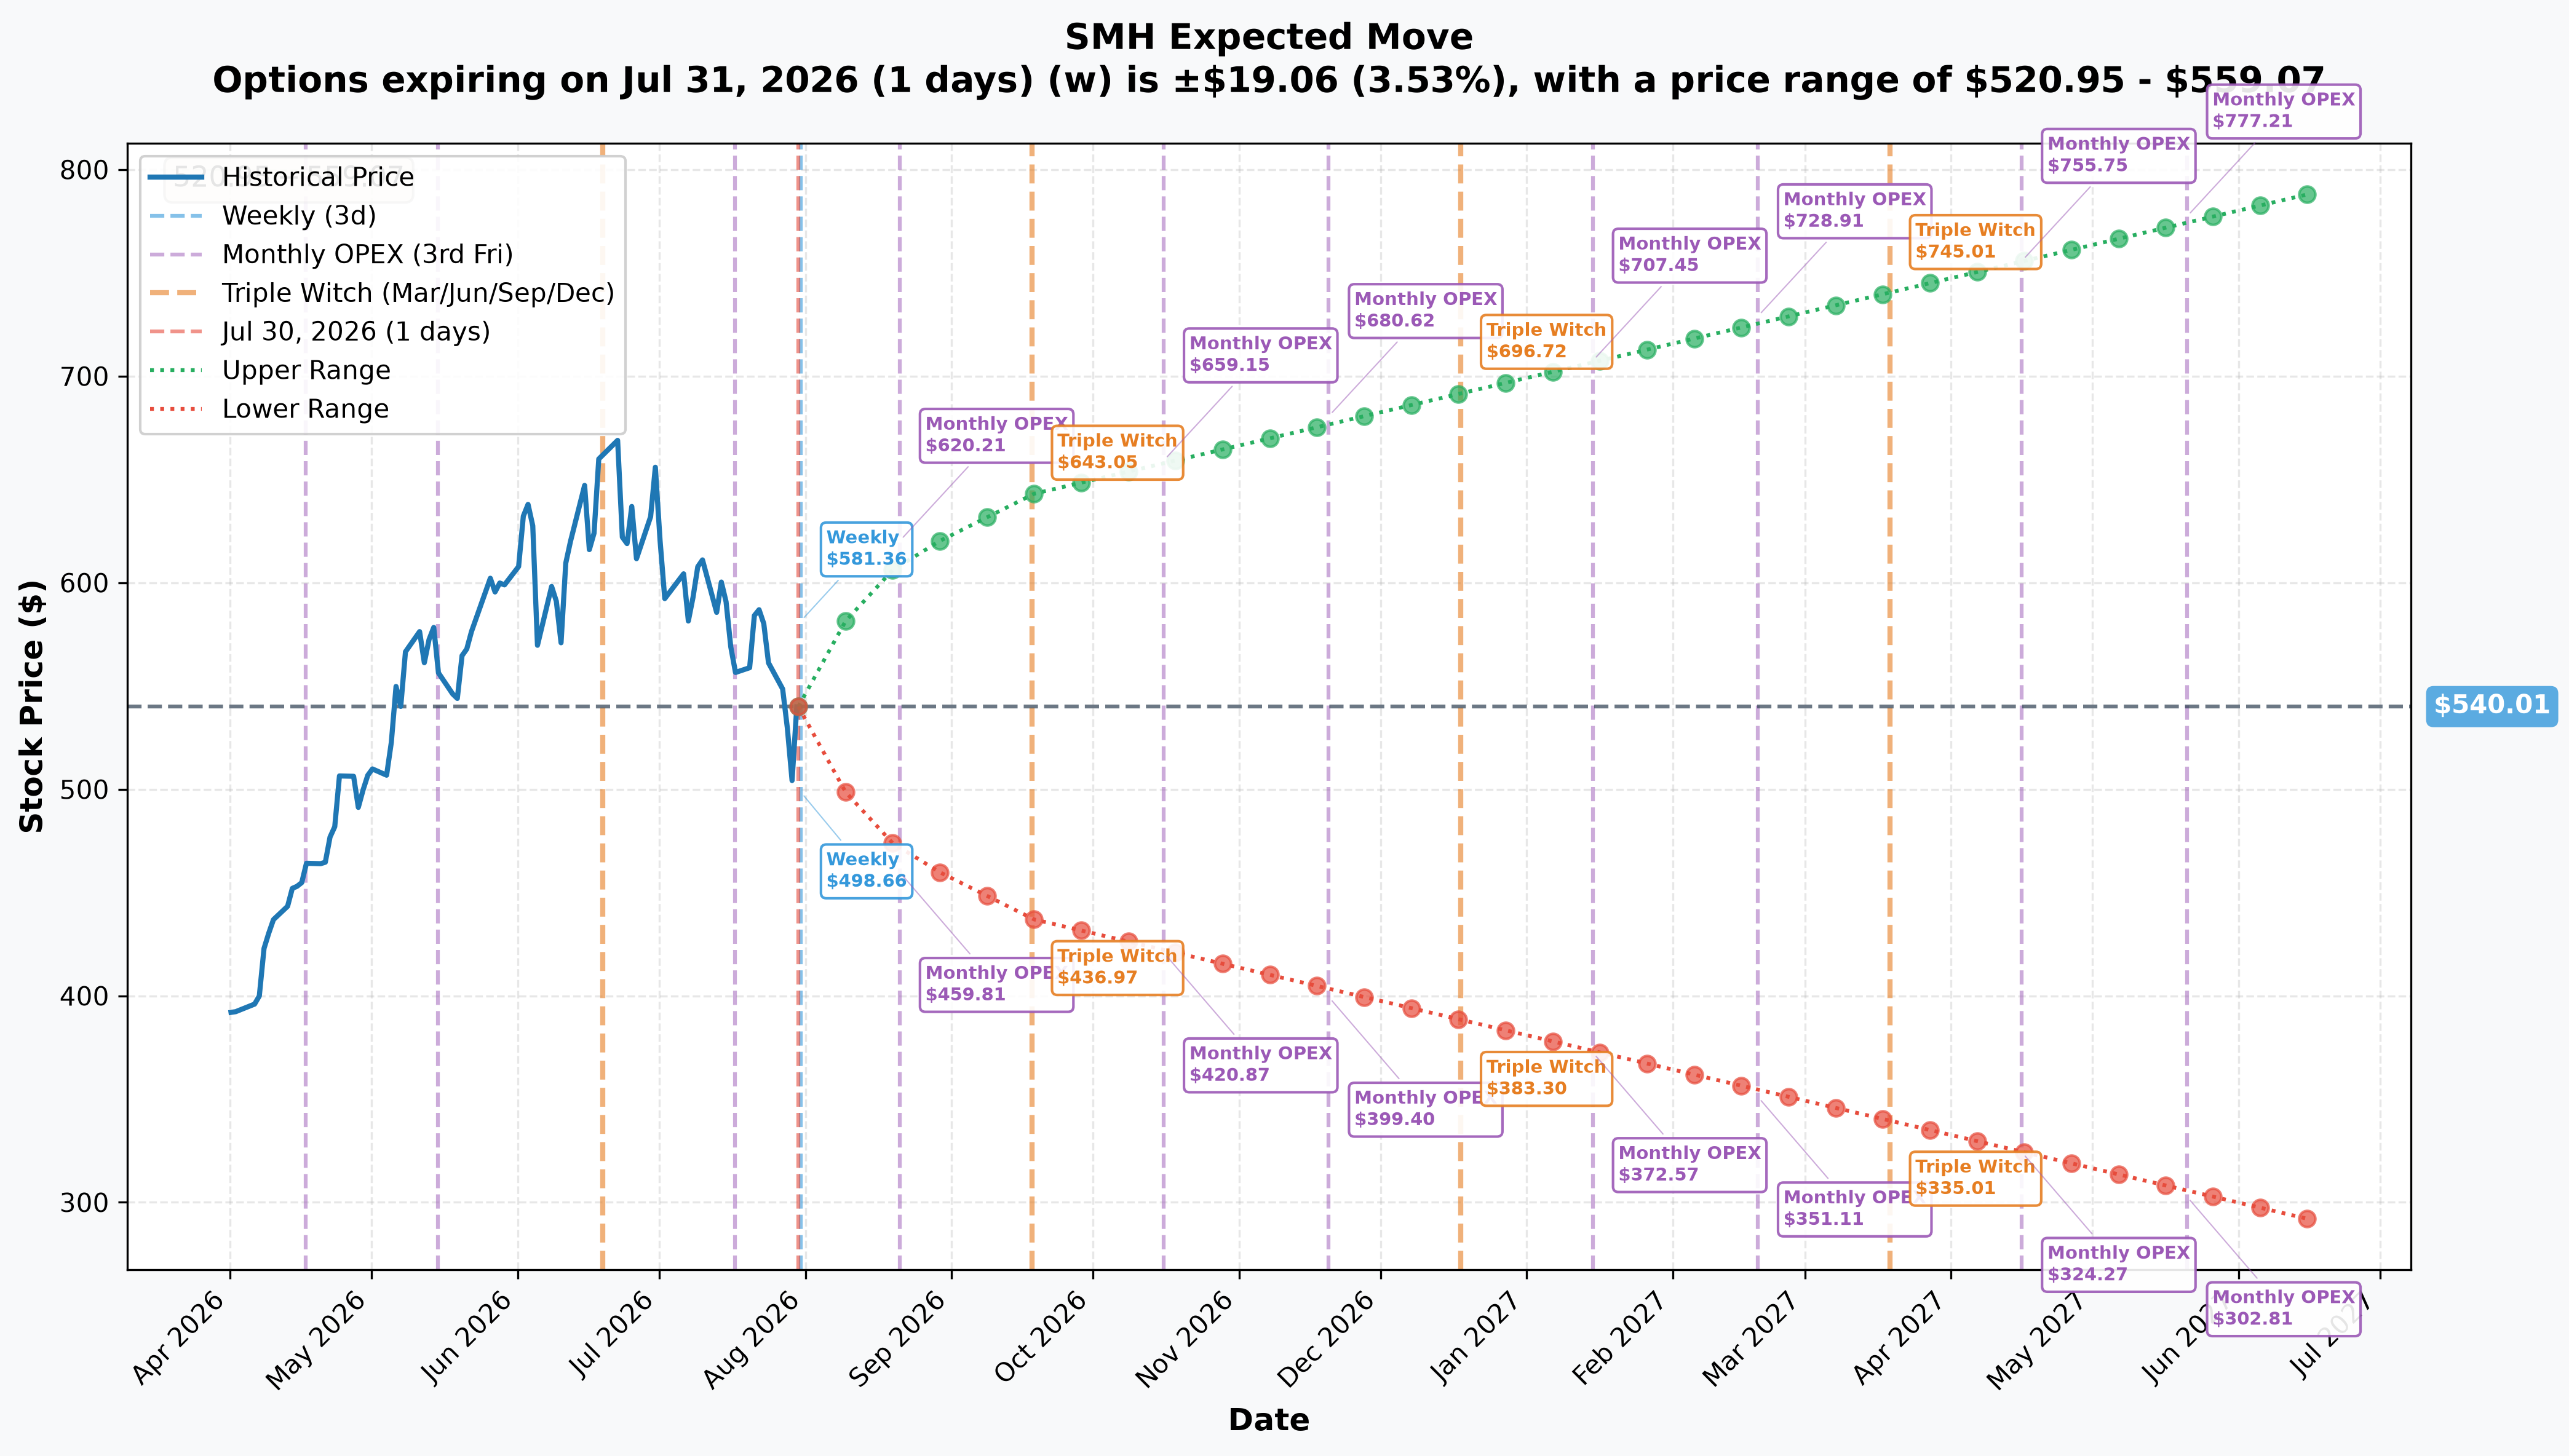
Options are still pricing real uncertainty even after the drawdown:
- 📅 Weekly (Jul 31 — 1 day): ±3.53% (±$19.06) → Range: $520.95 - $559.07
- 📅 Monthly OPEX (Aug 21 — 22 days, THIS TRADE'S CALL EXPIRY): ±13.16% (±$71.07) → Range: $468.94 - $611.08
- 📅 Quarterly Triple Witch (Sep 18 — 50 days): ±19.08% (±$103.04) → Range: $436.97 - $643.05
- 📅 LEAP horizon (Jun 2027 — 322 days, close to THIS TRADE'S PUT EXPIRY): ±46.11% (±$249.01) → Range: $291.00 - $789.02
Translation: the market is pricing a monthly implied range wide enough ($469-$611) that SMH breaking above $550 or below $469 by the Aug 21 call expiration is a real possibility, not a tail event. That's exactly why the seller is getting paid ≈$17.6M for the near-term calls — the market is charging a fair amount for that risk. Over the 18-month put horizon, the implied range is enormous (down to $291 on the low end), which is why the $500 LEAP put still commands ≈$89 in premium even though it's ≈7% out of the money today.
🎪 Catalysts
🔥 Upcoming (the swing factors for this trade's window)
AMD — Q2 FY2026 earnings, August 4, 2026 (after close). Consensus EPS ≈$1.35. Watch Instinct MI350 ramp commentary and early MI400 color — AMD is ≈6% of SMH. Details via startuphub.ai's earnings-date coverage and CMElite Group's AI-chip read-through preview.
Nvidia — FQ2 FY2027 earnings, August 26, 2026 (after close). The single biggest catalyst for SMH given its ≈21% weight. Company guided ≈$91B revenue with consensus EPS ≈$2.01 (+103% YoY), per Wall Street Horizon's Nvidia earnings calendar and Calendarial's FQ2 preview. Notably, this print lands after the sold Aug-21 calls expire — the covered-call seller structured the near-term cap to avoid sitting through Nvidia's own binary event.
Broadcom — FQ3 FY2026 earnings, early September 2026. The next test of its $16B AI-semi quarterly guide, per Broadcom's own Q2 release.
✅ Already Reported (the bar that's already been cleared)
TSMC (Q2, reported July 16, 2026): Revenue $40.2B (+36% YoY), record quarter, HPC/AI now 66% of wafer revenue, raised FY2026 capex to $60-64B, per Investing.com's earnings coverage.
ASML (Q2, reported July 2026): Beat guidance on both revenue and margin, raised FY2026 outlook to €43-45B, per Investing.com's ASML earnings-call transcript.
Broadcom (FQ2, reported early June 2026): Record $22.2B revenue (+48% YoY), AI semi revenue $10.8B (+143% YoY), but the stock pulled back because management didn't raise the FY26 AI number, per CNBC's earnings recap.
⚠️ Other Risk Factors to Watch
- Hyperscaler capex: Amazon, Microsoft, Google, and Meta are guided to ≈$725B combined 2026 capex — up ≈77% YoY, per Tom's Hardware's capex breakdown. A single capex-guide trim is the fastest downside trigger for the whole complex.
- HBM memory supercycle: HBM is reportedly "sold out" for 2026 across SK Hynix, Samsung, and Micron, per SK Hynix's 2026 market outlook — but reports of an SK Hynix HBM-expansion slowdown were a July selloff trigger, per Kavout's analysis of what triggered the semi sell-off.
- China export policy: the H200 rule allows shipments capped at 50% of U.S. volume with a 25% tariff, per Congress.gov's CRS report — a live, bidirectional wildcard over the life of both option legs.
🎲 What The Levels + Catalysts Say About Price Targets
Since this is a range trade, not a directional bet, the "targets" that matter most are the strikes themselves and the gamma walls that back them up:
- 📈 Upside boundary — $550: Matches both the sold call strike AND a "Very Strong" gamma resistance wall. A push through $550 before Aug 21 would cap the seller's covered-call upside (they keep the ≈$17.6M but stop participating in further gains) — likely around a strong Nvidia-adjacent tailwind pre-earnings, or an AMD beat on Aug 4 rekindling the AI rally.
- ⚖️ Base case — $500-$550 chop: With the SOX already down >20% and both major catalysts (AMD Aug 4, NVDA Aug 26) still ahead, a consolidation range is the most statistically likely path — which is exactly the bet this flow is making.
- 📉 Downside boundary — $500: Matches both the sold LEAP put strike AND one of the strongest gamma support walls on the chain. A break below $500 would put the put seller in a position to be assigned SMH shares near a level ≈25% below the June all-time high — which the trade's structure suggests they'd be fine owning.
💡 Trading Ideas
🛡️ Conservative: Watch and Wait for Earnings Clarity
With AMD reporting August 4 and Nvidia August 26 — both inside or just after this program's windows — the safest move for most retail traders is to let those prints happen before adding new SMH options exposure. Implied vol (13.2% monthly, ±$71) is still elevated enough that fresh premium is expensive on both sides.
⚖️ Balanced: Sell Your Own Covered Call If You Already Own SMH
If you're already holding SMH shares, selling an Aug-21 $550 call (roughly mirroring this trade, just retail-sized) collects income while you wait out the AMD/NVDA earnings gauntlet. Why this works: you get paid today, you keep all the upside up to $550 (≈1.9% above current levels), and you only give up gains beyond that — which the gamma wall at $550 suggests is a real ceiling anyway.
🚀 Aggressive: Fade the Range With a Defined-Risk Iron Condor
Traders comfortable with multi-leg risk could construct a defined-risk iron condor around the same $500/$550 box (e.g., short $500 put / long $480 put, short $550 call / long $570 call) for the August or September expiration — betting SMH stays inside the range this institutional flow is also betting on, with capped risk on both sides instead of the naked/hedged exposure the institutional trader is running.
⚠️ Risk Factors & Honest Limits
What the tape proves: three block-cross legs, each paired with a matching equity block sized almost exactly to the option's delta (≈100% hedge ratio on all three). That's about as close to hard proof of "delta-hedged" as OPRA data gets.
What the tape CANNOT prove:
- Who the trader is or their broader book. We don't know if this is a single desk running one program or if the stock hedges came from different books entirely. OPRA never reveals broker, MMID, or customer identity.
- Whether this position gets adjusted/rolled before expiration. Delta-hedged short-vol programs are often actively managed — the trader could re-hedge, roll strikes, or unwind well before Aug 21 or Jan 2028.
- The trader's cost basis on the underlying stock. We can see the hedge shares traded today, but not whether this is a brand-new position or an addition to an existing book.
- ✅ Open vs. close is RESOLVED — both legs confirmed opening (STO). The July 31 OPRA snapshot showed OI rising 1,867 → 10,006 on the calls and 185 → 3,139 on the puts. That risk is retired. The live caveat is the corrected call size (8,000, not 10,000) and the fact that the equity hedge blocks were sized against the pre-correction quantity — see the ✅ RESOLVED box above.
For retail traders: Do not treat this ≈$44M print as either a bullish or bearish signal. Range-bound premium-harvest strategies like this one profit when a stock does nothing dramatic — the exact opposite of the signal a directional whale trade would send. If you're chasing catalysts, the actual driver here is AMD's Aug 4 print and Nvidia's Aug 26 print, not this options flow.
🎯 The Bottom Line
Real talk: ≈$44M in options premium sounds like a screaming headline, but the tape tells a much calmer story — this is a delta-hedged, income-oriented program betting SMH grinds sideways between $500 and $550 through the next earnings cycle, not a whale calling a top or a bottom.
What this trade tells us:
- 🎯 The trader is monetizing SMH's still-elevated implied volatility after the July >20% drawdown, not making a directional call
- 💰 Both strikes ($500 and $550) land almost exactly on the biggest gamma walls on the chain — this wasn't a random pick
- ⏰ The near-term call cap (Aug 21) expires just before Nvidia's Aug 26 report — the seller structured around that binary event, not into it
- 📊 The long-dated put floor (Jan 2028) is a multi-year bet that the AI/semi secular story holds SMH above $500
If you own SMH: Consider mirroring the covered-call leg (sell calls near $550 for income) if you're comfortable capping upside through August. Don't read this flow as a reason to sell your shares — it's not a bearish signal.
If you're watching from the sidelines: The real catalysts to watch are AMD on August 4 and Nvidia on August 26 — those prints will decide whether SMH stays inside this $500-$550 box or breaks out of it. This options flow is a bet on containment, not a forecast.
If you're bearish: This flow gives you no edge either way — it's neutral by design. Wait for a decisive break below the $520/$500 gamma support cluster before acting on a bearish thesis.
Mark your calendar:
- 📅 August 4 — AMD Q2 FY2026 earnings (after close)
- 📅 August 21 — Monthly OPEX, expiration of the sold $550 calls
- 📅 August 26 — Nvidia FQ2 FY2027 earnings (after close)
- 📅 Early September — Broadcom FQ3 FY2026 earnings
- 📅 January 21, 2028 — Expiration of the sold $500 LEAP puts
✅ Update: the next-day OPRA open-interest confirmation is in (July 31 pre-market) — both legs are confirmed OPENING short positions, and the check also caught a cancelled call clip that shrank the trade from 10,000 contracts to 8,000 and the program from $49M to ≈$44M.
Last updated: 2026-07-31 — next-day OPRA open-interest confirmed both legs as OPENING (calls 1,867 → 10,006, +8,139; puts 185 → 3,139, +2,954). The call-leg size and all premium figures were corrected downward after an exchange cancellation was found on the tape: 8,000 contracts / ≈$17.6M (was 10,000 / $22M), program total ≈$44M (was $49M).
Disclaimer: Options trading involves substantial risk of loss and is not suitable for all investors. This analysis is for educational purposes only and not financial advice. The delta-hedge verification described here is based on paired stock and options blocks observed on the tape at the time of the trade; it does not reveal the trader's full portfolio, cost basis, or future intentions. Always do your own research and consider consulting a licensed financial advisor before trading.
About SMH (VanEck Semiconductor ETF): SMH tracks the MVIS US Listed Semiconductor 25 Index, holding the largest and most liquid U.S.-listed semiconductor companies, with ≈$69 billion in assets under management and top holdings including Nvidia, Taiwan Semiconductor, Broadcom, AMD, and Micron.