🛡️ SMH $70.6M Defensive Posture: Someone Bought $51.7M of ITM Downside AND Sold Away 2028 Upside on the Chip ETF
📅 July 31, 2026 | 🔥 Unusual Activity Detected — Two Separate Trades
✅ UPDATE — August 3, 2026 pre-market: the OI check is in and both legs confirmed at full size. The Jun-2027 $625 put went 49 → 3,949 (+3,900, exactly the print) and the Jun-2028 $730 call 3 → 2,004 (+2,001). 100% new risk on both. See the ✅ RESOLVED box.
🎯 The Quick Take
Two block crosses printed on the VanEck Semiconductor ETF (SMH) today, three hours and seven minutes apart, and they point the same defensive direction. At 10:38 AM someone sold 2,000 June-2028 $730 calls for $18.96M, giving up upside on a virtually untouched strike. At 1:46 PM someone else (or the same desk — the tape can't tell us) bought 3,900 June-2027 $625 puts for $51.7M, an already in-the-money position. Both were delta-hedged with stock blocks at the print, both are proven fresh opens, and both lean the same way: reducing exposure to semiconductors just as the sector sits in a sharp, well-documented drawdown. Translation: real money is paying real premium to protect against — or press — more chip-sector pain, on a multi-year runway.
📊 Fund Overview
VanEck Semiconductor ETF (SMH) tracks the performance of the MVIS US Listed Semiconductor 25 Index, a basket of the 25 largest U.S.-listed companies in chip design, manufacturing, and equipment. Unlike a broad tech fund, SMH is a pure-play bet on the semiconductor supply chain — and a concentrated one.
Key facts (per StockAnalysis and VanEck's fund page):
- Net assets: ≈$69.78 billion
- Expense ratio: 0.35%
- Total holdings: 26 positions
- Top 10 holdings ≈70.9% of the fund:
| Holding | Weight |
|---|---|
| NVIDIA (NVDA) | 20.78% |
| Taiwan Semiconductor (TSM) | 9.18% |
| Broadcom (AVGO) | 6.19% |
| Advanced Micro Devices (AMD) | 6.00% |
| Micron Technology (MU) | 5.28% |
| ASML Holding (ASML) | 5.10% |
| Applied Materials (AMAT) | 4.93% |
| Texas Instruments (TXN) | 4.61% |
| KLA Corporation (KLAC) | 4.44% |
| Lam Research (LRCX) | 4.38% |
Concentration risk is real: NVIDIA alone is over a fifth of the fund, and the top three names (NVDA, TSM, AVGO) are more than a third of it. When NVIDIA, Micron, or TSMC move, SMH moves — this is not a diversified technology fund, it's a leveraged read on a handful of chip giants.
💰 The Trades — Two Separate Bets, Same Direction
⚠️ These are NOT one combined structure. They printed 3 hours 7 minutes apart, on different expirations, as two separate single-leg 🤝 BLOCK CROSS trades (negotiated, off-book — a broker matched a known buyer and seller for each). No aggression, no lit sweep, no urgency verbs apply here.
| Time | Symbol | Buy/Sell | Call/Put | Expiration | Premium | Strike | Volume | Prior OI | Size | Spot | Option Price | Option Symbol |
|---|---|---|---|---|---|---|---|---|---|---|---|---|
| 10:38:28 | SMH | SELL | CALL | 2028-06-16 | $18.96M (credit) | $730 | 2,002 | 3 | 2,000 | $546.46 | $94.80 | SMH20280616C730 |
| 13:45:50 | SMH | BUY | PUT | 2027-06-17 | $51.68M (debit) | $625 | 3,900 | 49 | 3,900 | $546.50 | $132.50 | SMH20270617P625 |
The paired stock hedges (both PROVEN pairings on the tape):
- 🤝 Trade 1 hedge: a 106,000-share block printed at $547 at 10:39:40 — 72 seconds after the call sale. Delta match is close (option delta −96,560 shares). INFERRED link — not same-second, but a reasonable match.
- 🤝 Trade 2 hedge: a 195,000-share block printed at $544 at 13:45:51.308 — just 1.5 seconds after the put buy. This is a near-exact delta match (option delta −197,652 shares) and about as strong a pairing as the tape ever produces. Call it "immediately after," not same-second.
Combined option delta across both trades: −294,212 shares of SMH-equivalent exposure — before accounting for the stock hedges that neutralized each trade at the dealer level.
✅ RESOLVED — Both Legs Confirmed Open, Full Size
Both legs printed on strikes that were essentially empty beforehand, so the next-day open interest check was expected to be a formality — but it is still the definitive test. The August 3 pre-market OPRA snapshot delivered exactly what we predicted: open interest on both strikes rose by the full trade size.
| Leg | Baseline OI (Jul 31 snap) | Resolving OI (Aug 3 snap) | Δ | Print size | Δ as % of print | Verdict |
|---|---|---|---|---|---|---|
| Jun-17-2027 $625 Put (bought) | 49 | 3,949 | +3,900 | 3,900 | 100.0% | ✅ OPEN (BTO) |
| Jun-16-2028 $730 Call (sold) | 3 | 2,004 | +2,001 | 2,000 | ≈100.1% | ✅ OPEN (STO) |
The $625 put matched to the single contract; the $730 call overshot by one. Neither strike had any meaningful prior position to close against, and neither shows a transfer component — this is 100% new risk on both legs.
The more interesting question isn't whether these opened — it's whether they get held. A fresh strike like this getting unwound within a day or two would tell a very different story (churn, a failed hedge, a changed mind) than one that sits and builds. We'll keep watching both strikes in the sessions ahead.
🤓 What This Actually Means — Plain English
Let's break down each leg separately, then put them together.
Trade 1 — selling the $730 call, expiring June 2028 (order type: STO, Short Long-Dated Call): This collected $18.96M in premium. The seller is giving up any upside above $730 (≈34% above today's $546 spot) for the next ≈23 months, in exchange for cash today. On its own, selling a call you don't need to own is a bearish-to-neutral trade — but paired with a stock hedge, it functioned as a way to monetize a view that SMH probably isn't ripping 34% higher anytime soon, without touching the underlying position.
Trade 2 — buying the $625 put, expiring June 2027 (order type: BTO, Long ITM Put): This is the bigger trade at $51.68M. The put strike ($625) is already above today's spot ($546.50) — meaning it's in the money by $78.50 right now. Of the $132.50 paid per contract, $78.50 is intrinsic value and ≈$54 is pure time value. Paying that much time value for a hedge is not cheap — it tells you the buyer wanted real, long-dated protection and was willing to pay up for nearly two years of runway rather than buy a cheaper, shorter-dated, further-out-of-the-money put.
Now, the important part — who actually carries the risk. Both trades were delta-hedged with stock blocks essentially at the moment they printed. That means the dealer/market maker on the other side of each trade walked away flat — they bought or sold stock to cancel out the option's delta immediately. The customer is the one left holding the directional exposure: short upside above $730 through 2028, and long downside protection below $625 through 2027.
What we cannot tell you — and this matters — is why. There are two honest readings, and the tape proves the position, not the motive:
- Hedge over an existing book. A fund that owns a large basket of semiconductor stocks (or SMH shares themselves) could be using both trades to cheapen and extend downside protection while collecting income against the upside they're willing to cap. This is a classic "collar-style" risk-reduction posture, even though the two trades weren't executed as a single structure.
- An outright bearish view. The same combination — buy puts, sell calls — is also exactly what you'd do if you simply expect semiconductors to underperform and want to express that view with defined, delta-hedged option exposure rather than shorting stock directly.
We genuinely don't know which it is. The tape shows us the position and the hedge; it cannot show us what else is sitting in this trader's portfolio.
One more honest caveat: these are two separate crosses, 3+ hours apart. We're treating them as thematically linked because they point the same direction and both target SMH, but we cannot prove it's the same account, desk, or even the same overall strategy. Two institutions independently deciding to lean defensive on chips on the same day is also a perfectly reasonable explanation — and arguably the more interesting one, since it would mean the caution is broader than one trader.
A note on replicability: selling a naked 2028 call the way Trade 1 did is not something most retail accounts can or should do — it requires either owning the underlying (a true covered call) or substantial margin and risk tolerance for unlimited theoretical loss if SMH rallies hard. If you like this trade's logic, the retail-friendly version is buying protective puts (Trade 2's idea) rather than selling naked calls.
Continuity worth flagging: SMH also carried the single largest ticket on yesterday's session (2026-07-30) — a delta-hedged short-volatility program, later corrected to ≈$44M after an exchange cancellation. Today's flow is a genuinely different posture: buying downside protection instead of selling volatility. We can't say it's the same desk rotating its view, but the shift itself — from selling vol to buying puts — is notable in a 24-hour window.
📈 Technical Setup / Chart Check-Up
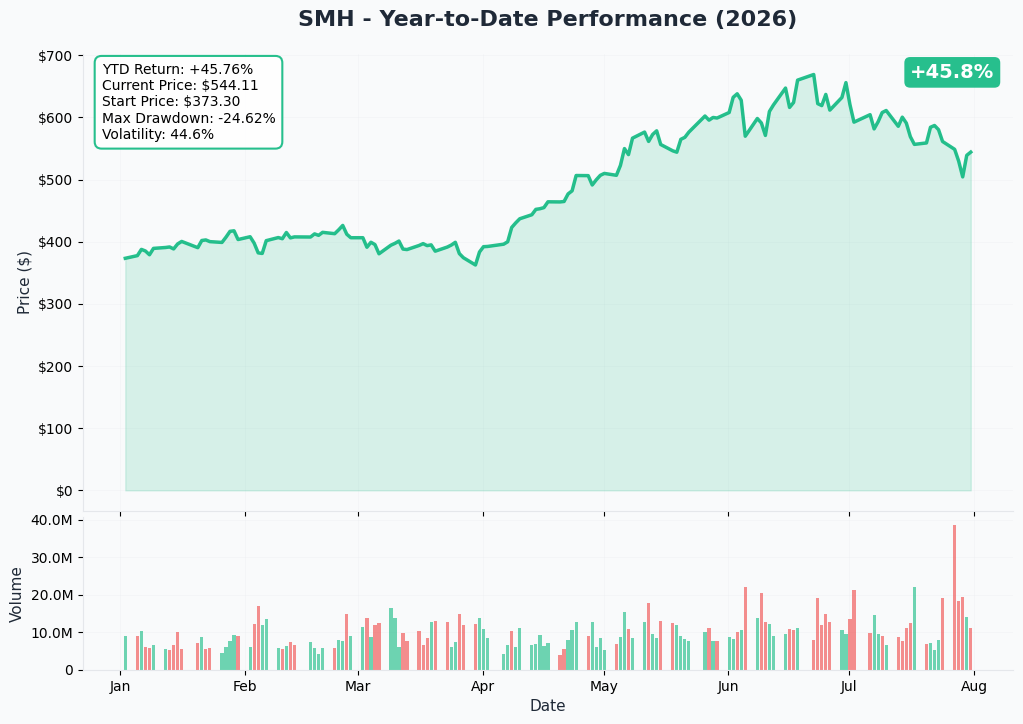
YTD Chart
Gamma-Based Support & Resistance
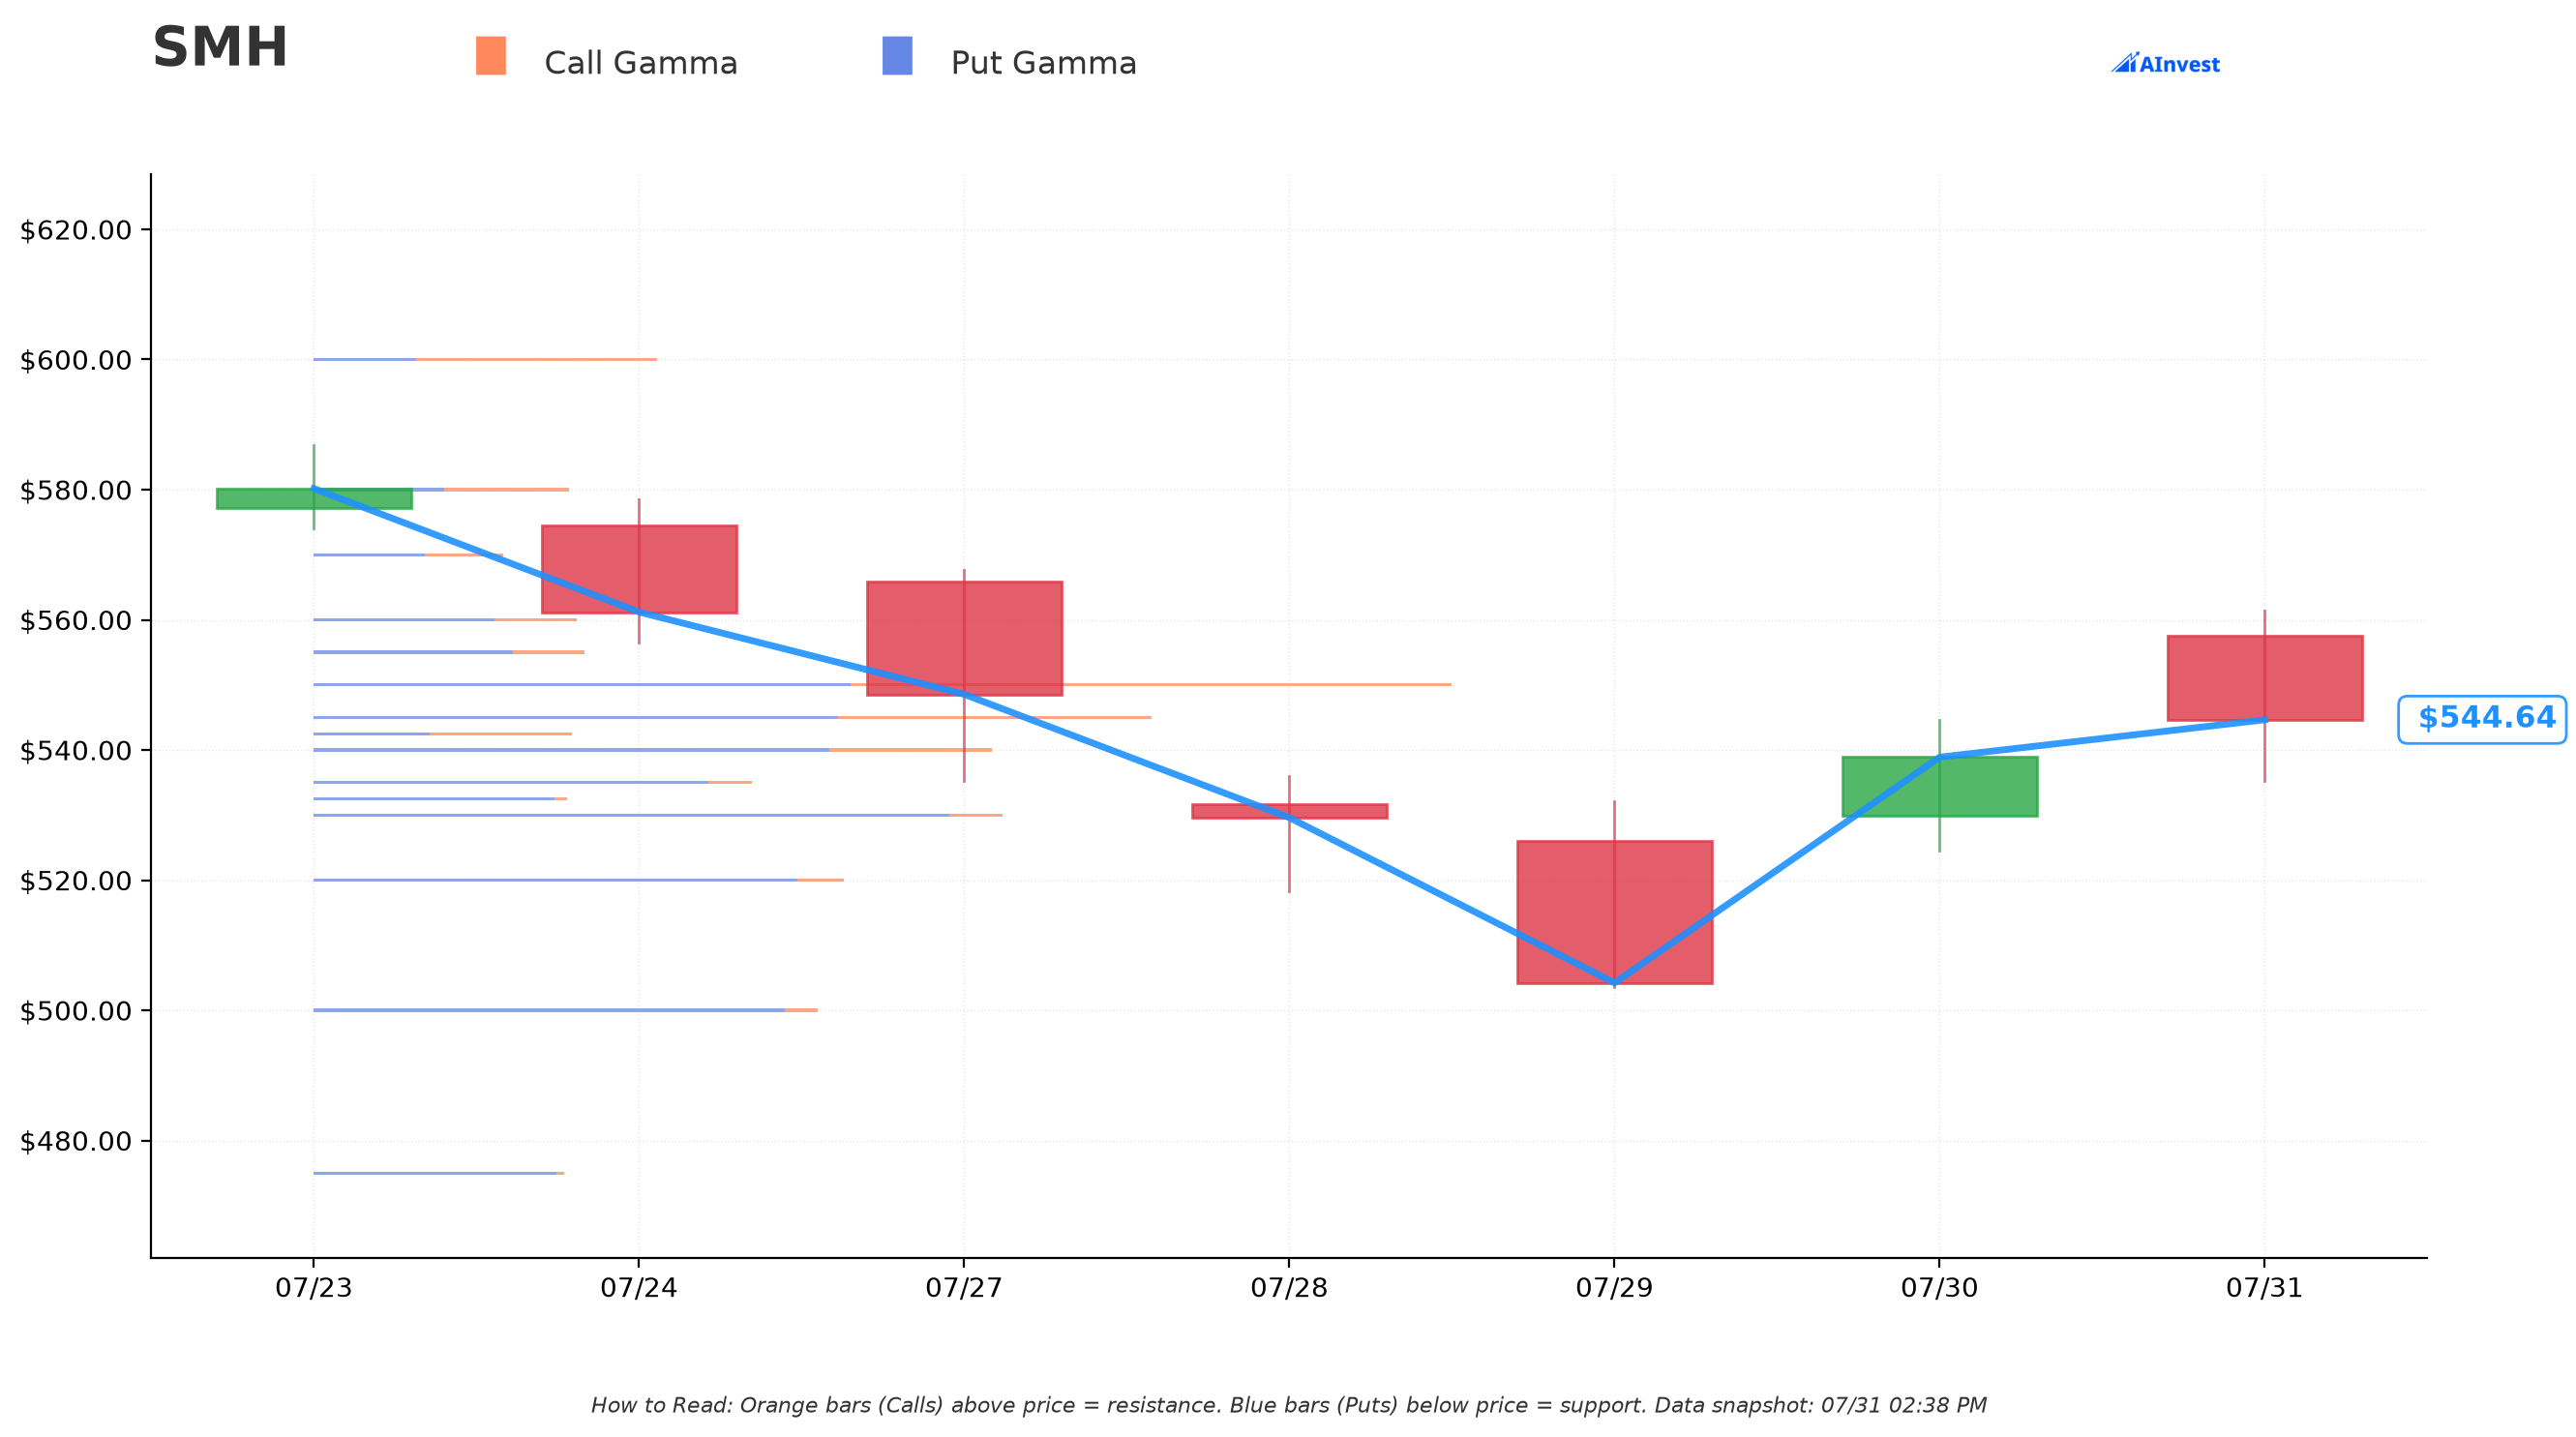
With SMH at $544.84, the options market shows dealer positioning clustering tightly around current price:
🟠 Resistance (Call Gamma Above Price):
- $545 — Very Strong resistance, essentially at-the-money (0.03% away)
- $550 — Very Strong resistance, ≈0.95% above spot
- $555 — Strong resistance, ≈1.87% above spot
🔵 Support (Put Gamma Below Price):
- $540 — Very Strong support, ≈0.89% below spot
- $530 — Very Strong support, ≈2.72% below spot
- $520 — Very Strong support, ≈4.56% below spot
What this means for traders: SMH is pinned in a tight $540–$550 gamma pocket right now, which is typical of a market maker-dominated range where dealers buy dips and sell rips to stay hedged. The 730 call strike from today's sale sits nearly 34% above the nearest meaningful gamma resistance — the seller wasn't targeting a near-term technical level, they were selling far, far out-of-the-money for 2028. The 625 put strike is roughly 14.7% above spot (deep ITM), well beyond the visible gamma support levels shown here — a reminder that the put's protection kicks in well before those near-term support zones would even be tested on the way down.
Implied Move Analysis
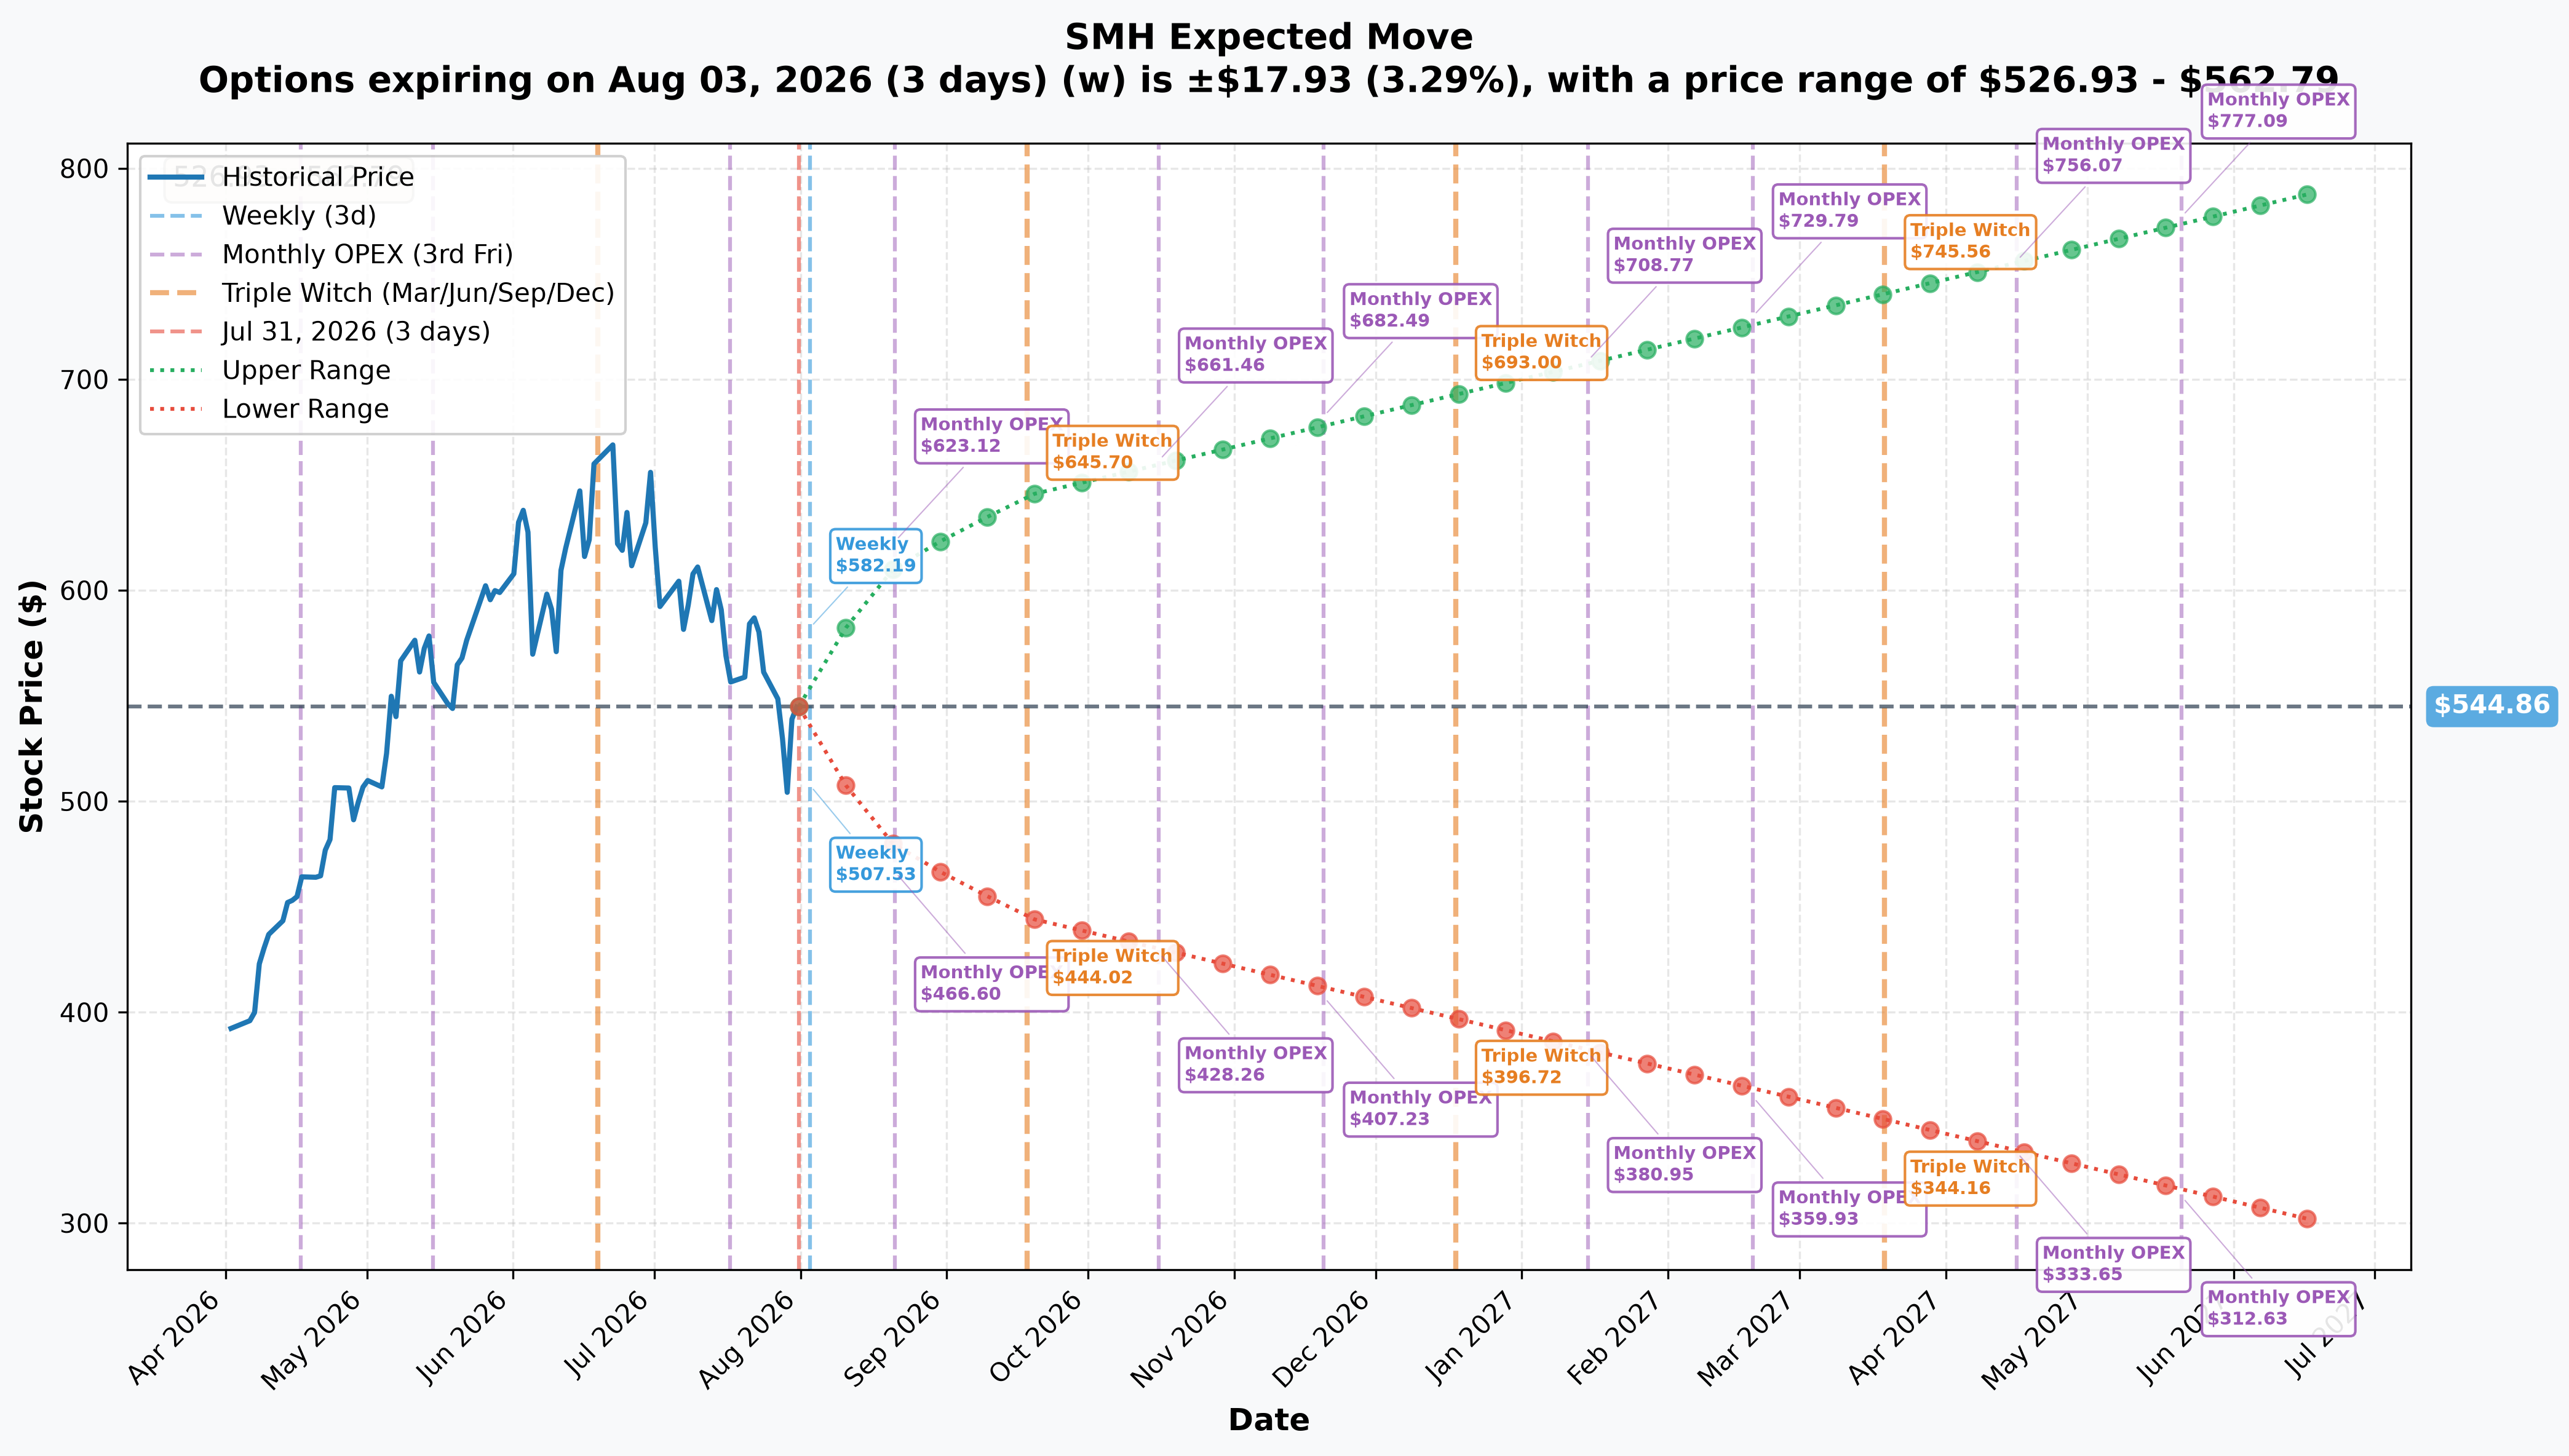
Options pricing across expirations, from the same current price of $544.86:
| Expiration | Days | Implied Move | Range |
|---|---|---|---|
| Weekly (Aug 3) | 3 | ±3.29% (±$17.93) | $526.93 – $562.79 |
| Monthly OPEX (Aug 21) | 21 | ±12.45% (±$67.82) | $477.04 – $612.68 |
| Quarterly Triple Witch (Sep 18) | 49 | ±18.41% (±$100.31) | $444.55 – $645.17 |
| Yearly LEAPS (Jun 17, 2027) | 321 | ±44.65% (±$243.27) | $301.59 – $788.13 |
Translation for regular folks: the options market is pricing a full 44.65% possible swing by the time the $625 put expires in June 2027 — a range from $301.59 to $788.13. The $625 put strike sits inside that range but well above the midpoint, meaning the buyer paid up for protection that's already in-the-money rather than betting on a far-out tail move. The $730 call, expiring even later in June 2028, sits above even the top of this 321-day implied-move cone — underscoring that the call seller was giving up genuinely distant upside, not a level the market currently sees as likely within the LEAPS' visible pricing window.
🎪 Catalysts
🔥 What Already Happened — The Sector Backdrop (Last Week)
This trade did not happen in a vacuum. Semiconductors have been in a sharp, well-documented drawdown:
- By July 29, 2026, the Nasdaq-100 had fallen roughly 10% from its June record over about 40 trading days, entering correction territory, according to IBTimes. Bloomberg framed the same move as the index heading for correction "as AI worries rattle investors."
- The damage was concentrated in chips. The Philadelphia Semiconductor Index (SOX) entered a bear market on 2026-07-17, per Bloomberg. A widely-quoted −24% figure circulated mid-drawdown (IBTimes), but the verified closes are more precise: SOX bottomed at 10,447.5 on 2026-07-29 — ≈29% below its 14,655.3 peak — then rebounded to 11,439.6 by 2026-07-31, ≈22% below the high (Investing.com).
- ⚠️ Important timing nuance, and it cuts against a purely bearish reading of these trades: the sector V-bottomed on July 29–30. SMH closed at $504.22 on July 29 (−4.79%), then jumped +6.88% on July 30 — one of its largest single-day gains ever — and added +1.30% on July 31 to close at $545.91 (stockanalysis). The catalyst was Lam Research's beat-and-raise, which guided September revenue to ≈$8.1B, roughly $1B above consensus. So the $625 put was bought into a two-day bounce, not into a collapse — SMH still sits ≈18.7% below its 52-week high but remains up ≈51% year to date.
- CNBC reported that chip stocks shed more than $1 trillion of market value in the selloff, with CNBC's July 28 coverage documenting AMD, Intel, and Micron extending losses.
- Yahoo Finance reported Micron, Samsung, and SK Hynix all more than 20% below their recent closing highs — a bear market in the memory complex, which directly touches SMH's #5 holding (Micron, 5.28% of the fund).
This is the environment these two trades printed into. Whether the SMH desk was hedging real exposure or pressing the move, they were doing it while the sector was already down double digits and headline writers were calling it a correction.
📅 Upcoming Catalysts — Mapped to Each Expiration
Both trades are long-dated enough that they span multiple full earnings seasons for SMH's underlying holdings — neither is a single-event bet.
- NVIDIA's fiscal Q2 2027 earnings, expected Wednesday, August 26, 2026 (MarketBeat — dated from NVIDIA's historical reporting pattern, not yet company-confirmed) — NVIDIA is SMH's largest holding at nearly 21% of the fund, so this print sits inside both the June 2027 put and the June 2028 call. A weak print here would be the single most direct catalyst for either position, but neither trade is structured around it specifically — both run far past it.
- Numerous quarters of earnings from TSM, Broadcom, AMD, Micron, ASML, Applied Materials, Texas Instruments, KLA, and Lam Research will also fall inside both windows before expiration — the June 2027 put alone will see roughly seven full quarterly reporting cycles from the top-10 holdings, and the June 2028 call nearly nine. Treat these as multi-cycle sector positions, not earnings bets.
👥 Four-Reader Take
🚀 YOLO Trader
You're not going to replicate a $51.7M institutional put buy, but the read-through is useful: if you want to bet on more chip-sector pain, a shorter-dated, further out-of-the-money put spread on SMH captures the same directional idea with defined risk and a fraction of the capital. Skip the naked call-selling idea entirely — that's not a retail structure.
🎢 Swing Trader
Watch the $540–$530 gamma support zone over the coming days/weeks. If SMH breaks below $530 with volume, it would validate the defensive tape you're seeing today. A bounce and hold above $550 would argue the sector selloff is stabilizing and this flow was more hedge than conviction.
💰 Premium Collector
The $730 call sale is a reminder that selling far-dated, far-OTM calls against a real holding (a true covered call, not naked) can generate meaningful income — $94.80 per contract here — if you're willing to cap upside for ≈2 years. Not a trade to copy naked, but worth studying the strike selection logic: 34% out, multi-year dated, sold into elevated fear.
🌱 Beginner
The big lesson here: two trades that look unrelated (a call sale in the morning, a put buy in the afternoon) can tell the same story once you see they both reduce exposure to the same thing. Don't just look at headline premium — look at direction, and whether multiple signals agree.
⚠️ Risk Factors & Honest Limits
- We cannot see the rest of either trader's book. Both trades were delta-hedged at the print, which tells us the customer carries the exposure — it does not tell us whether that exposure offsets a larger existing position or represents a fresh, standalone bet.
- These are two separate trades, 3 hours 7 minutes apart, possibly from different accounts. We're presenting them together because they point the same direction, not because we can prove they're connected. Treat the "$70.6M combined defensive posture" framing as an observation about correlated flow, not a confirmed single strategy.
- The 72-second and 1.5-second stock-block pairings are strong but not certain hedges. They match on size and timing, which is compelling, but OPRA cannot confirm broker identity, account, or explicit intent — these links are INFERRED from the tape, not proven by it.
- Both legs are proven fresh opens (size vs. prior OI), but that only tells us they're new — not whether they'll be held. Watch next-day and multi-day OI for whether these positions build or unwind quickly.
- Concentration risk in SMH itself: with NVIDIA at nearly 21% of the fund and the top 10 holdings at ≈71%, SMH's price action over the life of these options will be dominated by a handful of names, not a broad semiconductor "market."
- Options trading involves substantial risk of loss and is not suitable for all investors. This analysis is educational, not financial advice. The motive behind institutional flow is never fully knowable from the tape alone — always do your own research.
About VanEck Semiconductor ETF: SMH tracks the MVIS US Listed Semiconductor 25 Index, holding ≈$69.78 billion in net assets across 26 positions concentrated in the largest U.S.-listed semiconductor design, manufacturing, and equipment companies, led by NVIDIA at ≈21% of the fund.
Last updated: 2026-08-03 — next-day OPRA open interest confirmed both legs OPEN at full size ($625 put 49 → 3,949; $730 call 3 → 2,004).