🎢 SMH $18.5M Bullish Ladder Financed Almost Entirely by Put Sales — $249M of Delta for ≈$1M Net
📅 2026-08-03 | 🤝 Floor-Negotiated Block | ⚡ Net Debit ≈$1.05M
✅ UPDATE — August 4, 2026 pre-market: all four legs confirmed OPEN — including the marginal $500 put. That leg added 3,383 → 6,519 (+3,136), ≈85% of its print, far above the ≈317 minimum we said would be consistent with the bullish-ladder read. See the ✅ RESOLVED box.
🎯 The Quick Take
At 11:34:48 someone put on a four-legged SMH trade — bought two upside call strikes, sold two downside put strikes, all 3,700 contracts each, all expiring 2026-10-16 — and it barely cost anything: $18.5M paid for the calls, $17.45M collected from the puts, net debit just $1.05M. But the exposure behind that tiny check is real: ≈460,650 shares of delta, roughly $249M of notional, and no equity hedge anywhere on the tape. This is a financed bullish bet on the whole semiconductor complex, paid for by taking on downside obligation below $500 and $470 — not a free lunch.
🏦 Fund Overview — SMH Is an ETF, Not a Company
SMH — the VanEck Semiconductor ETF has no earnings, no CEO, no product launch. Every catalyst that moves it belongs to one of its 26 underlying chip names, or to the macro tape.
| Metric | Value |
|---|---|
| Index tracked | MVIS US Listed Semiconductor 25 Index |
| Price (2026-08-03) | ≈$541–544 |
| AUM / net assets | ≈$68–77B (vendors disagree — treat as "high-$60s to mid-$70s billions") |
| Expense ratio | 0.35% |
| Holdings | 26 |
| Top-10 concentration | 71.46% of assets |
| Beta | ≈1.74–1.98 |
| 52-week range | $281.15 – $671.83 |
| Dividend | $1.10/share annual, paid once a year in December; yield 0.20% |
Top holdings and weights (as of 2026-07-30):
| Rank | Name | Weight |
|---|---|---|
| 1 | NVIDIA (NVDA) | 21.70% |
| 2 | Taiwan Semiconductor (TSM) | 9.51% |
| 3 | Broadcom (AVGO) | 6.73% |
| 4 | AMD | 5.43% |
| 5 | ASML | 5.12% |
| 6 | Texas Instruments (TXN) | 4.95% |
| 7 | Micron (MU) | 4.74% |
| 8 | Analog Devices (ADI) | 4.63% |
| 9 | Applied Materials (AMAT) | 4.52% |
| 10 | QUALCOMM (QCOM) | 4.11% |
🚨 Concentration is the single most important structural fact here. NVDA alone is 21.70% of the fund — above the index's 20% single-name cap, which drifts up between quarterly rebalances (the next one is expected ≈2026-09-18, a mechanical seller of NVDA back toward 20%). Three names (NVDA + TSM + AVGO) are 37.94% of the fund; the top 10 are 71.46%. With only 26 lines, SMH is a concentrated bet, not a diversified basket, and its ≈1.74–1.98 beta means it is engineered to move roughly double the S&P in both directions. A −10% market day is closer to a −18% to −20% SMH day, before any chip-specific news layers on top.
💰 The Trade — A Financed Bullish Ladder
Floor-negotiated block, 11:34:48 ET, four legs, 3,700 contracts each, all expiring 2026-10-16. Spot at the print: $540.73.
| Time | Buy/Sell | Call/Put | Expiration | Premium | Strike | Volume | OI | Size | Spot | Option Price | Option Symbol |
|---|---|---|---|---|---|---|---|---|---|---|---|
| 11:34:48 | BUY | CALL | 2026-10-16 | $10.90M | $590 | 3,708 | 194 | 3,700 | $540.73 | $29.45 | SMH20261016C590 |
| 11:34:48 | BUY | CALL | 2026-10-16 | $7.60M | $620 | 3,716 | 622 | 3,700 | $540.73 | $20.55 | SMH20261016C620 |
| 11:34:48 | SELL | PUT | 2026-10-16 | $10.36M | $500 | 4,385 | 3,383 | 3,700 | $540.73 | $28.00 | SMH20261016P500 |
| 11:34:48 | SELL | PUT | 2026-10-16 | $7.09M | $470 | 3,702 | 102 | 3,700 | $540.73 | $19.15 | SMH20261016P470 |
🤝 BLOCK CROSS tag: this printed as a multi-leg floor-negotiated block — brokers arranged all four legs together on the exchange floor with a known counterparty. It is not a lit sweep, so there is no aggressor side to read off the NBBO; the structure and the strikes are the whole story.
The math: pay $29.45 + $20.55 = $50.00/share for the two calls; collect $28.00 + $19.15 = $47.15/share for the two puts. Net cost: $2.85/share × 3,700 × 100 = $1,054,500 ($1.05M net debit) — for a package that carries an estimated +460,650 shares of delta, or ≈$249M of notional exposure at the $540.73 print price. That ratio — $249M of market exposure financed for about $1M — is the entire story of this trade.
✅ RESOLVED — Next-Day OI Is In (August 4, 2026 pre-market)
The OPRA open-interest snapshot timestamped August 4, 2026 ≈06:30 ET reflects the close of business August 3 — the definitive open-vs-close test we flagged when this published. Here is what it says.
| Leg | Baseline OI (Aug-3 snap) | Resolving OI (Aug-4 snap) | Δ | Print size | Δ as % of print | Verdict |
|---|---|---|---|---|---|---|
| Oct-16-2026 $590 call (bought) | 194 | 3,848 | +3,654 | 3,700 | ≈98.8% | ✅ OPEN (BTO) |
| Oct-16-2026 $620 call (bought) | 622 | 4,116 | +3,494 | 3,700 | ≈94.4% | ✅ OPEN (BTO) |
| Oct-16-2026 $500 put (sold) | 3,383 | 6,519 | +3,136 | 3,700 | ≈84.8% | ✅ OPEN (STO) |
| Oct-16-2026 $470 put (sold) | 102 | 3,775 | +3,673 | 3,700 | ≈99.3% | ✅ OPEN (STO) |
Verdict: the whole ladder is a genuine new position — including the leg we could not prove. The $500 put was the honest weak point: only ≈317 contracts were provably new from size alone, and we said a small rise (or a fall) would mean a chunk of that leg was closing rather than opening. It rose by 3,136 — roughly ten times the minimum and ≈85% of the print. The other three legs came in between 94% and 99% of their prints. All four legs: opening.
What that settles: the ≈$249M of delta exposure described in this article was established on August 3, financed for ≈$1.05M net. It is not a repackaging of something that already existed, and the short puts at $500 and $470 are live obligations from that session forward.
🤓 What This Actually Means — Plain English
Strip away the jargon and here's the shape: buy calls at two strikes above the market ($590 and $620), sell puts at two strikes below the market ($500 and $470), same expiration, same size. That's a financed bullish ladder — a risk-reversal shape stacked across two strikes on each side rather than one.
Order types, leg by leg:
- BTO $590 call — bought to open, a fresh long call, proven.
- BTO $620 call — bought to open, a fresh long call, proven.
- STO $500 put — sold to open (mostly), collecting premium for taking on an obligation, provisional on the exact size.
- STO $470 put — sold to open, collecting premium for taking on an obligation, proven.
Why the near-zero net cost matters: normally, buying $18.5M of upside calls is a real financial commitment. Here, the put sales did almost all the work — $17.45M collected against $18.5M paid means the desk got the calls for essentially free, financed by writing puts nearly 800 points below the market on the low end. This is the classic mechanic of a risk reversal: the calls aren't "free money," they're compensation for real downside risk taken on elsewhere in the same package.
The obligation is the risk, and it must be stated plainly: if SMH is below $500 at expiration, this desk is obligated to buy the ETF at $500 (3,700 contracts = 370,000 shares, ≈$185M) — regardless of how far below $500 it falls. If it's below $470, there's a second obligation to buy another 370,000 shares at $470 (≈$174M). Selling puts is not "getting paid for nothing" — it's getting paid to promise you'll catch a falling ETF at those levels. We found no offsetting equity hedge anywhere on the tape, so unlike some packages where a stock block neutralizes the option delta, this exposure looks real and unhedged: whoever is on this side of the trade is genuinely long roughly a quarter-billion dollars of upside-leveraged semiconductor exposure, with genuine downside obligation below $500 and $470.
Context worth noting: this went on the Monday after the July flush and the Thursday rebound — SMH bottomed around $504.22 on 2026-07-29 (≈24.9% below its 52-week high) and then ripped +6.88% the very next session on Lam Research's beat-and-raise. So this ladder was built into the bounce, not into the panic — a bet that the reversal has legs, not a bet on catching a falling knife.
📈 Technical Setup
YTD Chart
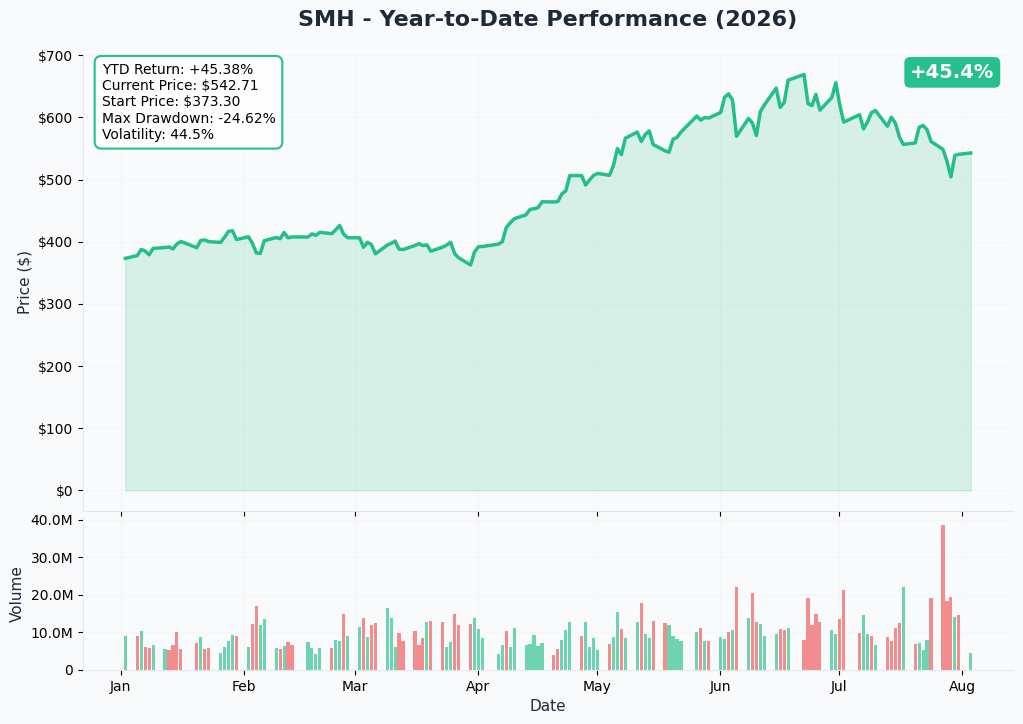
SMH is still up ≈+50.09% YTD and ≈+91.11% over one year despite the July round trip: −24.9% peak-to-trough into the 2026-07-29 low ($504.22), then a +6.88% single-session reversal on 2026-07-30 — the largest one-day gain in years for this fund, driven by Lam Research's record NAND/CSBG-fueled quarter. As of 2026-08-03 SMH sits ≈19.5% below its $671.83 52-week high — still technically in correction territory, not a recovered high.
Gamma-Based Support & Resistance
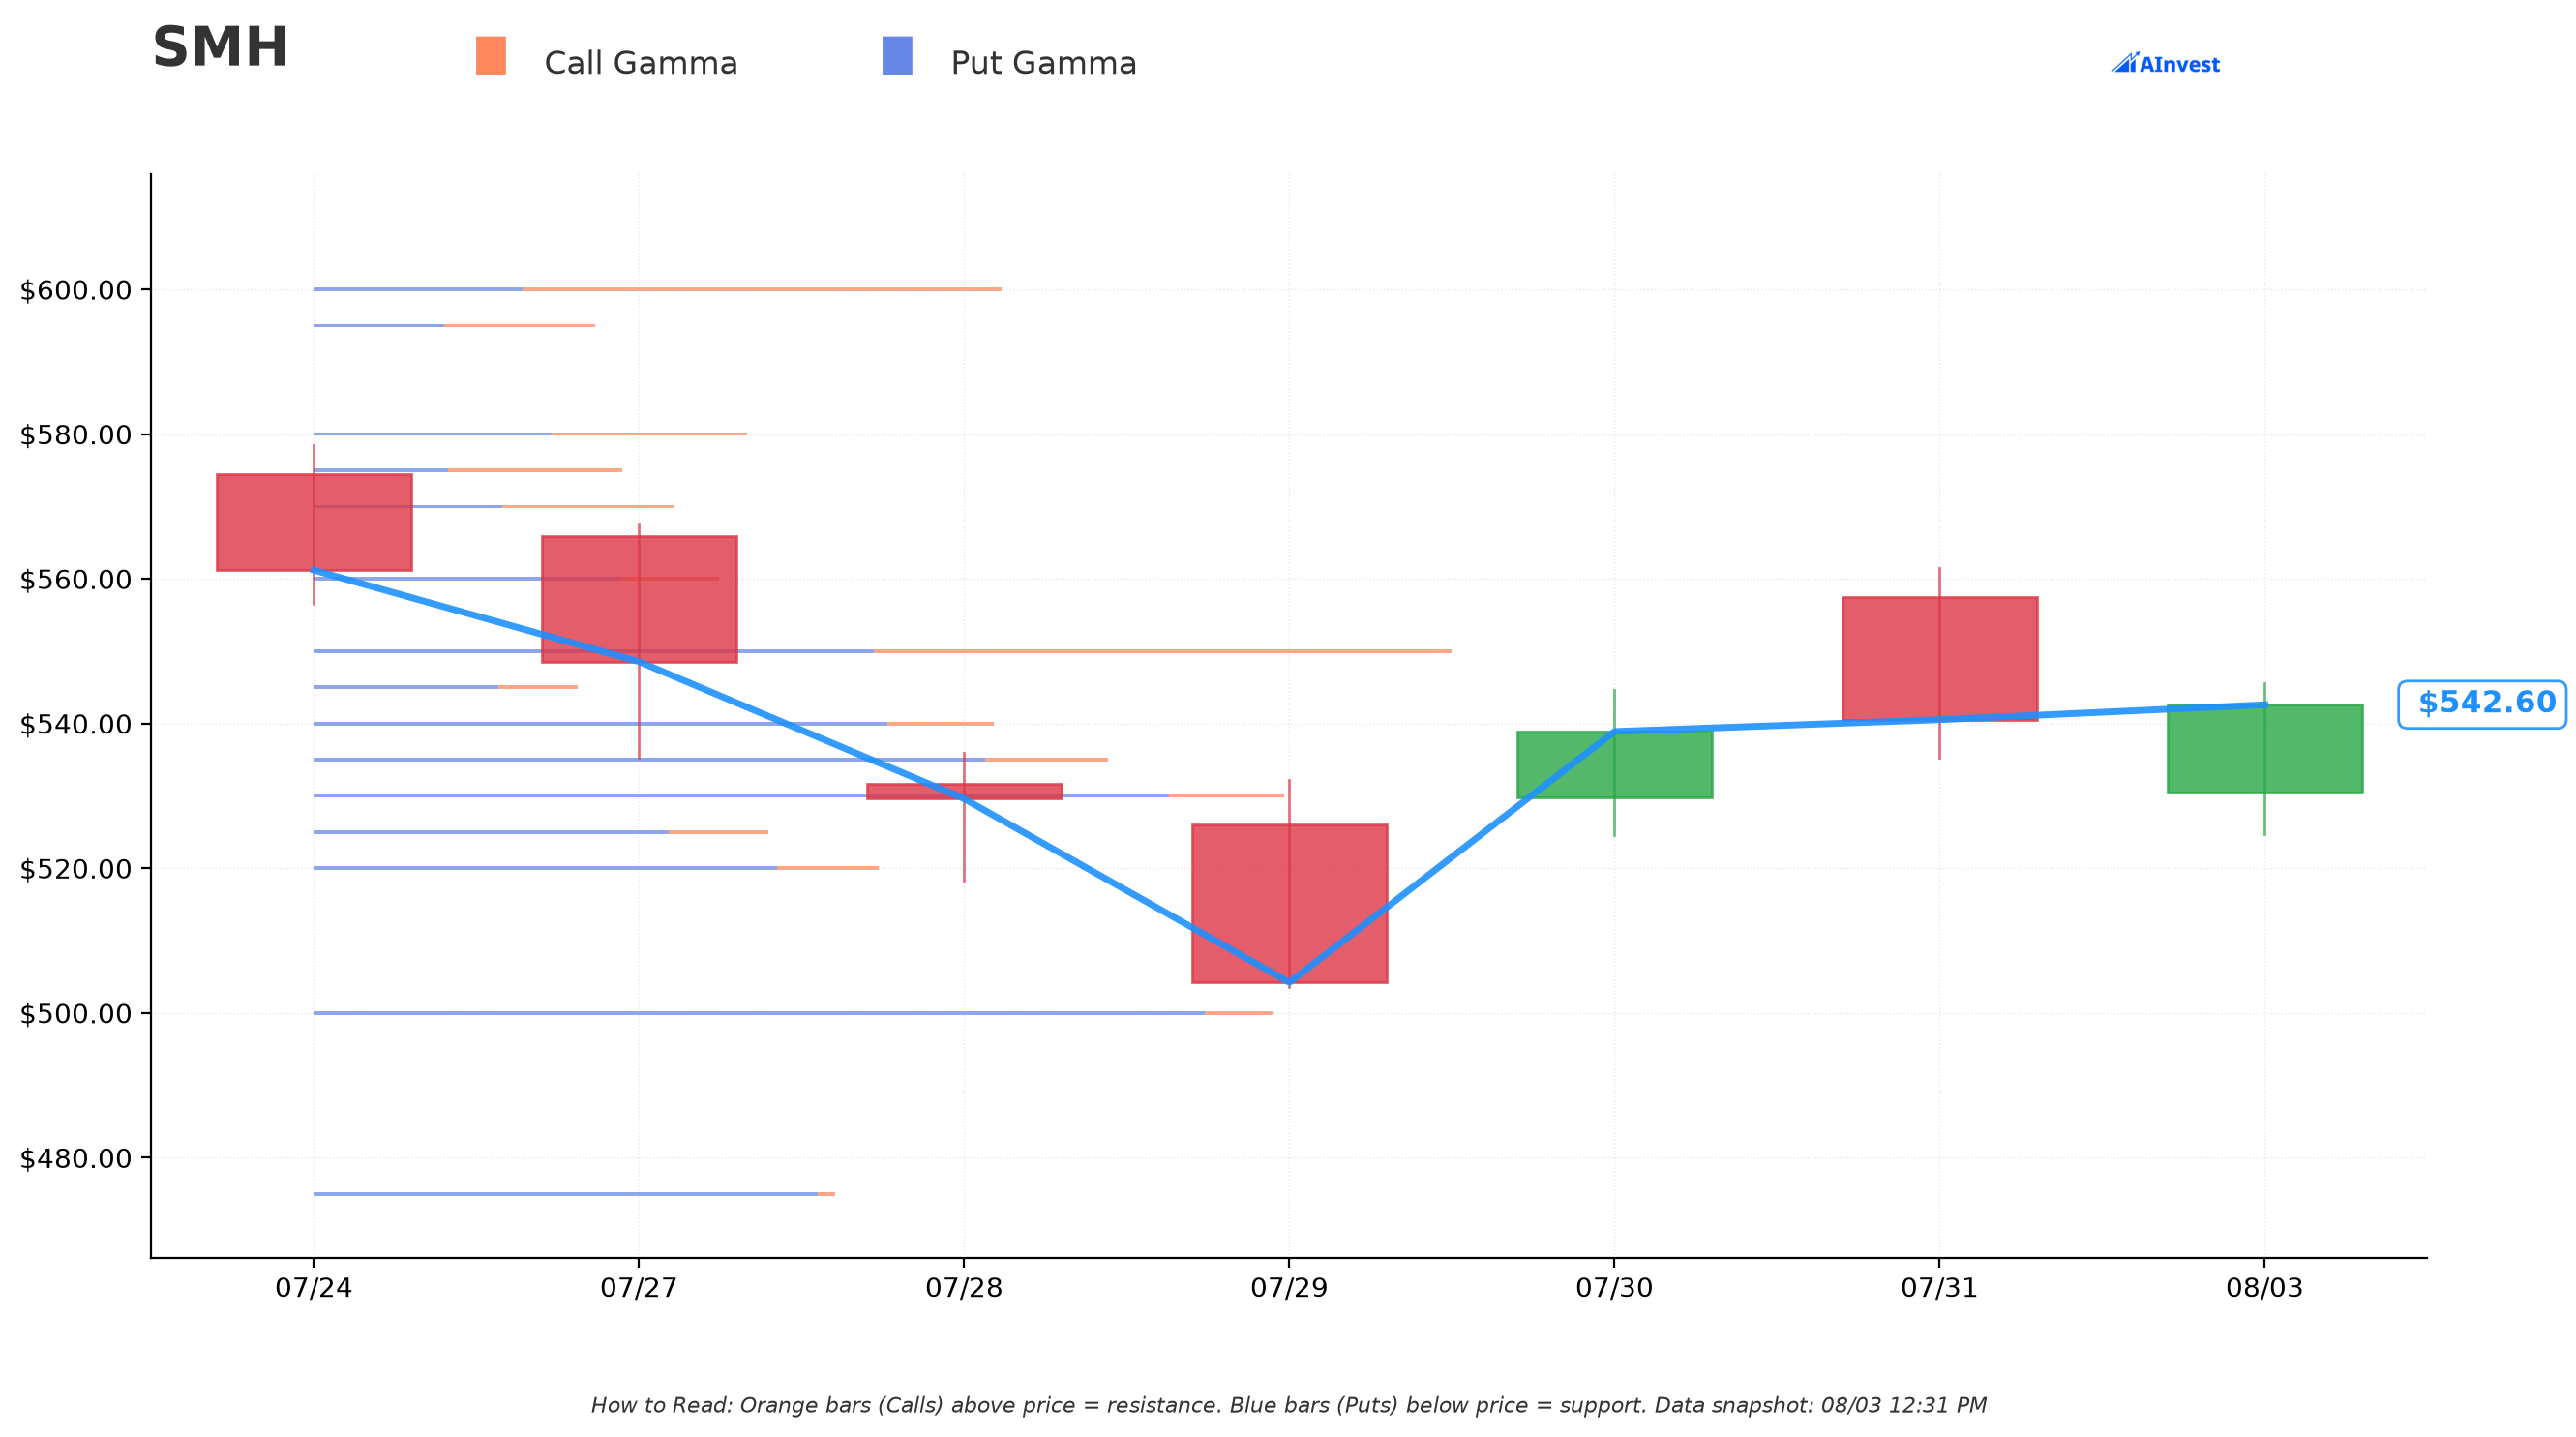
Current price in the gamma map: ≈$542.45.
🔵 Support below spot:
- $540 — immediate, modest support (total gamma ≈10.7B), essentially at-the-money noise
- $535 / $530 — both "Very Strong," gamma ≈12.5B / ≈15.2B, only 1.4%–2.3% below spot
- $500 — "Very Strong," gamma ≈15.0B — and this is exactly where the short put strike sits (≈7.8% below spot). Dealers already carry heavy hedging interest at this level; it reinforces $500 as a real floor, which matters directly to this trade's obligation strike.
- $475 — Support, gamma ≈8.2B, ≈12.4% below spot — sitting just above the $470 short-put obligation strike
- $450 / $400 — deeper structural floors, gamma ≈7.2B / ≈7.4B
🟠 Resistance above spot:
- $550 — "Very Strong," gamma ≈17.9B, only 1.4% above spot — the nearest real ceiling
- $560 — "Strong," gamma ≈6.4B
- $580 — "Strong," gamma ≈6.8B
- $600 — gamma ≈10.8B, ≈10.6% above spot
What this means for the trade: the $500 short put lines up almost exactly with one of the strongest support walls on the whole chain — a level dealers are already defending — which is a modest tailwind for the put-selling side of this package. The $590 long call, by contrast, sits in relatively thin gamma territory between the $580 and $600 walls — no single dominant resistance concentration sits exactly at $590, so a grind higher toward that strike doesn't have to fight through the chain's heaviest overhead supply until closer to $600. The $620 call is further out past even that.
Implied Move
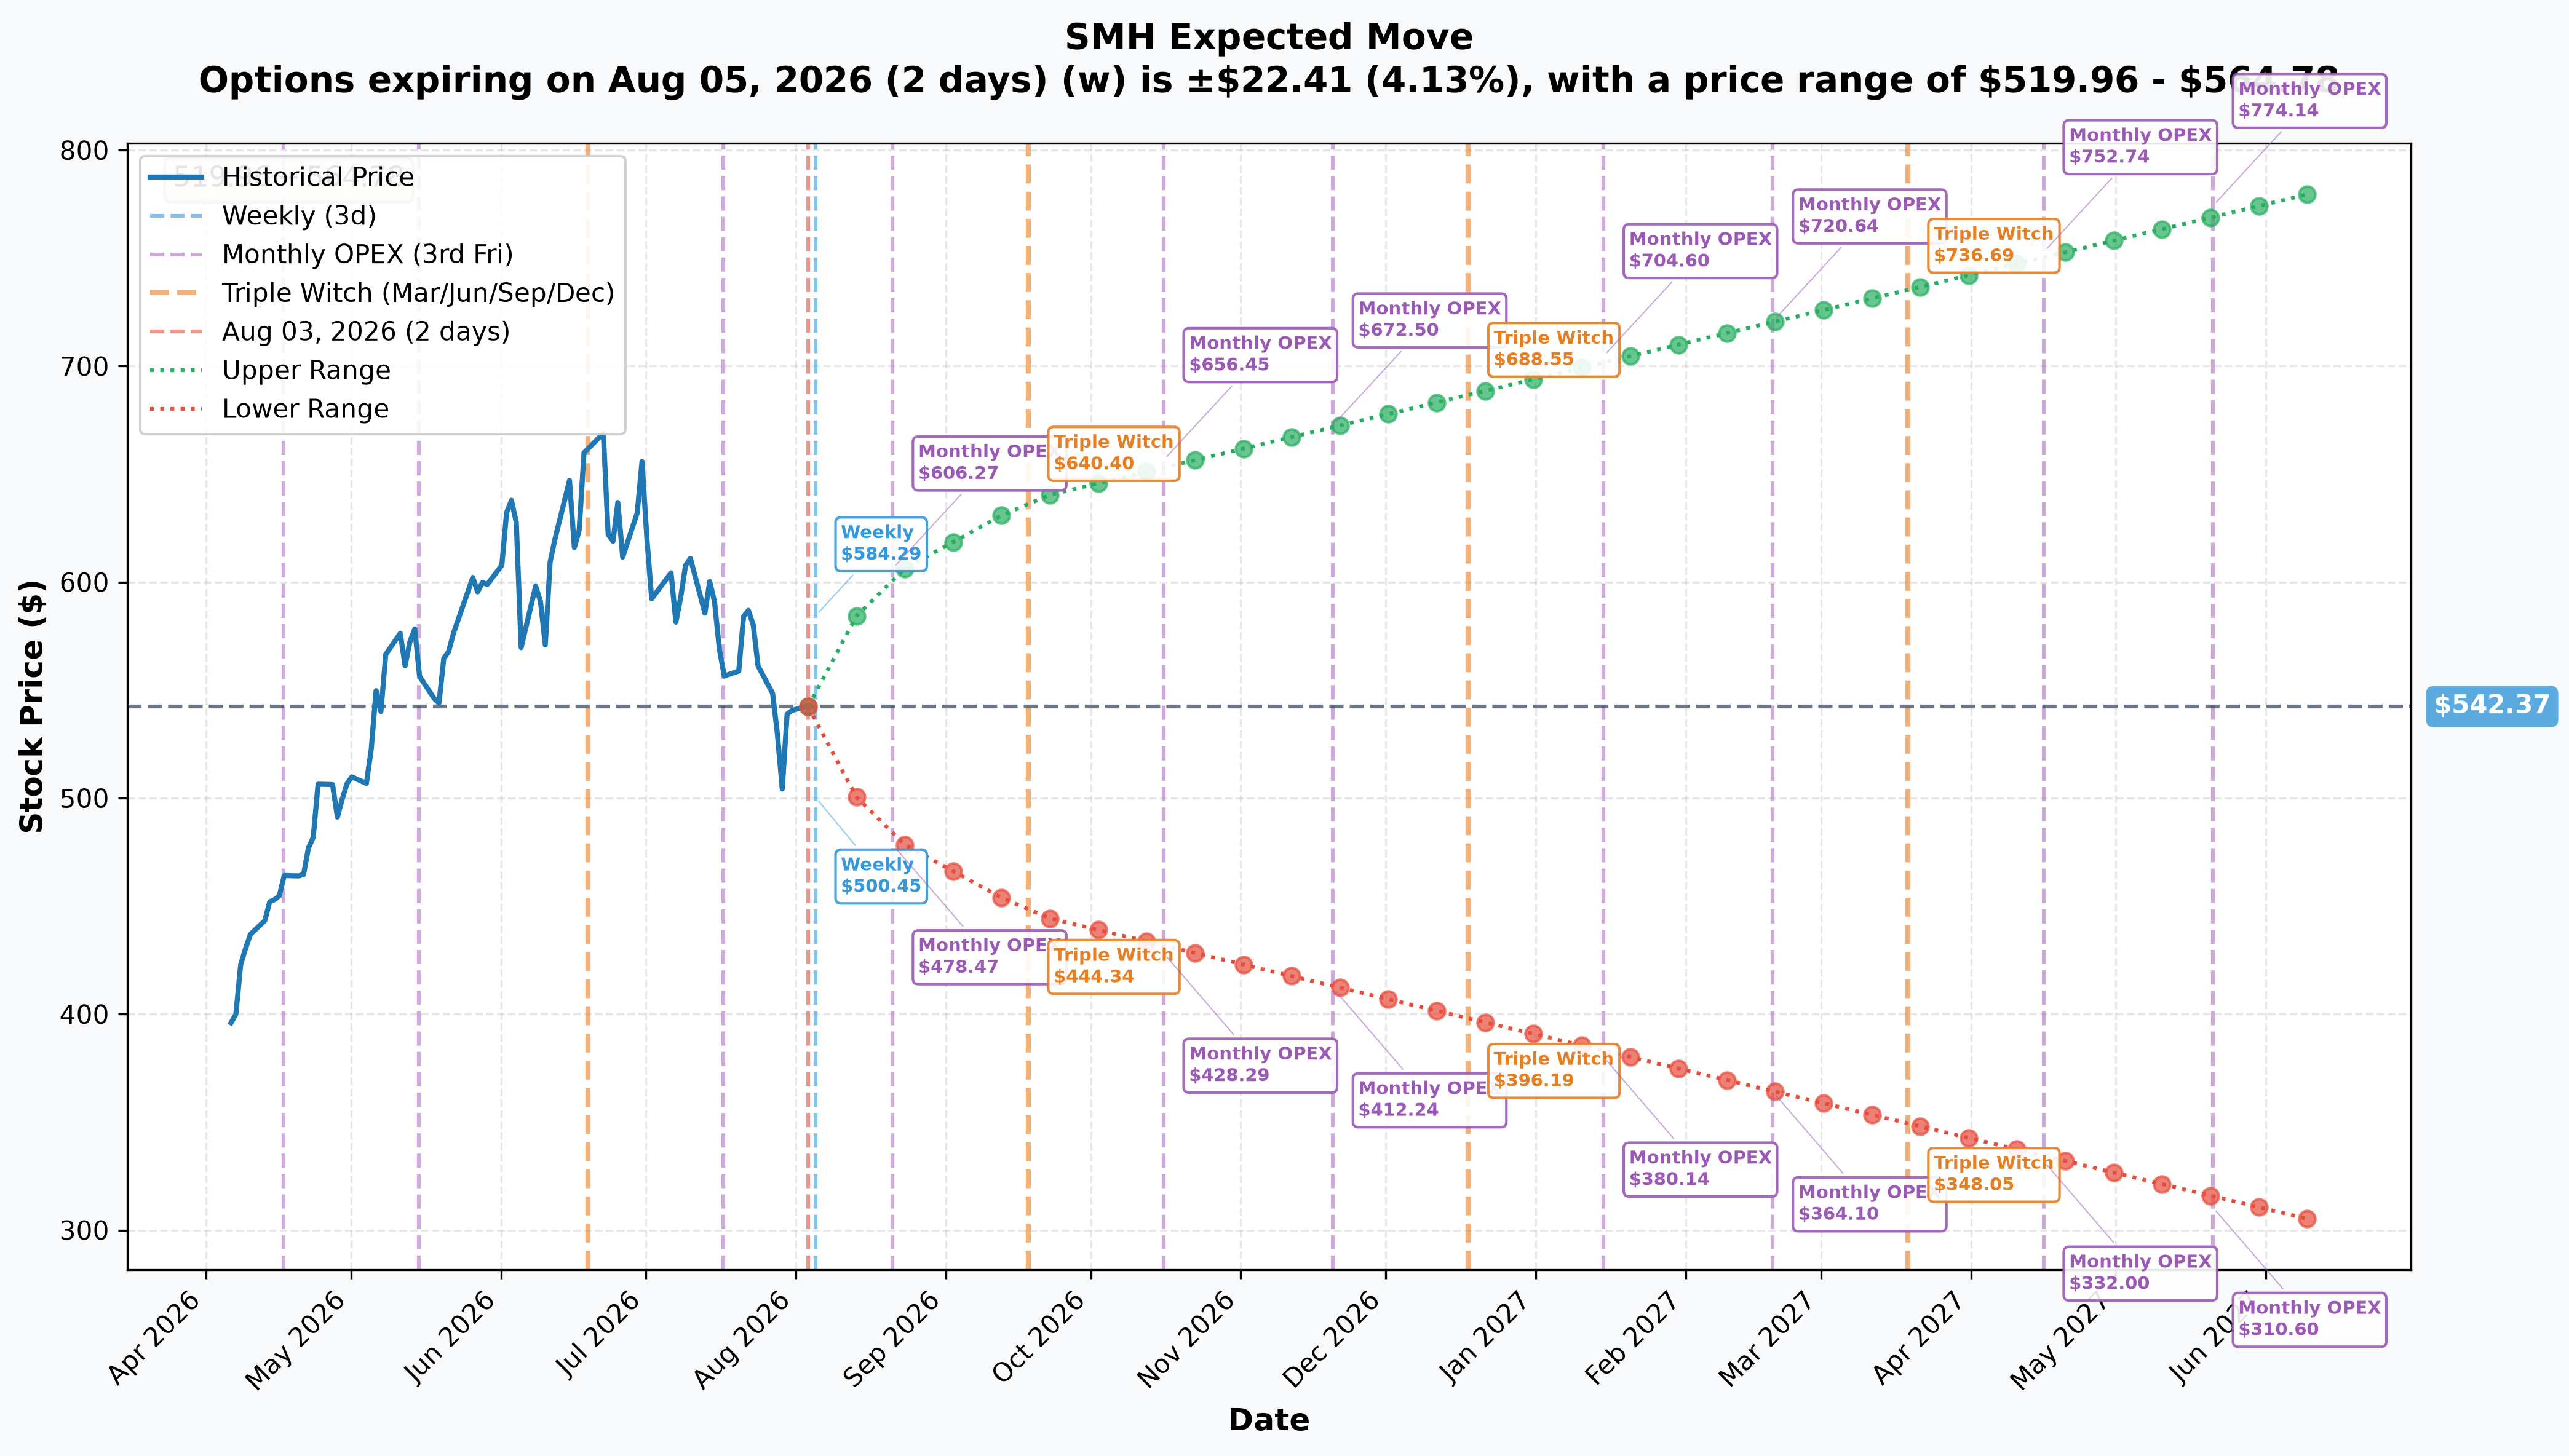
The 2026-10-16 monthly OPEX — the exact expiration of this trade — is charted directly: upper bound ≈$656.45, lower bound ≈$428.29, off a reference spot near $542.37. That's roughly a ±21% one-sigma-ish move priced into the options market by expiration.
Does the cone reach $590? Yes, comfortably. The move required to reach $590 is about $47.63 (≈8.8%) — only about 42% of the full up-move the market is already pricing in by October 16. In other words, the market itself treats $590 as a modest, well-inside-the-distribution outcome, not a tail event — this isn't an aggressive lottery-ticket strike. Reaching $620 requires ≈$77.63 (≈14.3%), about 68% of the priced-in up-move — still inside the cone, but closer to the edge of what options pricing considers a "normal" outcome by expiration.
On the downside, the $500 put strike is only about 37% of the way to the lower bound ($428.29), and the $470 put is about 63% of the way there — both strikes sit inside the market's own expected range, meaning the obligation being sold isn't priced as a remote tail risk either; it's a real, plausible outcome the market assigns meaningful odds to.
🎪 Catalysts Mapped to the 2026-10-16 Expiry
≈42% of SMH's fund weight has a confirmed earnings print landing before this expiry, rising to ≈57% including two expected mid-October prints (SMH_catalysts.md research):
| Date | Event | SMH weight | Status |
|---|---|---|---|
| 2026-08-04 (tomorrow) | AMD Q2 2026 earnings | 5.43% | ✅ Confirmed — stockanalysis.com AMD |
| 2026-08-13 | Applied Materials FQ3 earnings | 4.52% | ✅ Confirmed — stockanalysis.com AMAT |
| 2026-08-26 ⭐⭐⭐ | NVIDIA FQ2 FY2027 earnings | 21.70% | ✅ Confirmed — stockanalysis.com NVDA |
| 2026-08-27 | Marvell earnings | 3.33% | ✅ Confirmed — stockanalysis.com MRVL |
| 2026-09-02 | Broadcom FQ3 earnings | 6.73% | ✅ Confirmed — stockanalysis.com AVGO |
| 2026-09-15/16 | FOMC meeting + SEP | Whole fund (beta ≈1.74–1.98) | ✅ Confirmed — Federal Reserve |
| ≈2026-09-18 | MVIS quarterly index review — NVDA re-capped toward 20% | Mechanical flow, all 26 names | 🟡 Expected |
| 2026-09-22 | Micron FQ4 earnings — the memory referendum | 4.74% | ✅ Confirmed — stockanalysis.com MU |
| ≈2026-10-14 / 10-15 | ASML Q3 / TSMC Q3 results | 5.12% / 9.51% | 🟡 Expected — knife-edge, 1–2 days before expiry |
The one that matters most: NVIDIA, 2026-08-26 — 51 calendar days before this trade's 2026-10-16 expiry. Any option positioned for October fully captures this print with roughly 7 weeks of residual time afterward. NVDA is 21.70% of the fund — the single largest weight by a wide margin (three times the #2 name, TSM at 9.51%) — so this one earnings report drives roughly a fifth of SMH's fate on that day alone. The asymmetry worth flagging: NVDA itself is only +5.75% YTD while the fund it anchors is +50.09% YTD — NVDA has lagged its own fund, meaning 2026's SMH gains came from memory (MU), equipment (LRCX, AMAT) and the Intel turnaround, not from the AI-accelerator leader. That cuts both ways: an NVDA beat is a catch-up trade with genuine room to run; an NVDA miss removes the one holding in the fund that hasn't already re-rated.
Also inside the window: Micron, 2026-09-22. This is the direct referendum on the memory-shortage thesis — Samsung has signaled AI memory shortages could persist through 2028, while China's CXMT announced a second DRAM fab on 2026-08-03, an immediate crack in that bullish case. MU is 4.74% of the fund directly, and the memory-levered equipment names (LRCX + AMAT + KLAC) add another ≈12.7%.
Also inside the window: the ≈2026-09-18 quarterly index rebalance, which is expected to mechanically trim NVDA back toward its 20% cap — a real, dateable flow event that sits inside this trade's holding period regardless of any earnings outcome.
👥 Four-Reader Take
🚀 YOLO trader: This is a professionally-sized, near-zero-cost way to get long the semiconductor bounce with real convexity if NVDA's 2026-08-26 print or the Micron memory referendum on 2026-09-22 goes right. But copying the ratio (not the size) means also copying the obligation — you cannot take the calls without also taking the puts that paid for them. Retail-scale versions of this exist (a smaller call spread financed by a smaller put sale) but the margin requirement on the short puts is real and must be respected.
📊 Swing trader: The trade's own strikes double as a level map — $500 is a genuine, dealer-reinforced gamma support ("Very Strong," ≈15.0B), and $550 is the nearest real resistance ("Very Strong," ≈17.9B) just 1.4% above spot. Watch NVDA's 2026-08-26 print and the ≈2026-09-18 rebalance as the two scheduled events most likely to move SMH through either level before this expiry.
💰 Premium collector: The put side of this ladder — selling the $500 and especially the $470 put — is the template. Collecting $19.15–$28.00 per share on strikes 7.5%–13% below spot, on a fund with a dealer-defended support wall sitting right at $500, is a real income trade if you're comfortable owning SMH at those prices. The catch: sizing this at retail scale still means being ready to buy 100 shares of a 1.74–1.98-beta ETF per contract if it gaps below your strike — this is not a small-account trade at this size, and shouldn't be attempted with anywhere near this leverage on a retail account.
🌱 Beginner: Skip the structure, learn the lesson. Selling options is not "getting money for nothing" — the $17.45M collected here exists because someone is obligated to buy SMH at $500 and $470 no matter how far it falls. If you're new to options, the honest starting point is a single covered call or a small cash-secured put you could actually afford to be assigned — not a four-leg, near-zero-cost package like this one, which requires real capital and real margin behind the short puts.
⚠️ Honest Risk & Limits
- This is PROVEN structure, not proven full-size opening. Three of four legs (both calls, the $470 put) are proven fresh opens against prior OI. The $500 put is only marginally proven — at most ≈317 of the 3,700 contracts are provably new; the rest could be existing OI simply changing hands. Tomorrow's OI print resolves it.
- No equity hedge was found on the tape. That does not prove none exists elsewhere (futures, a different account, an OTC hedge) — OPRA cannot see broker identity, customer identity, or non-exchange hedges. It only proves nothing showed up paired to this print in the options/equity tape we can see.
- Directional intent is inferred from structure, not proven from an aggressor tape. This printed as a negotiated multi-leg floor block with a known counterparty, not a lit sweep — there is no NBBO-aggressor signal to read. The bullish-ladder read comes from the strike geometry (long calls above spot, short puts below spot) and the near-zero net debit, which is high-confidence on shape but does not prove motive — it could be a directional bet, a yield-enhancement overlay on an existing SMH holding, or a hedge unwind we cannot see.
- The obligation does not expire with the calls. If SMH is below $500 or $470 on 2026-10-16, this position is on the hook to buy shares at those prices regardless of how the call side performs — the risk is asymmetric to the downside in dollar terms even though the trade was a near-zero net debit.
- Concentration and beta compound the risk. SMH's NVDA weight (21.70%) and 1.74–1.98 beta mean a single-name surprise on 2026-08-26 can move the whole package before expiry far more than a diversified index would.
- What the tape cannot tell us: who is on the other side, why they chose this exact ratio, whether this is new capital or a rolled/adjusted prior position, and whether any hedge exists off-exchange. Treat this analysis as PROVEN on the trade mechanics and structure, INFERRED on intent, and UNKNOWABLE on counterparty and motive.
This analysis is for informational purposes only and is not investment advice. Options trading involves substantial risk of loss and is not suitable for all investors — selling puts on a 1.74–1.98-beta sector ETF at this size carries real, uncapped downside obligation. Size any position to what you can afford to lose, and consult a licensed financial advisor before trading options.
Last updated: August 4, 2026 — next-day OPRA open-interest resolution added (✅ RESOLVED box above). Original analysis published August 3, 2026.