🛡️ SPCX — $13.7M Bear Put Spread: Hedging the SpaceX Melt-Up with a Defined-Risk Downside Bet
Published: June 17, 2026 — Day 6 of public trading
Last updated: 2026-06-18
✅ Updated 2026-06-18 — OPEN CONFIRMED (both legs): Next-day OPRA OI resolves the bear put spread as fresh on both sides. The long Jun-2027 $150P rose 1,128 → 11,835 (Δ +10,707) and the short $95P rose 15 → 11,216 (Δ +11,201) — each matching its ≈11,000-lot print. The long put is a fresh open (BTO) and the lower put a fresh short (STO); the bearish / downside-hedge read stands. See the ✅ RESOLVED box below.
Quick Take
On only its second day of options trading, a desk placed a 6,025-contract bear put spread on SpaceX (SPCX) — buying Jun-2027 $150 puts and simultaneously selling Jun-2027 $95 puts as a negotiated multi-leg floor block (not a lit-market sweep). Net debit: ≈$13.7M — the capital at risk, and the headline number. Spot was ≈$201.80.
This is a defined-risk bearish structure with a roughly 12-month horizon. It does not require a crash; it requires SPCX to fall ≈25% — from ≈$201.80 down toward the $150 long put — before June 2027. A wall of staggered lockup supply, a first-ever earnings test in September, and an extreme valuation relative to a loss-making base give that thesis concrete near-term fuel. The short $95 put caps the payoff below that level and cheapens the structure by ≈$6.3M.
Company Overview
SpaceX (SPCX) completed the largest IPO in history on June 11, 2026, pricing at $135 (≈$75B raised, ≈$1.77T implied valuation). Trading began June 12 on the Nasdaq. The stock has not traded on fundamentals since: Day 1 close was $160.95 (+19%), the intraday high touched $225.64 by the third session, and it now trades near ≈$201.80 — carrying a market cap of ≈$2.65T, briefly fifth-largest in the world by market cap, above Amazon. The float is ≈4.2% of shares outstanding — an extraordinarily thin free float for a stock this size, which explains both the speed of the melt-up and its fragility.
SpaceX operates two segments. Connectivity (Starlink) generated ≈$11.4B in 2025 revenue, ≈60% of the total, with ≈$4.4B segment operating profit — the profitable engine, with 10.3M subscribers across 100+ countries as of March 2026. Average revenue per user is declining: from ≈$99/month in 2023 to ≈$66/month by March 2026, a margin-watch item. Space (launch + crew) generated ≈$4.0B in 2025, up only ≈8% YoY. ≈75% of Falcon 9 launches were internal Starlink deployments, not commercial contracts. Total 2025 net loss: ≈$4.9B. Starship — the reusable heavy-lift system at the center of NASA's Artemis III Human Landing System contract — remains under development, with Flight 13 still gated by an FAA-required mishap investigation.
The Trade
Structure: Bear Put Spread — negotiated multi-leg floor block
| Field | Long Leg | Short Leg |
|---|---|---|
| Time | 12:05:21 ET, June 17 | 12:05:21 ET, June 17 |
| Buy/Sell | BUY | SELL |
| Right | PUT | PUT |
| Expiration | Jun 17, 2027 | Jun 17, 2027 |
| Strike | $150 | $95 |
| Volume | 6,025 contracts | 6,025 contracts |
| Option Price | ≈$32.75 | ≈$10.40 |
| Leg Premium | ≈$20.0M | ≈$6.3M (collected) |
| Net Debit | ≈$13.7M | |
| Prior OI | 1,100 | 15 |
| Spot at Print | ≈$201.80 | ≈$201.80 |
| Option Symbol | SPCX20270617P150 | SPCX20270617P95 |
| Execution | Multi-leg floor block | (same block) |
| Order Type | BTO — ✅ confirmed open (next-day OI) | STO — ✅ confirmed open (next-day OI) |
| Flow Type | 🛡️ Negotiated / Defined-Risk |
Mechanism note: Both legs printed simultaneously as a single negotiated multi-leg floor block — executed off the open book, not via electronic sweep. A known counterparty is on the other side at an agreed price. This is a positioned hedge or downside bet, not urgency-driven lit aggression.
Equity tape check: No large stock block printed near this timestamp that would suggest delta-hedging. This is a directional options structure, not a synthetic position offset by a stock hedge.
✅ RESOLVED — Next-Day OI Confirms Fresh Opens (2026-06-18)
| Leg | Pre-print baseline (EOD 2026-06-16) | Resolving (EOD 2026-06-17) | Δ | Verdict |
|---|---|---|---|---|
| Jun-2027 $150P (long) | 1,128 | 11,835 | +10,707 | ✅ OPEN confirmed (BTO) |
| Jun-2027 $95P (short) | 15 | 11,216 | +11,201 | ✅ OPEN confirmed (STO) |
The next-day OPRA open-interest snapshot resolves the question definitively: both legs rose by approximately their ≈11,000-lot trade sizes off near-zero baselines. The long $150 put climbed 1,128 → 11,835 (Δ +10,707) and the short $95 put climbed 15 → 11,216 (Δ +11,201) — each delta tracking the print almost one-for-one. That confirms a brand-new bear put spread was opened, not a close or unwind: a long higher-strike put (BTO) financed by a freshly-sold lower-strike put (STO), forming a net-debit bearish / downside-hedge structure. The bearish read in this article stands without revision.
🤓 What This Actually Means — Plain English
A bear put spread works like this: you pay for the right to sell the stock at $150 (the long put), but to reduce your cost you simultaneously sell someone else the right to sell at $95 (the short put). If SPCX is above $150 at expiration, both puts expire worthless and you lose the full net debit of ≈$13.7M. If SPCX falls below $150, your long put starts paying off — but your gains are capped once SPCX falls below $95, because your short put starts paying out to the other side.
The maximum possible payoff is the full $55 spread width ($150 − $95), across 6,025 contracts and 100 shares each: ≈$33.1M gross (≈$19.4M net of the ≈$13.7M cost), or a maximum gain of ≈141% on the net debit. That maximum is only reached if SPCX is at or below $95 by June 17, 2027.
The spread is structured so the breakeven is ≈$136.27 (long strike $150 minus the ≈$13.73 net debit per share). At spot ≈$201.80, the stock needs to fall roughly 32% for the position to break even at expiration. A 25% decline gets you to the $150 long strike, where the position begins to build value. These are large moves — but SPCX has already swung double-digit percentages in single sessions, and the fundamental backdrop is unusual.
Why would a desk do this on Day 2 of options trading? Several reasons fit:
- Fading the thin-float squeeze: with only ≈4.2% of shares in public hands, any sizable forced sell could have an outsized price impact. The spread is a low-cost-per-dollar way to position for that scenario.
- Hedging an existing long: a portfolio that owns SPCX stock from the IPO at $135 might hedge with downside puts. The short $95 put funds part of the hedge while accepting that a catastrophic drop below $95 is not fully covered.
- Lockup supply + first-earnings binary: every major lockup date (September 2 earnings, December 180-day cliff) falls inside this option's life, giving the bear thesis concrete timing anchors.
- Defined risk over an outright short: shorting a thin-float stock with unlimited upside risk is dangerous; buying a spread caps the loss at ≈$13.7M regardless of how far SPCX rallies.
The short $95 put does two things: it cheapens the spread by ≈$6.3M (the premium collected), and it implicitly says the desk does not expect a catastrophic drop below $95 — or is comfortable accepting that level's unlimited downside cap.
Technical Setup
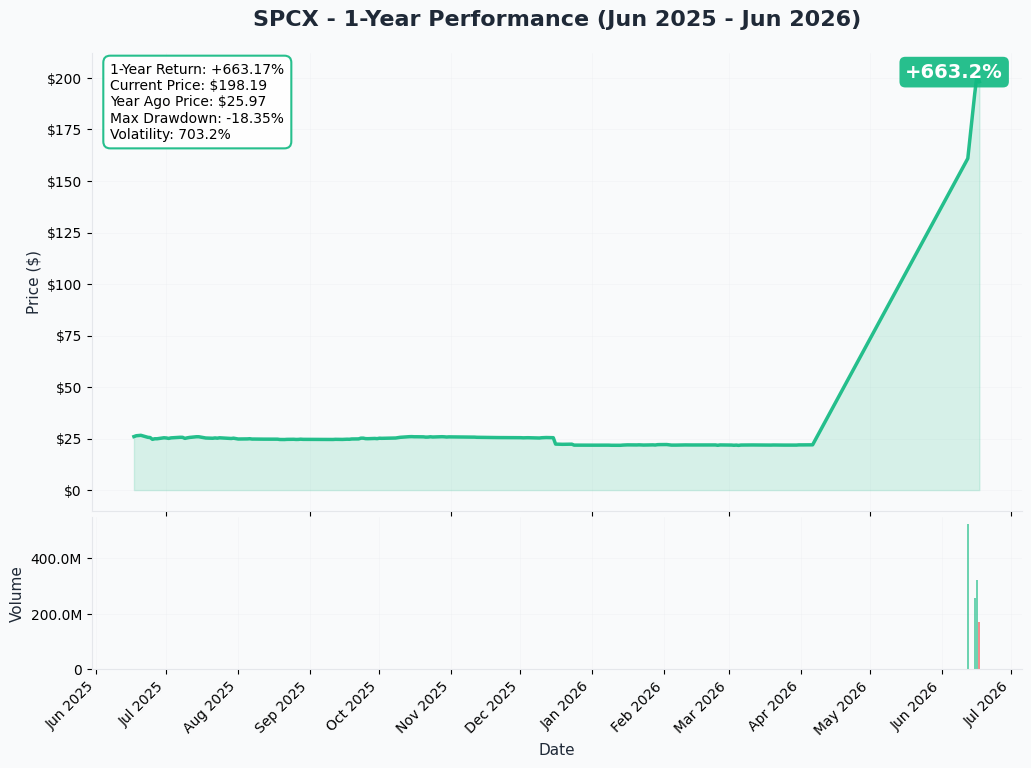
YTD Chart: SPCX has only ≈4 sessions of price history. The chart shows the entire public-market life: open near $160 on Day 1, an intraday spike to $225.64, a pullback, and a current print near ≈$201.80. There are no meaningful traditional support levels from price history — this is a brand-new chart.
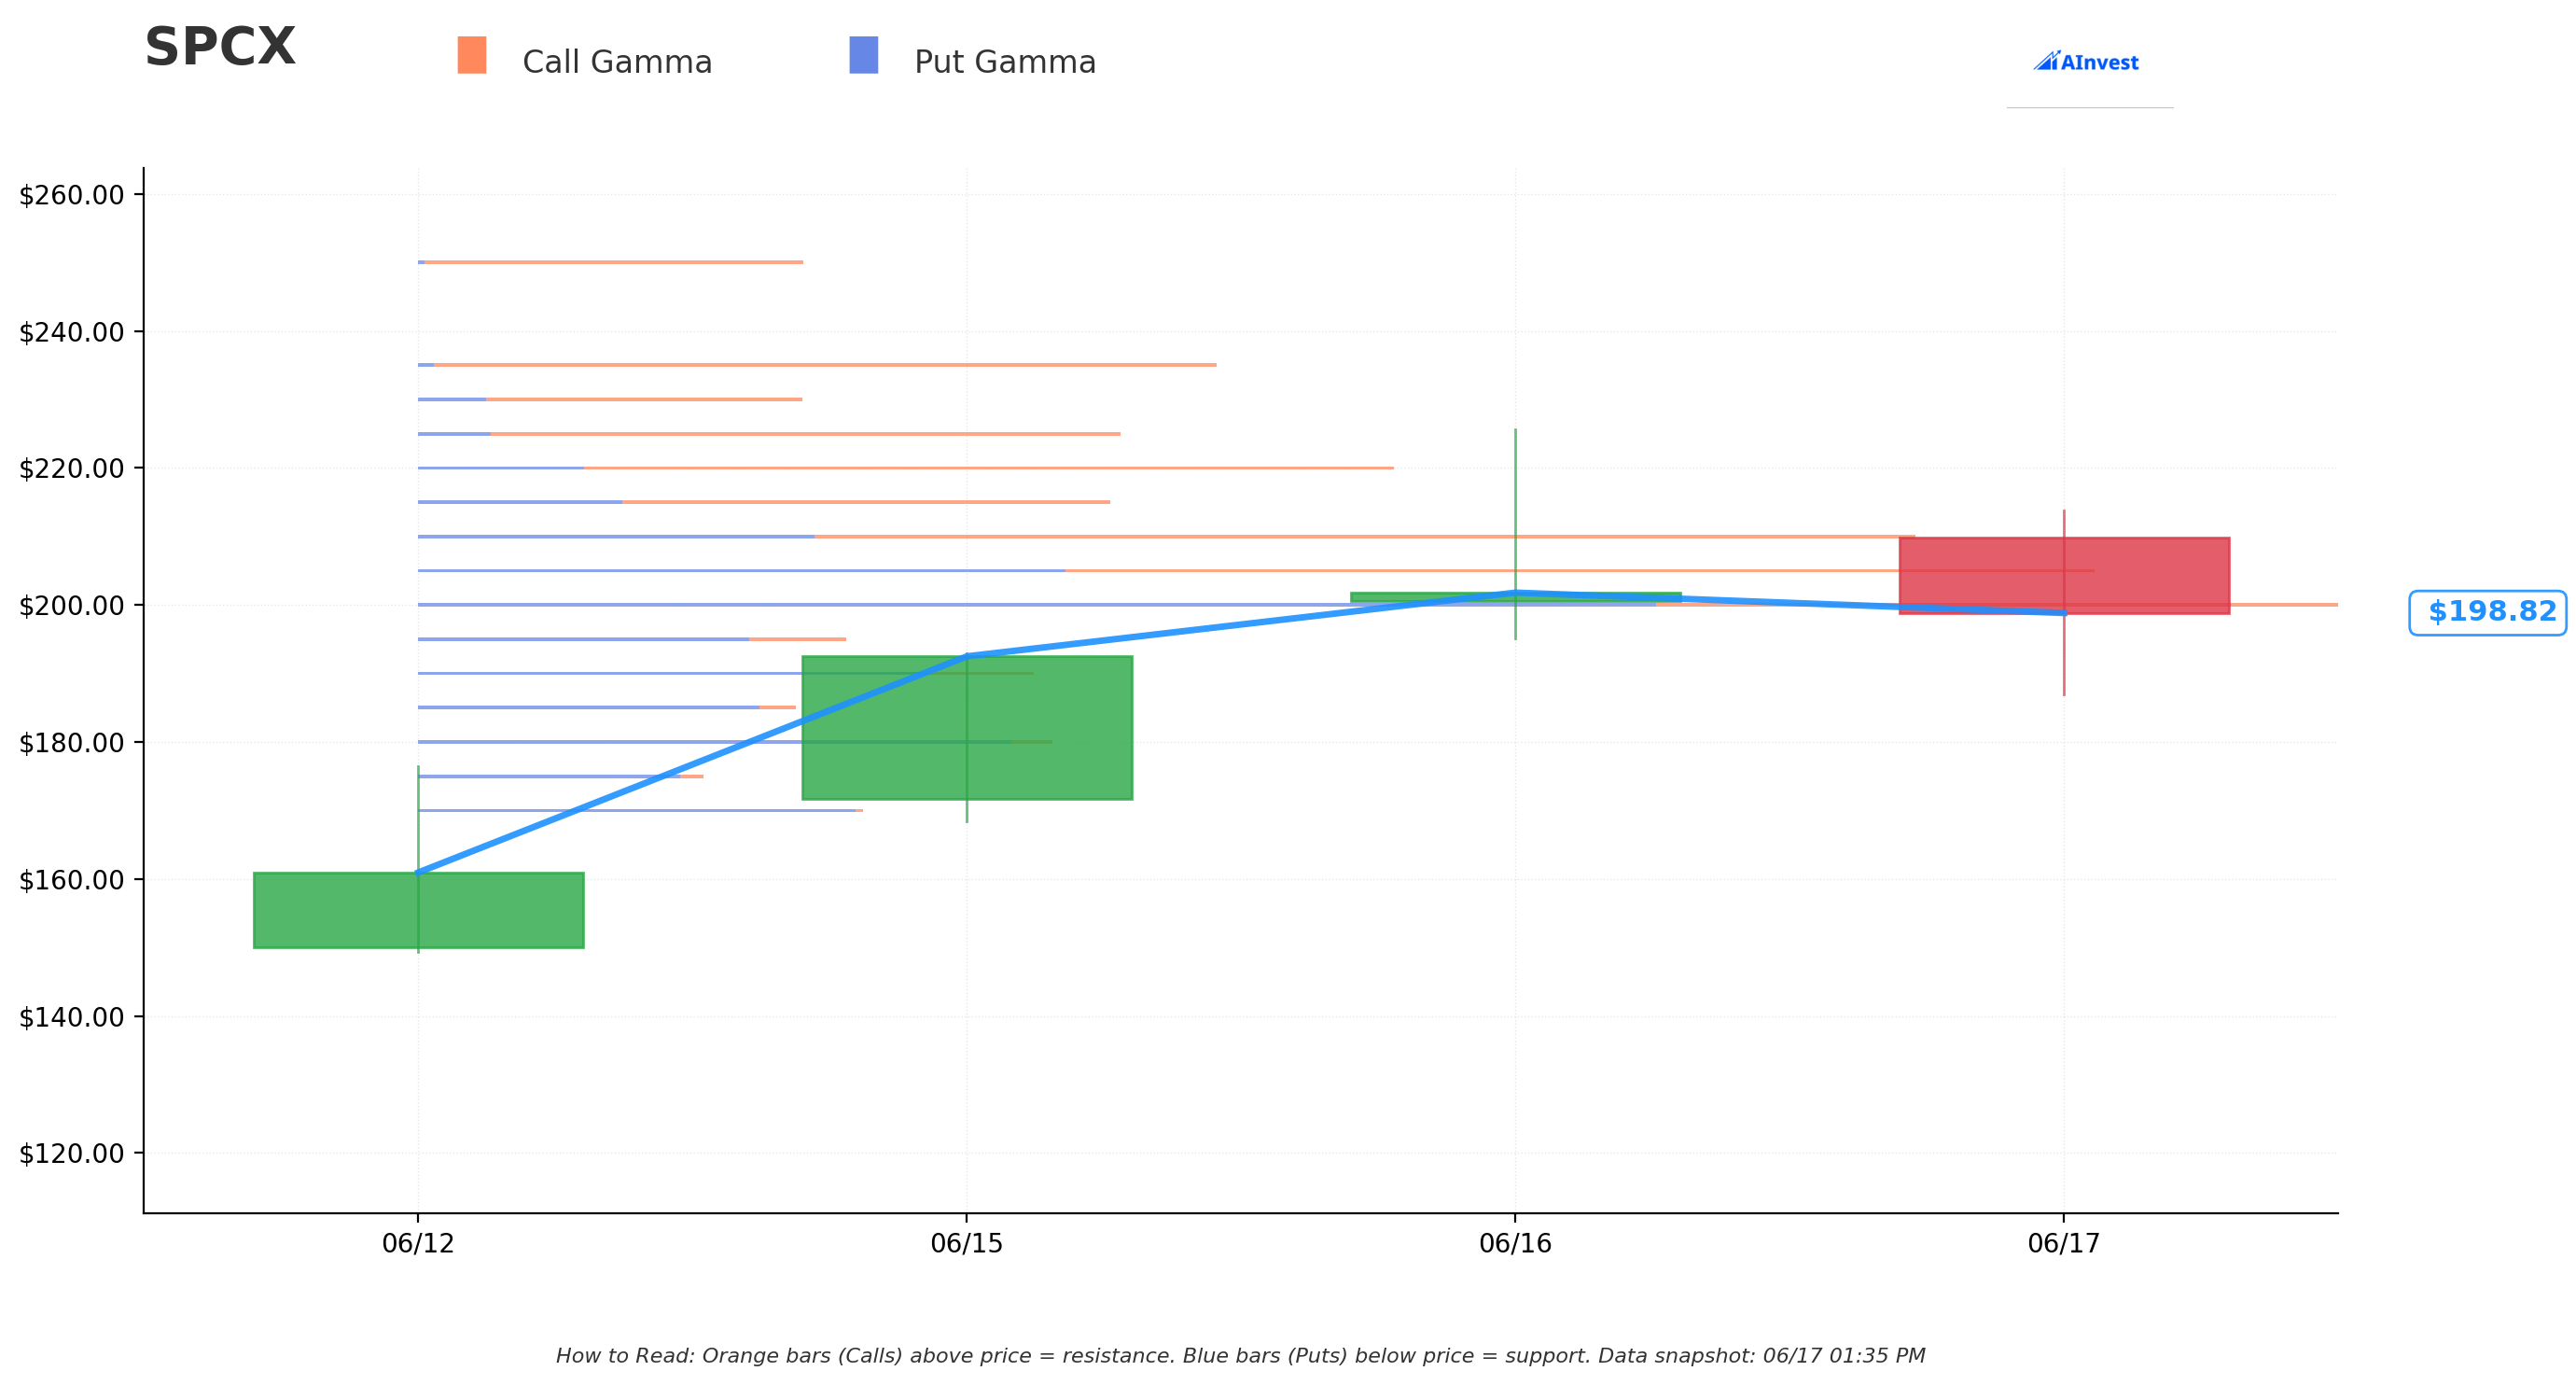
Gamma Support and Resistance: Despite limited price history, the options market has already built a significant gamma structure. Key levels from the current gamma exposure map:
Resistance (overhead):
- $200 — Very Strong (≈$12.3M total GEX, the dominant strike; SPCX is trading just through this level). The heavy concentration of puts at $200 means market makers are short gamma here — moves through $200 can be amplified, not dampened.
- $205 — Very Strong (≈$10.7M total GEX). A secondary resistance cluster ≈2.9% above spot.
- $210 — Strong (≈$9.6M GEX). Gamma wall at ≈5.4% above spot.
- $220 and $235 — additional resistance walls at ≈10.4% and ≈18.0% above spot respectively.
Support (downside):
- $195 — Moderate (≈2.7M total GEX, ≈2.1% below spot). First cushion on a pullback.
- $190 — Moderate (≈3.9M GEX, ≈4.6% below spot). Meaningful put-heavy concentration.
- $185 — Moderate (≈2.4M GEX, ≈7.1% below spot).
- $180 carries the largest total GEX below spot (≈$4.0M), dominated by puts — the heaviest dealer-hedging zone on the downside.
- $170 has significant put GEX (≈$2.8M) and represents the next major floor if $180 breaks.
- $150 — the long put strike in this trade — carries notable put GEX (≈$1.1M) and sits at ≈24.7% below spot.
The structure is notable: the $200 strike has nearly double the GEX of the $205 strike, and the gamma profile is put-heavy across all downside strikes. This is consistent with institutional hedging activity on a newly-public mega-cap where downside protection is in active demand.
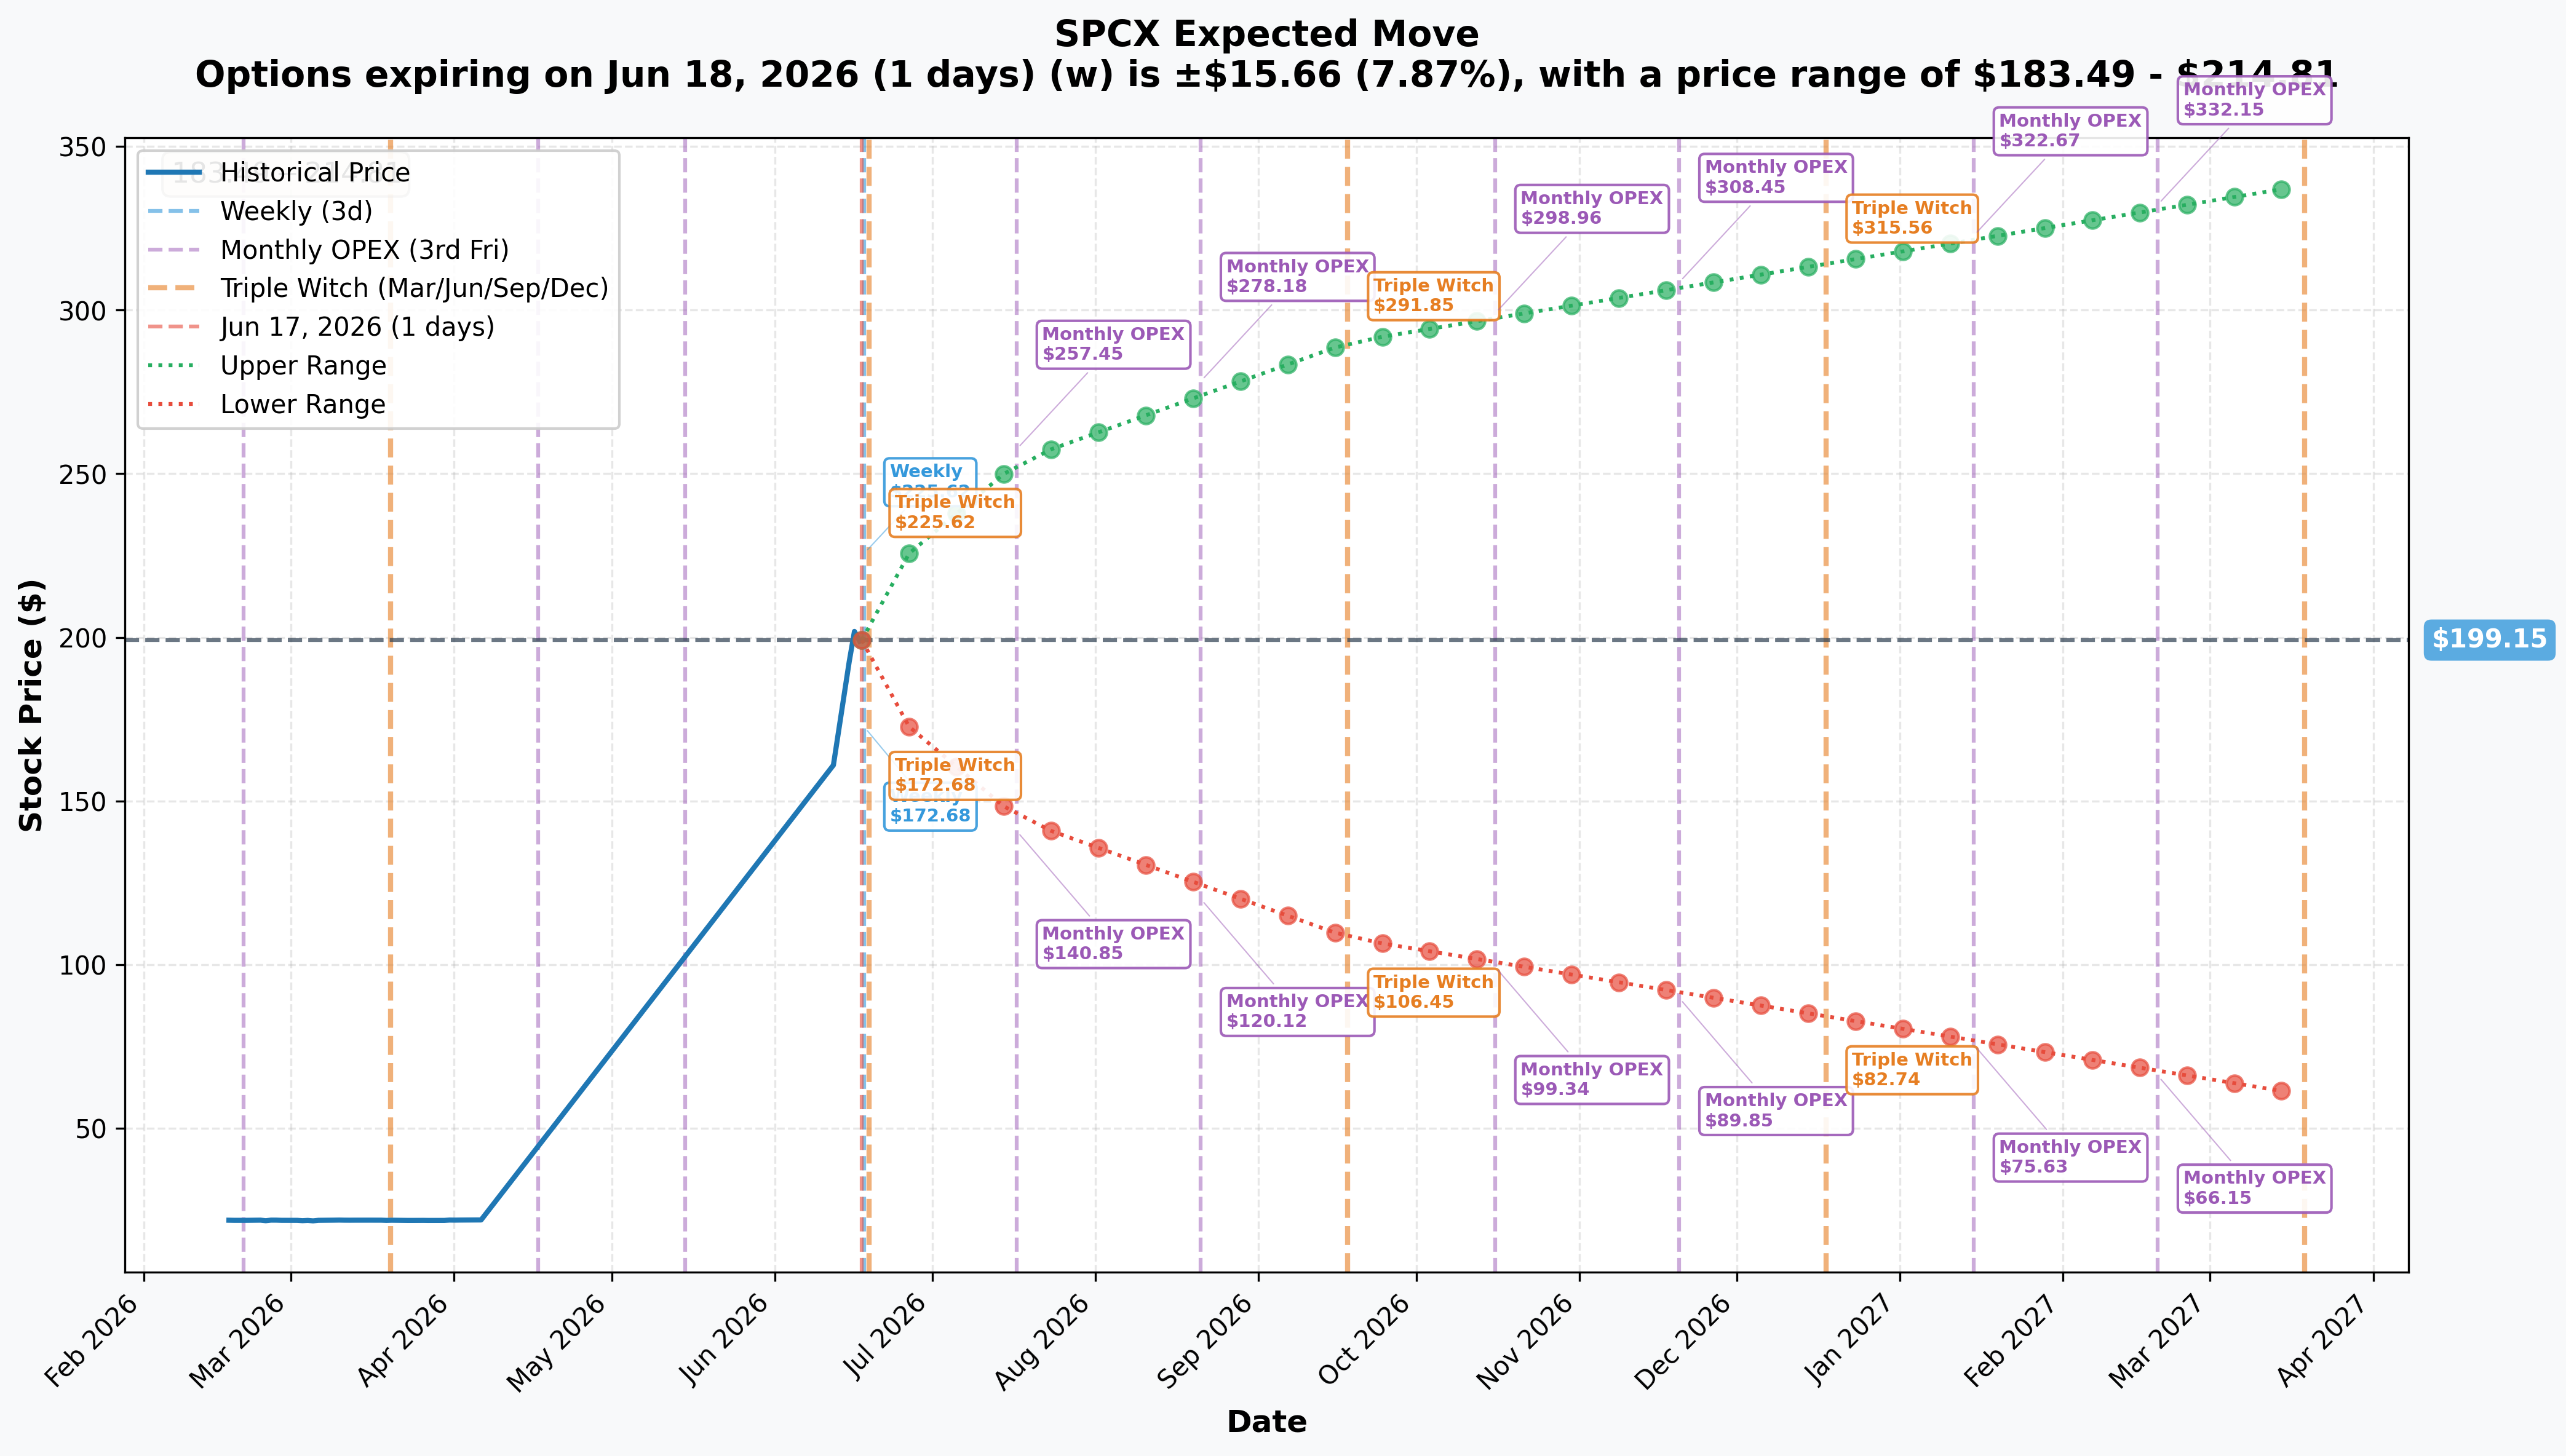
Implied Move Cones: The options market is pricing extreme uncertainty for a 4-session-old stock:
- This week (June 18 expiry): ±≈$15.66 (≈±7.9%) — upper ≈$215, lower ≈$183.
- July OPEX (July 17): ±≈$54.84 (≈±27.5%) — upper ≈$254, lower ≈$144.
- September OPEX (Sept 18, triple witch): ±≈$91.12 (≈±45.8%) — upper ≈$291, lower ≈$108. This window brackets the September 2 first-earnings date.
- March 2027 LEAPS (closest to the Jun-2027 expiry): the full-year cone spans roughly ≈$60 to ≈$338 — the options market is genuinely pricing a >5x spread of outcomes on a 12-month view.
Key implication for the spread: The July monthly cone's lower bound of ≈$144 is below the $150 long-put strike — meaning the options market already assigns meaningful probability to SPCX being at or below the long strike within 30 days. The September cone's lower bound of ≈$108 sits well below the $150 strike and approaches the $95 short-put territory. This spread is not a contrarian bet on a fringe scenario — the IV surface is already pricing sizeable downside as a real possibility.
Catalysts
September 2, 2026 — First public earnings + lockup trigger (highest priority)
The single most important date inside the option's window. Per Investing.com, Q2 2026 earnings are expected September 2 — SpaceX's first-ever GAAP quarterly report as a public company. Investors will see Starlink ARPU trajectory, Space-segment margins, and the consolidated loss run-rate for the first time under public-company scrutiny.
Per Motley Fool and Darrow Wealth Management, the earnings date is also the first lockup-release trigger: eligible insiders may sell up to 20% of locked shares. An additional 10% performance bonus tranche unlocks only if SPCX closes ≥30% above the $135 IPO price (≈$175.50) on 5 of the 10 consecutive sessions ending at the earnings date. At ≈$201.80, that bar is already met — this extra tranche is on track to trigger, adding incremental supply.
Mid-December 2026 — Standard 180-day lockup expiration
Per Bitrue, the 180-day lockup expires ≈December 8–12, 2026. This is the largest single supply event inside the option's life: the cumulative staggered releases before this date could reach ≈93% of locked stock, per Darrow Wealth Management. The final cliff is a structural overhang the bear spread is explicitly positioned to capture.
≈June 26–27, 2026 — Index-fund absorption (demand pulse, not repeat)
Per TradingKey and Morningstar, ≈15 trading days post-listing, index and ETF funds are expected to absorb ≈30% of the current free float — one-time forced demand. This is likely the near-term upside risk to the put spread. Once the index-inclusion buying is complete, the demand pulse does not repeat.
≈July 11, 2026 — Greenshoe deadline
Underwriters' 30-day option on ≈83M additional shares (≈$11.2B) expires per TechCrunch. Full exercise would nudge float to ≈4.9%, still extremely thin.
Elon Musk's ≈6.4B shares locked to June 12, 2027
Per Motley Fool, the dominant holder's supply does not reach the market before the Jun-2027 option expiry. This caps the most catastrophic downside scenario — if Musk's stake were unleashed, sub-$95 outcomes would become more probable. Its absence is a meaningful nuance in sizing the $95 short-put risk.
Starship and operational catalysts (binary, both directions)
Per Spaceflight Now, Flight 13 is currently gated by an FAA-required mishap investigation. A successful clean flight + orbital propellant-transfer demonstration (a prerequisite for the Artemis III HLS contract) would be a sharp upside catalyst against the puts. An extended delay or another anomaly is a downside catalyst.
How Four Different Traders Might Read This
The YOLO speculator: This is cheap access to a SpaceX short without the unlimited risk of shorting the stock directly. At ≈$13.7M net debit, the max loss is defined. If SPCX revisits the IPO price of $135 — below even the $136.27 breakeven — this spread could be worth close to its full ≈$33M by expiry. The risk: SPCX stays above $201 for months while theta quietly erodes the spread's value.
The swing trader: The Sept 2 earnings date is the first real timing catalyst. If SPCX sells off around earnings (common for newly-public names with inflated expectations and first-ever scrutiny), the $150 put could move significantly into the money. Watch the $190–$195 gamma support zone — a break of that band accelerates toward $180, a heavier put-GEX floor that could slow the move. The $200 level directly above spot is the key upside gate; a daily close above it with confirmation would be a near-term thesis headwind.
The premium collector (options seller): The desk that sold the $95 puts is collecting ≈$10.40 on a strike ≈53% below spot. It is implicitly selling extreme downside insurance on a stock the market has not yet price-discovered properly. That premium looks attractive until you consider Musk's lock only runs to June 2027 — and that the seller needs SPCX to stay above $95, which is below the $135 IPO price. Thin-float crashes can be violent.
The long-term investor (new to options): Think of this as a one-year insurance policy. The buyer is paying ≈$13.7M for the right to sell SPCX at $150 per share — even if the stock is trading at, say, $80 — while limiting how much they gain below $95. For a large institution that may own SPCX stock or is managing portfolio risk, paying ≈$13.7M to cap downside on a >$200-per-share position worth hundreds of millions is modest insurance. The structure says: "I believe SPCX could fall significantly, but I do not expect a complete collapse below $95."
Honest Risk — What the Tape Cannot Prove and What Can Go Wrong
What the tape confirms: The structure (bear put spread, both legs simultaneous), the execution mechanism (multi-leg floor block, negotiated off-book), the net debit (≈$13.7M), and — now RESOLVED by next-day OPRA OI — that both legs are fresh opens (OI rose by ≈the trade size on each: $150P +10,707, $95P +11,201; see the ✅ RESOLVED box above). The earlier open/close ambiguity is closed: this is an opening BTO/STO position, not a close or unwind. What the tape still cannot tell us: the identity of the buyer or seller, whether this is a hedge against an existing SPCX position or a standalone directional bet, and the full size of any underlying portfolio this trade sits within.
The melt-up risk is real. With ≈4.2% float, SPCX can sustain irrational price levels for weeks or months. Every day SPCX remains above $201 is a day of theta decay working against the long puts. A 1-year at-the-money put on a stock with this implied volatility (the annual cone spans ≈$60 to ≈$338) carries significant time value that erodes continuously.
Index-fund buying is near-term upside fuel. The ≈June 26–27 index-inclusion demand pulse could push SPCX toward or through $225 before any supply thesis plays out. This spread needs patience and tolerance for near-term mark-to-market losses.
Analyst consensus is already bearish vs. current price. Per TradingKey, the average 12-month price target is ≈$164 — itself ≈19% below the current ≈$201.80. The consensus does not reach the $150 long strike on average. However, the low analyst target of ≈$63 suggests the full payoff zone (below $150) is within the range of serious institutional analysis.
Bid-ask and liquidity risk. On a 4-session-old options chain, bid-ask spreads on deep out-of-the-money puts with low OI can be wide. The mark-to-market value of this spread may oscillate dramatically without any fundamental change, purely from liquidity conditions. Implied volatility on a newly-public thin-float stock is itself unstable and could collapse (crushing the put values) or expand (helping them) independent of price movement.
Musk's lock to June 2027 limits catastrophic downside. The dominant holder's supply does not arrive before expiry. This meaningfully reduces the probability of the most extreme downside scenarios (sub-$95) that would maximize the spread's payoff. It is a structural nuance that partly explains why a defined-risk spread (rather than deep OTM puts alone) is the rational vehicle here.
Article generated: 2026-06-17. ✅ Last updated: 2026-06-18 — next-day OPRA OI confirmed both bear-put-spread legs as fresh opens ($150P 1,128 → 11,835, +10,707; $95P 15 → 11,216, +11,201).
Options trading involves substantial risk of loss and is not appropriate for all investors. This analysis is informational only and does not constitute investment advice. Always consult a licensed financial professional before trading options.
Last updated: 2026-06-18