🤝 SpaceX (SPCX) $1.6M-Credit Block Cross Builds a 7,500-Lot Synthetic Short at $115
📅 2026-08-05 | 🤝 Multi-Leg Block Cross
🎯 The Quick Take
A trader crossed 7,500 September $115 calls (sold) against 7,500 September $115 puts (bought) on SpaceX (SPCX) in one negotiated block at 11:26:48 ET, with the stock trading at $116.97 at the moment of the print. Selling the call and buying the put at the same strike and same expiration builds what's known as a synthetic short — a position that behaves almost like being short 750,000 shares of stock — and it was done for a net $1,612,500 credit. The tape genuinely cannot tell us whether this is a hedge on stock someone already owns (a "conversion," locking in an effective sale price near $115) or a standalone bearish bet, and that distinction matters enormously for how to read it.
🏢 Company Overview
SpaceX (Space Exploration Technologies Corp., SPCX) is common stock on NASDAQ — not an ETF. The company designs and manufactures reusable rockets and spacecraft (Falcon 9, Falcon Heavy, Dragon) and sells launch services, alongside its Starlink satellite-broadband business; the company reports three segments — Space, Connectivity, and AI. It sits in Industrials / Aerospace & Defense, though the market is increasingly pricing it with AI-infrastructure beta given the Connectivity and AI segments.
SpaceX IPO'd on June 12, 2026 at $135/share, ran to a ≈$200+ high later that month, and now carries a market cap of roughly $1.43–1.45 trillion. Because it has only traded since mid-June, there is no meaningful multi-year chart history to lean on — everything below reflects an ≈8-week-old listing, not an established trading range.
💰 The Option Flow Breakdown
📊 What Just Happened
| Time (ET) | Buy/Sell | Call/Put | Expiration | Premium | Strike | Volume | Prior OI | Size | Spot | Option Price | Option Symbol |
|---|---|---|---|---|---|---|---|---|---|---|---|
| 11:26:48 | SELL | CALL | 2026-09-18 | $11,002,500 | $115 | 10,000 | 3,034 | 7,500 | $116.97 | $14.67 | SPCX20260918C115 |
| 11:26:48 | BUY | PUT | 2026-09-18 | $9,390,000 | $115 | 8,700 | 10,873 | 7,500 | $116.97 | $12.52 | SPCX20260918P115 |
- Net: a $1,612,500 CREDIT ($11,002,500 collected on the calls sold, minus $9,390,000 paid for the puts bought). Gross two-sided premium was ≈$20.4M — but net is the number that reflects what actually changed hands, and it's a credit, not a debit.
- Same strike ($115), same expiration (September 18, 2026), same size (7,500) on both legs, printed at the same second — this is one coordinated package, not two unrelated trades.
- Using the deltas carried on the print (call ≈+0.558, put ≈−0.4409), the desk's own package-delta read on this cross works out to roughly −418,575 shares of directional short exposure — a substantial one-way footprint, out of a raw notional of 750,000 shares (7,500 contracts × 100 per leg).
✅ RESOLVED — Both Legs Opened; the Synthetic Short Is Clean
Updated 2026-08-06 pre-market. The ≈06:30 ET OPRA open-interest snapshot (reflecting the August 5 close) has published.
| Leg | Baseline OI (Aug-5 snap) | Predicted | Actual (Aug-6 snap) | Δ | Print size | Δ as % of print | Day vol | Verdict |
|---|---|---|---|---|---|---|---|---|
| Sep-18 $115 C (sold 7,500) | 3,034 | ≈10,500 | 16,078 | +13,044 | 7,500 | ≈+173.9% | 18,920 | ✅ OPEN (STO) |
| Sep-18 $115 P (bought 7,500) | 10,873 | ≈18,373 open / ≈3,373 close | 21,473 | +10,600 | 7,500 | ≈+141.3% | 17,647 | ✅ OPEN (BTO) |
The put leg — the genuinely provisional one — resolved as opening. We published both branches: open interest rising toward ≈18,373 confirms a new long put, falling toward ≈3,373 would mean an existing short put was being covered. It rose, to 21,473. The unwind-layered-under-a-new-short scenario is ruled out. This is a clean, freshly-built synthetic short, exactly as the package geometry suggested.
Both legs came in well above prediction, which tells you something separate. The call added 13,044 contracts against a 7,500 print (174%) and the put added 10,600 (141%), on day volumes of 18,920 and 17,647 — roughly 2.4× the package size at each strike. So this desk was not the only participant opening at the $115 line on August 5; a broader wave of positioning went through the same strike. The 7,500-lot cross is confirmed as new, and it sits inside a larger day of accumulation there.
What is now established: a 7,500-lot synthetic short at $115 was opened, both legs new. What the tape still cannot show: whether this is a directional bearish view or a hedge against a long position (shares, pre-IPO exposure, or a convertible) that OPRA cannot see — and, because it printed as a cross, there is no aggressor or implied-volatility signature to read intent from.
🚦 Mechanism Notes
Both legs executed as a multi-leg block cross — a broker matched a buyer and a seller off the open order book, with a known counterparty already lined up on the other side. That's negotiated position management, not an aggressive sweep that tore through the lit market. It also means the usual "at the bid / at the ask" aggressor read doesn't apply here, and neither does an implied-volatility-through-the-print check — crosses don't take displayed liquidity, so IV around this print is ambient, not a signal of who wanted in more urgently.
A separate, smaller 3,500-lot print at the same $115 strike (both legs) printed later, around 12:09–13:08 ET, and was cancelled on the tape. That is a different trade from the 7,500-lot package above, which is unaffected and remains a valid, standing print.
🤓 What This Actually Means — Plain English
The structure: a synthetic short. Selling a call and buying a put at the same strike and same expiration, in matched size, is a textbook way to build synthetic short exposure. Think of it this way: a call and a put at the same strike are mirror images of each other, and combining a short call with a long put makes the package move almost dollar-for-dollar opposite to the stock — nearly the same payoff as being short 750,000 shares outright, except instead of borrowing stock and paying a fee to short it, this trader collected $1,612,500 to put the position on.
Order type, leg by leg:
- Sep-18 $115 call: STO (sell-to-open), reasonably confirmed. Size clears prior OI, so this reads as a genuinely new short call being written — collecting premium, taking on the obligation to deliver stock at $115 if it's called away.
- Sep-18 $115 put: BUY, confirmed ✅ BTO. It printed alongside the call as one package, which pointed toward a new long put — and the next-day open interest confirmed it, rising 10,873 → 21,473 (+10,600) rather than falling. The BTC alternative is ruled out.
Two honest readings, and we cannot tell which from the tape:
- A hedge on stock someone already owns — a "conversion." If the trader already holds SPCX shares (an early employee or investor sitting on stock from the June 12 IPO, for example), stacking a short call and long put on top of that stock locks in an effective forward sale price near $115, regardless of where the stock trades between now and September 18. SpaceX's lock-up expiration is a known pending event in the catalyst calendar — though its exact date is not confirmed by any source we could verify, so we are not asserting a date here. An early holder hedging restricted or soon-to-be-unlocked stock ahead of that event is a coherent story.
- A standalone bearish bet. Without any stock underneath it, this same package is simply a directional wager that SPCX sits below roughly $115 by September 18 — collecting the credit up front, with the short call leg uncovered if there's no stock behind it (meaning losses on a sharp rally are not capped the way a covered position's would be).
OPRA's options tape has no visibility into a stock position sitting in someone's account. A multi-leg options cross like this one pairs option legs against each other, not against an equity leg the way a stock-plus-options combo would show up on the tape — so there is no independent equity print here to confirm or rule out an existing stock position. This is exactly why we present both readings instead of picking one.
📈 Technical Setup / Chart Check-Up
YTD Chart
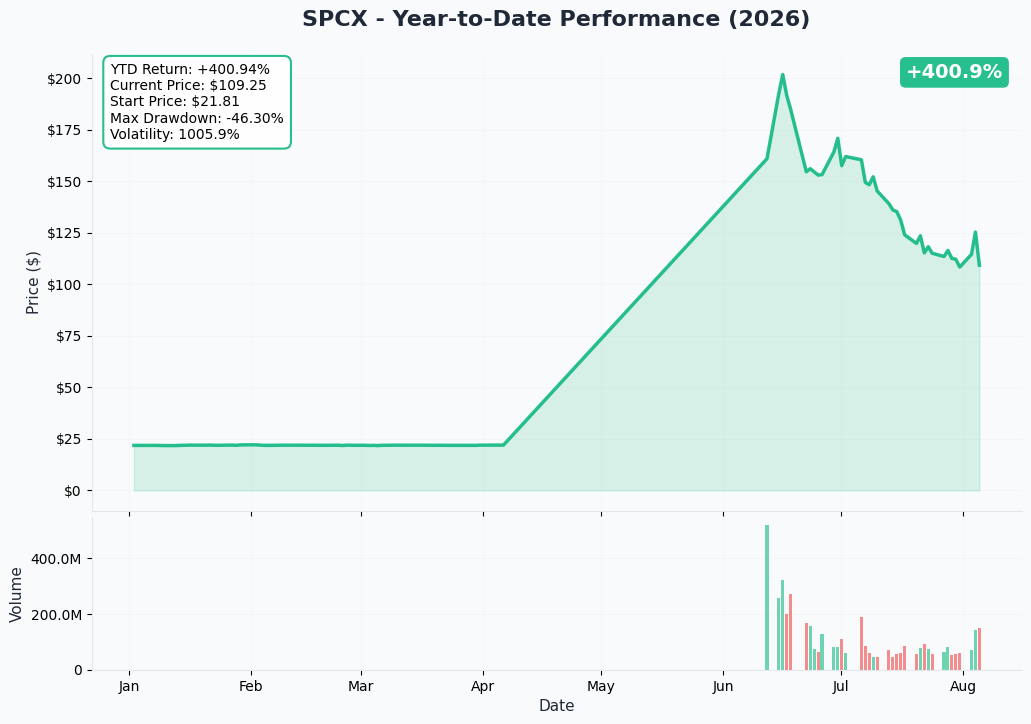
A conventional "YTD" read is not meaningful here — SPCX has only traded since June 12, 2026. The chart above is the entire trading history: a run from the $135 IPO price to a ≈$200+ high, followed by a slide to a 52-week low of $104.83. The stock is down ≈28.1% from its IPO price and roughly −51% from its 52-week high of $225.64, currently sitting within about 4% of its all-time low. There simply isn't enough history yet to define support and resistance the way a multi-year chart would.
Gamma-Based Support & Resistance Analysis
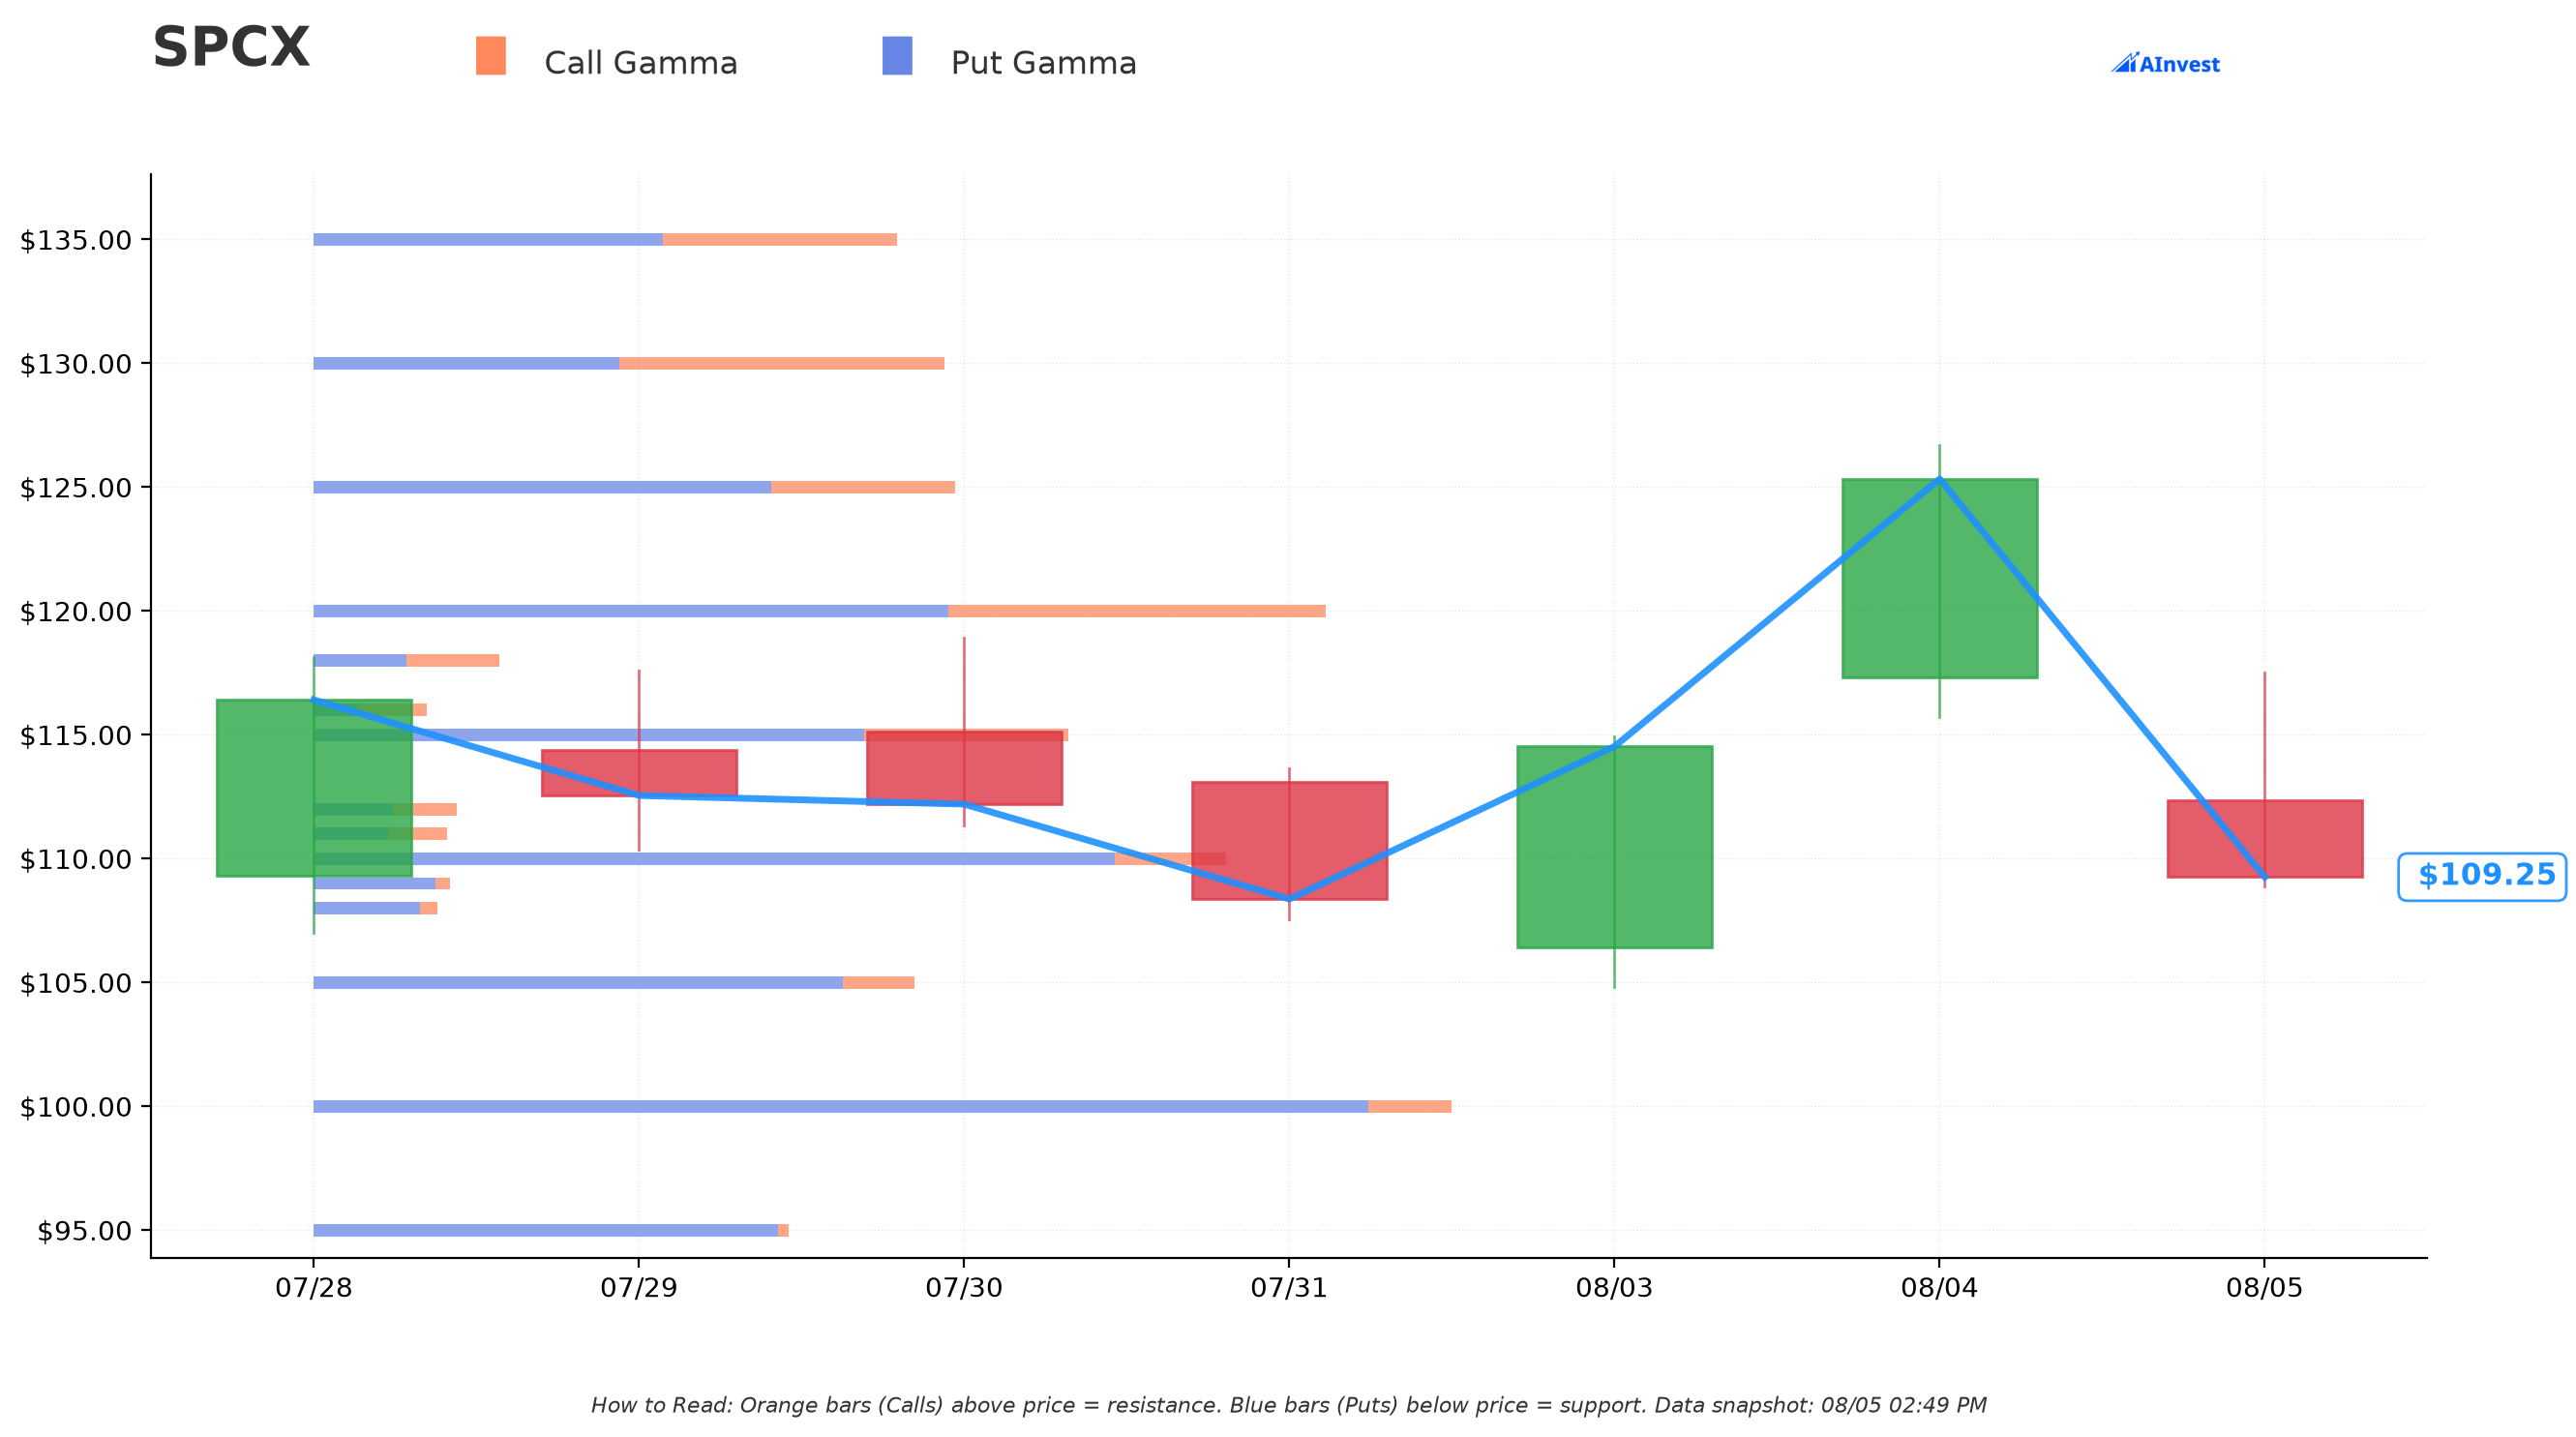
With SPCX near $109.10 (dealer positioning snapshot), the gamma table shows:
- Nearest resistance: $110 — "Very Strong," only ≈0.8% above spot, total gamma exposure ≈23.9 (put-dominated).
- Next resistance: $115 — the exact strike this trade used — also "Very Strong," ≈5.4% above spot. Dealers already carry a meaningful hedging footprint at this precise level, which is worth noting given that's where the block cross's strike sits.
- Larger "Resistance Wall": $120, ≈10.0% above spot, with the biggest total gamma concentration on the resistance side (≈26.5, more call-heavy than the levels below it).
- Nearest support: $109 (moderate, essentially at spot) and $105 ("Very Strong," ≈3.8% below spot).
- Larger "Support Wall": $100, ≈8.3% below spot — the single largest support concentration on the board (≈29.8 total gamma, overwhelmingly put-side).
Put-side gamma dominates almost every level here — consistent with a market where downside hedging demand (puts) currently outweighs call buying, a backdrop that fits a stock that just gapped down ≈13% on earnings.
Implied Move Analysis
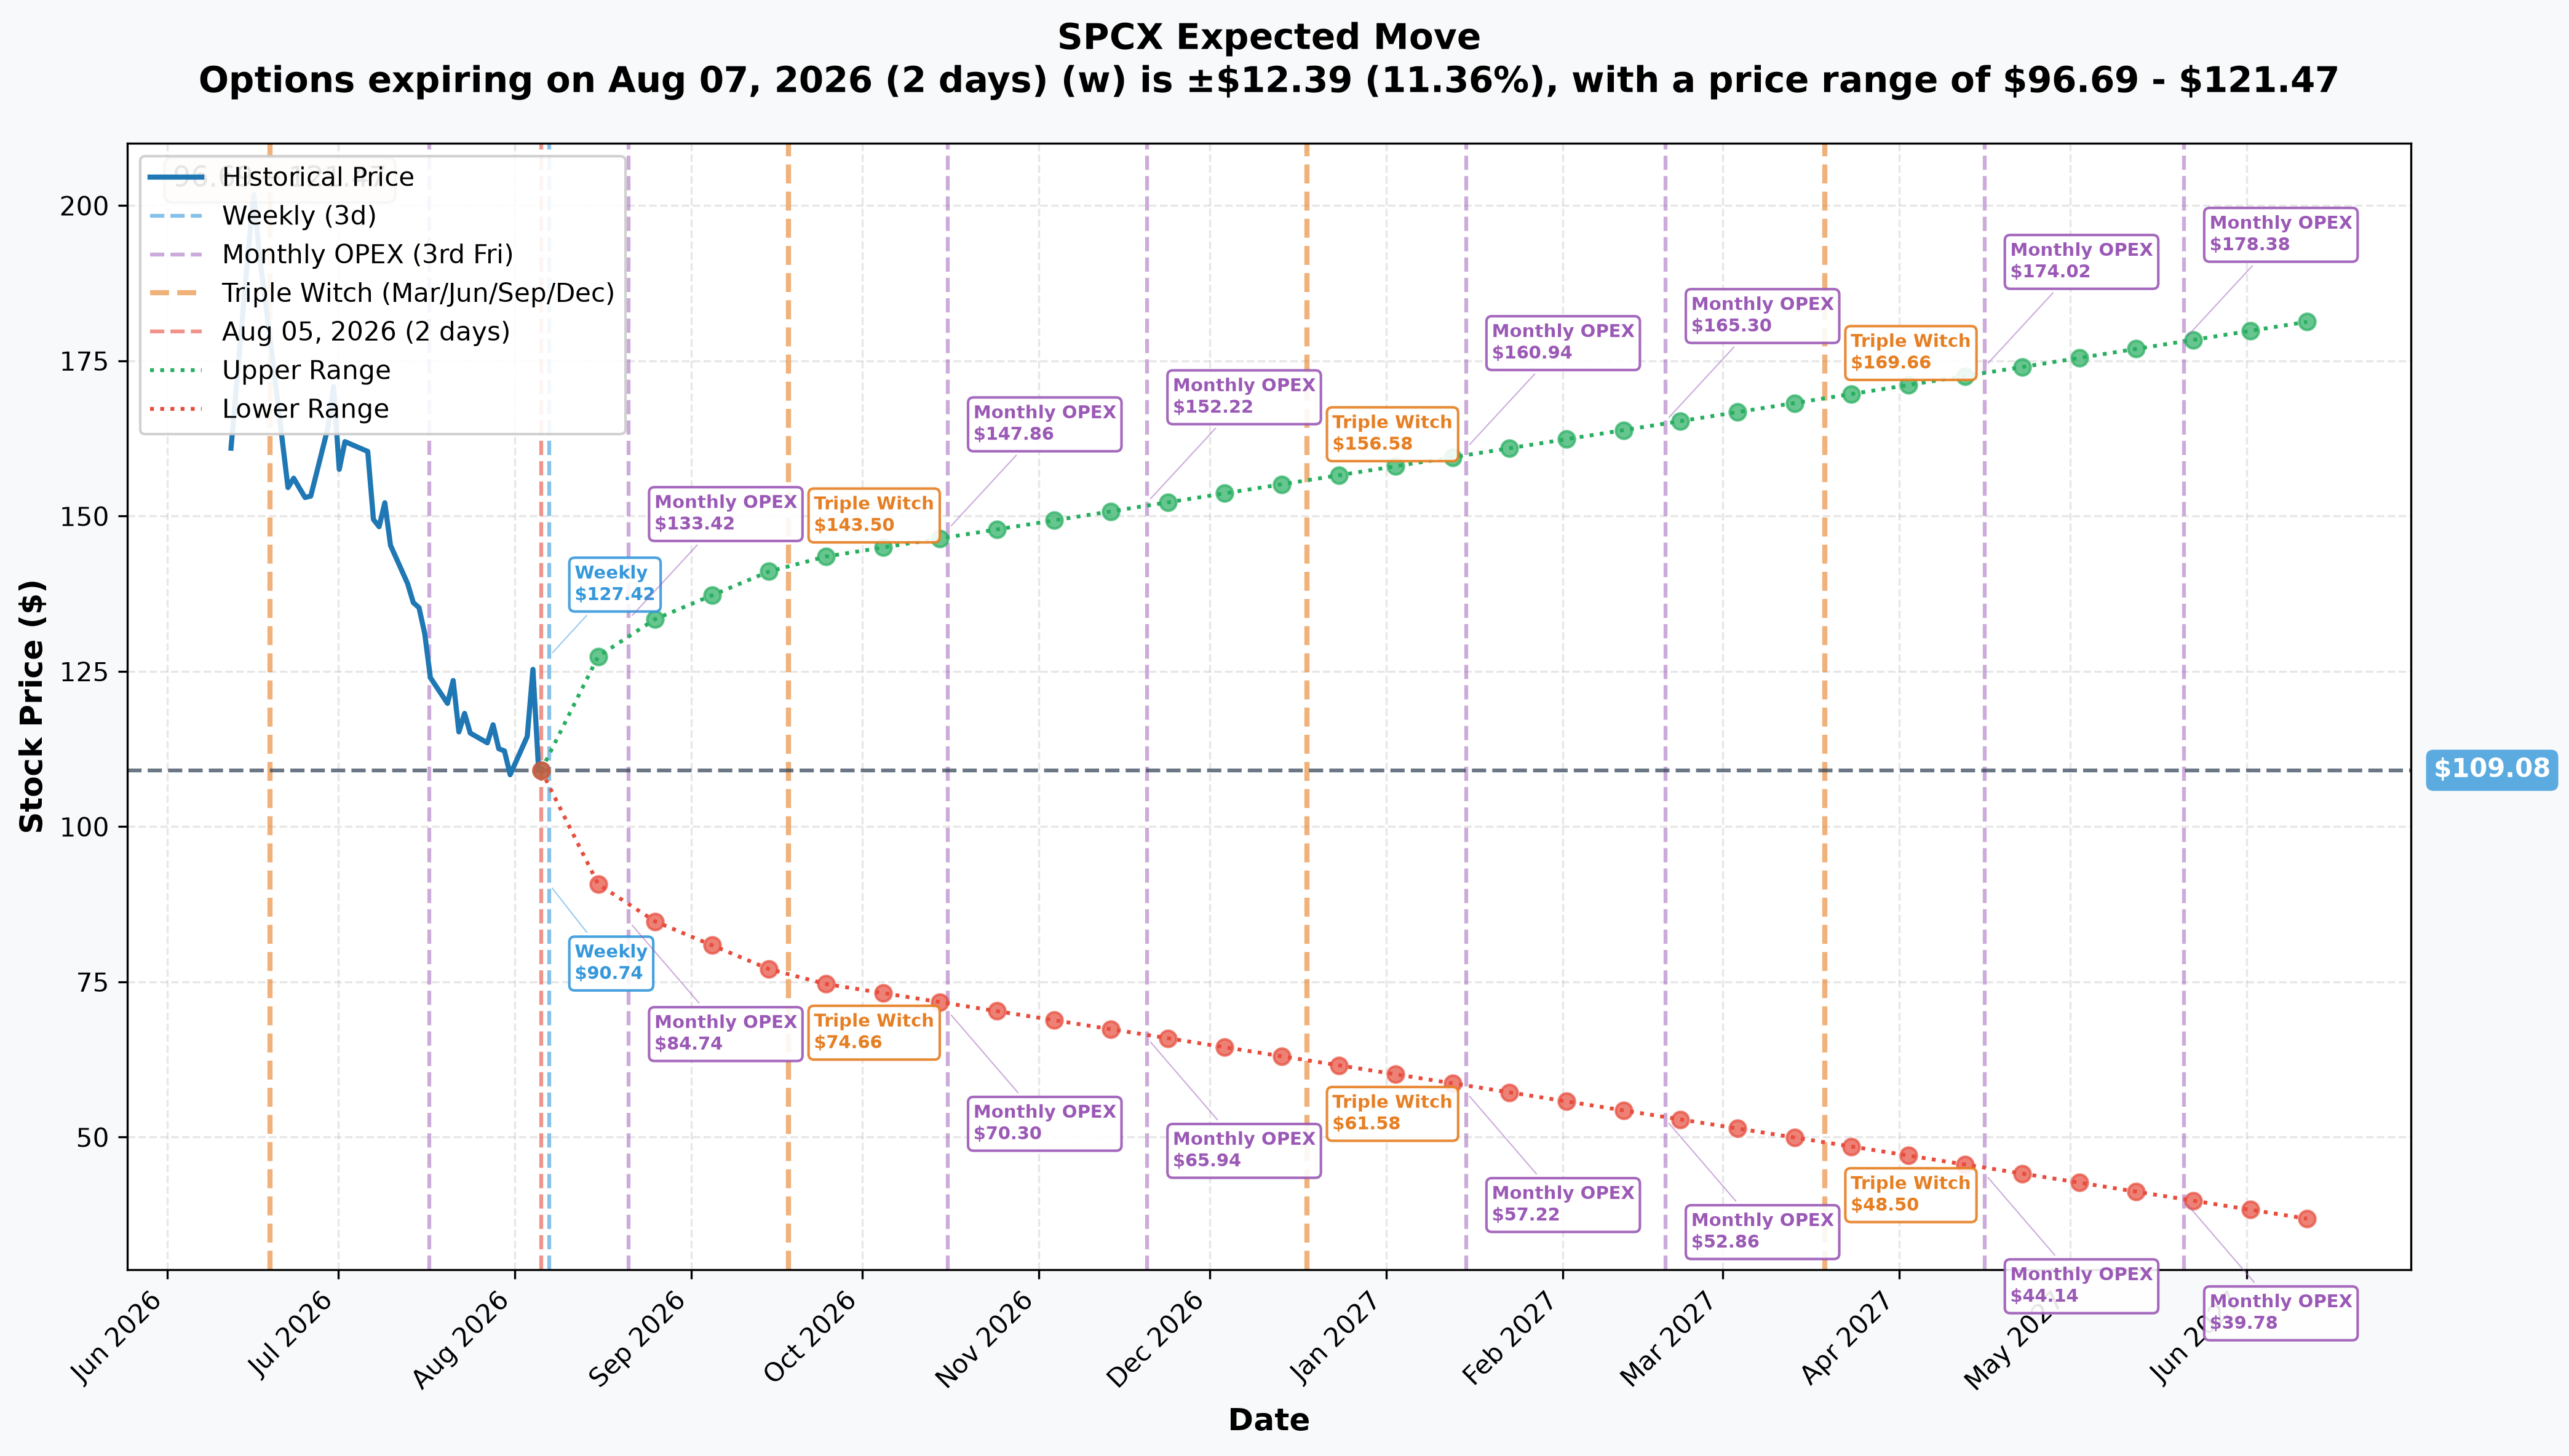
The option chain's own priced-in range, by expiration:
- Weekly (August 7, 2026, 2 days out): implied move ≈11.4%, or ≈$12.39, range $96.69–$121.47. That's an unusually wide weekly band, reflecting the fresh earnings shock and short time-to-expiry.
- Monthly OPEX (August 21, 2026, 16 days out): implied move ≈20.9%, or ≈$22.80, range $86.28–$131.88.
- September 18, 2026 (44 days out — the exact expiration on this trade's synthetic short): implied move ≈30.8%, or ≈$33.55, putting the priced range at $75.53–$142.63.
- LEAPS (June 17, 2027, ≈316 days out): implied move ≈67.0%, or ≈$73.08, range $36.00–$182.16.
The $115 strike used in this trade sits only ≈5.4% above the current $109 spot — well inside the September 18 implied range of $75.53–$142.63. In volatility terms, this was not an aggressive, far-out-of-the-money tail bet; it's a strike close to the money relative to how wide the market itself is pricing SPCX to move over the next six-plus weeks.
🎪 Catalysts
Past (already happened):
- IPO — June 12, 2026: SpaceX priced at $135/share, ran to a ≈$200+ high in June, and has since given all of that back and more.
- Q2 2026 earnings — reported August 4, 2026: revenue of $7.8B, +92% YoY, beating the $6.81B consensus by ≈15%, per Investing.com. EPS of ($0.09) also beat estimates (MarketBeat). The stock fell ≈13% anyway — StockAnalysis attributes the drop to a "jaw-dropping AI spending jump" that spooked investors despite the top-line beat, and MarketBeat frames the post-print reaction as a "Capex Tug of War." This reads as a spending de-rating, not a demand problem — revenue beat by 15%, and the market repriced the cash-burn path instead.
- The burn is compounding: TTM net loss through June 30, 2026 was −$8,218M, versus −$4,937M for all of FY2025 — roughly 1.66x the full prior year's loss in trailing-twelve-month terms.
- Post-earnings analyst reaction (Aug 5): multiple banks maintained positive ratings; Cantor Fitzgerald set a $246 target and UBS $210, per Investing.com. Retail investors reportedly "continued buying after the sharp post-earnings drop, attracted to lower price levels" (Investing.com).
Upcoming:
- IPO lock-up expiration — near-term, high impact, date NOT confirmed. Press coverage on August 5, 2026 flagged that "early investors and employees" face the opportunity to sell as lock-up restrictions expire (Investing.com), but no exact date was published in that coverage. We are deliberately not publishing a specific date here — treat this as a live, dated-but-unconfirmed overhang, not a scheduled event you can mark on a calendar yet.
- Q3 2026 earnings — ESTIMATED early-to-mid November 2026, not company-confirmed. No source publishes a forward date; this window is inferred purely from a normal one-quarter cadence off the August 4 print. This trade's September 18 expiration lands before that estimated window, so it does not own a confirmed earnings event.
- Consensus targets the stock has to grow into: FY2026 consensus calls for $39.12B revenue (+109.5% vs. 2025) and $0.20 EPS — against a TTM EPS of −$2.52. That is a large required inflection, and the September 18 expiration on this trade sits well before Q3 results would test it.
🎲 Price Targets & Probabilities
- Where the trade sits: the $115 strike is ≈5.4% above the $109 area spot, inside the September 18 implied-move range of $75.53–$142.63 and just past the "Very Strong" $115 gamma resistance level noted above.
- Bull case: a move back toward the $120 gamma Resistance Wall (≈10.0% above spot) or beyond — this would put the short call leg of the package deep in the money and under real pressure if it's not covered by stock.
- Base case: the stock chops inside the dense gamma zone between the $110 and $115 resistance levels and the $105–$109 support cluster — a range the September 18 implied move (±30.8%) comfortably contains on both sides.
- Bear case: a slide toward the $100 Support Wall (≈8.3% below spot) or the $105 "Very Strong" support (≈3.8% below spot) — both inside the September 18 expiration's priced range, and both would make this credit package profitable if the short-side reading is correct.
- The honest wildcard: sell-side targets range from $62 to $800 — a ≈13x spread across 35 covering analysts, with an average of $227.76 (StockAnalysis forecast). That dispersion means the Street itself has no shared model for this stock yet. Use the gamma and implied-move levels above for near-term structure; treat the analyst target range as evidence of long-run uncertainty, not a near-term price plan.
💡 Trading Ideas — Four Ways to Read This
🚀 YOLO / Aggressive
Replicating this exact package (short the $115 call, buy the $115 put, September 18) means collecting a credit while betting SPCX finishes below roughly $115 net of that credit. Do this only naked if you're comfortable with genuinely uncapped loss on the call side if SPCX rips back toward its $200+ June high — this is not a small-risk trade.
⚖️ Swing Trader
Rather than the full synthetic short, a defined-risk bearish alternative — a put debit spread (long a higher put, short a lower one) into the September 18 expiration — captures a similar directional lean without the uncapped upside risk a naked short call carries, at the cost of giving up some of the credit.
🛡️ Premium-Collector
If you already hold SPCX shares from around the IPO and are worried about a lock-up-driven supply event, this exact structure — short call, long put, same strike, same expiration — is the "conversion" hedge described above: it locks in an effective sale price near $115 while you decide what to do with the underlying position, without actually selling the stock today.
📚 Beginner
This is a good example of why "BUY" and "SELL" tags alone don't tell the whole story. Two legs printed together, at the same strike, same expiration, same size, as one negotiated cross — and the combination (short call + long put) behaves like a bet the stock goes down, or like a hedge on stock someone already owns. The tape proves the structure; it cannot prove the motive.
⚠️ Risk Factors & Honest Limits
- We cannot tell hedge from bet. This is the central limitation of this trade: OPRA's options tape shows two option legs crossed together, not any equity position sitting behind them. A conversion (hedge on existing stock) and a standalone bearish bet look identical on this tape.
- The put leg's open/close is now RESOLVED as opening. Open interest rose 10,873 → 21,473 (+10,600) against a 7,500-lot print, ruling out the buy-to-close alternative. The day-of caveat was correct at the time and has been settled by the data.
- Both strikes saw far more opening than this package alone. Day volume was ≈2.4× the package size at each leg, so the $115 line attracted broader positioning on August 5 — this cross is confirmed new, but it is not the only thing that happened there.
- If this is naked (no stock behind it), the short call carries uncapped loss potential. SPCX has already shown it can move violently — from a $135 IPO to a $200+ high to a $104.83 low in under two months. A naked short call into that kind of volatility is a genuinely large risk, not a small one.
- SPCX has almost no trading history. Roughly eight weeks of data means there is no multi-year support/resistance structure, no seasoned realized-volatility record, and no long track record of how the stock behaves around earnings or lock-up events. Every technical level in this article is drawn from a very short, very volatile sample.
- Analyst target dispersion ($62–$800) is itself a risk signal, not just a bull-case data point — it means the professional consensus genuinely disagrees about this company's value by more than an order of magnitude.
- What the tape cannot tell us: who is on the other side of this cross, their cost basis, whether there's a stock or futures hedge attached elsewhere, their exact time horizon, or the exact lock-up expiration date.
- This is a real-money trade discussion, not investment advice — size and risk any position around your own account and risk tolerance, not around someone else's $20M-notional cross.
🎯 The Bottom Line
Real talk: someone crossed a 7,500-lot short call against a 7,500-lot long put on SPCX, same strike ($115), same expiration (September 18), for a $1,612,500 net credit — a textbook synthetic short. Both legs are now confirmed opening by the next-day open interest, so this is a cleanly-built new position rather than an unwind dressed up as one. What we genuinely cannot tell from the tape is whether it locks in a sale price on stock someone already owns from the June 12 IPO — a conversion, ahead of a lock-up expiration whose exact date isn't yet confirmed — or whether it's a standalone bet that a stock already down ≈13% on the week keeps sliding.
What to watch now: any confirmed date on SpaceX's lock-up expiration, which remains the single biggest scheduled overhang on this name.
This article is for informational purposes only and does not constitute investment advice. Options trading involves substantial risk of loss and is not suitable for all investors. Always do your own research and consult a licensed financial advisor before trading.
Last updated: 2026-08-06 (pre-market) — next-day OPRA open interest confirmed both legs as opening (call 3,034 → 16,078; put 10,873 → 21,473), resolving the provisional put leg in favour of a new long put and confirming a clean synthetic short.