🎪 SPHR $6.85M Short Call Package — and the "Long" November Leg Turned Out to Be Half a Close
📅 August 10, 2026 | 🔥 Unusual Activity Detected
🔄 Updated 2026-08-11 pre-market — the next-day OPRA open interest resolved both legs, and the long leg inverted. The February 2027 $180 short calls opened exactly as predicted (2 → 9,101 against a 9,100-lot sale). The November $150 "long" leg did not open: open interest fell 3,986 → 1,978 (−2,008), where a fresh open would have pushed it toward ≈7,947. Roughly half that print retired existing longs. Measured by surviving open interest, the package is more lopsided than the 2.3-to-1 ratio described below — closer to 4.6-to-1 short-to-long. See the ✅ RESOLVED box.
🎯 The Quick Take
At 15:24:45 today, with Sphere Entertainment (SPHR) trading at $162.40, a desk printed a three-leg call diagonal: bought 3,961 in-the-money November $150 calls, and sold 9,100 further-out, further-strike February 2027 $180 calls — collecting ≈$6.85M net credit. The whole package printed as a multi-leg auction (exposed for price improvement, not a negotiated block cross, no urgency involved). The eye-catching detail: they sold more than twice as many calls as they bought, which changes the risk math from a simple diagonal into something closer to a ratio spread. SPHR is up ≈72.9% year to date, which explains the large dollar premium collected — but as we'll show below, it does not mean these calls were volatility-rich. On a like-for-like basis, SPHR's implied volatility is actually running below its own realized volatility, which makes selling 9,100 of them a less comfortable trade than the headline credit suggests.
📊 Company Overview
Sphere Entertainment Co. (NYSE: SPHR) reports in two segments:
- Sphere segment — operates Sphere Las Vegas, the 20,000-capacity venue at The Venetian, drawing revenue from the Sphere Experience film productions (The Wizard of Oz at Sphere), third-party concert residencies, and the Exosphere exterior LED advertising surface. Sphere Studios is the in-house content arm producing Oz and the upcoming Rocky Horror Picture Show at Sphere. This segment also carries the venue-development pipeline — Sphere Abu Dhabi and the proposed Sphere at National Harbor, Maryland. Q2 2026 segment revenue was $226.4M, +29% year over year.
- MSG Networks segment — the regional sports network carrying New York Knicks and Rangers games, structurally declining: Q2 2026 revenue $87.3M, −18% year over year, subscribers down 16.5%.
Market cap: ≈$5.85–5.87 billion. Sector: Communication Services, Entertainment industry (Movies & Entertainment sub-industry). Only the Class A shares trade as SPHR — roughly 29.05 million of 35.91 million total shares; the Dolan family controls ≈70–72% of voting power via 10-vote Class B shares. Short interest is heavy — ≈24.4% of the tradable float, with only ≈300,000 shares left to borrow — a structural source of upside call demand in this name.
Fiscal-calendar note that matters for this trade: Sphere no longer runs a June fiscal year. The board moved the fiscal year-end to December 31, effective December 31, 2024, so fiscal quarters now line up 1:1 with calendar quarters — Q3 2026 covers the quarter ending September 30, and Q4/FY2026 covers the quarter ending December 31.
💰 The Option Flow Breakdown
📊 What Just Happened — All Three Legs, 15:24:45, Spot $162.40
| Time | Buy/Sell | Call/Put | Expiration | Premium | Strike | Volume | OI | Size | Spot | Option Price | Option Symbol | Order Type | Strategy |
|---|---|---|---|---|---|---|---|---|---|---|---|---|---|
| 15:24:45 | BUY | CALL | 2026-11-20 | ≈$10.69M | $150 | 4,000 | 3,986 | 3,961 | $162.40 | $27.00 | SPHR20261120C150 | 🔄 BTC (resolved CLOSE — was BTO ⏳) | Call Diagonal (long Nov $150 / short Feb $180) |
| 15:24:45 | SELL | CALL | 2027-02-19 | ≈$16.01M | $180 | 8,300 | 2 | 8,300 | $162.40 | $19.29 | SPHR20270219C180 | STO | Call Diagonal (long Nov $150 / short Feb $180) |
| 15:24:45 | SELL | CALL | 2027-02-19 | ≈$1.54M | $180 | 9,100 | 2 | 800 | $162.40 | $19.30 | SPHR20270219C180 | STO | Call Diagonal (long Nov $150 / short Feb $180) |
Totals: Bought 3,961 Nov $150 calls for ≈$10.69M. Sold 9,100 Feb 2027 $180 calls (8,300 + 800, both at essentially the same $19.29–$19.30 print) for ≈$17.55M. Net ≈$6.85M credit collected. This printed as a multi-leg auction — the order was exposed on the exchange for price improvement and matched electronically. That's a facilitated combo, not a negotiated block cross and not a lit sweep — no aggression, no known-counterparty story to tell, just a worked complex order.
✅ RESOLVED — The Short Leg Opened Exactly as Predicted; the "Long" Leg Was Half a Close
Updated 2026-08-11 pre-market. Resolving OPRA snapshot timestamped August 11 (reflects the August 10 close); baseline is the August 10 snapshot (reflects August 7 — before this print).
| Leg | Baseline (Aug-10) | Resolving (Aug-11) | Δ | Print size | Δ as % | Day vol | Our published prediction | Verdict |
|---|---|---|---|---|---|---|---|---|
| Feb-19-2027 $180 call (sold) | 2 | 9,101 | +9,099 | 9,100 | +100.0% | 9,151 | "jump from 2 to roughly 9,102" | ✅ OPEN (STO) — exact |
| Nov-20 $150 call (bought) | 3,986 | 1,978 | −2,008 | 3,961 | −50.7% | 3,962 | ≈7,947 if opening; falls if closing | 🔄 CLOSE — was BTO ⏳ |
The February short leg is exact. Open interest went from 2 to 9,101 against a 9,100-lot sale — one contract off our published figure. That short call position is unambiguously new, and it is the dominant risk in this package.
The November leg resolved on the closing side, and that makes the structure more exposed, not less. We flagged this as the closest miss the size-versus-open-interest test produces (3,961 traded against 3,986 outstanding — a 25-contract margin) and named both branches. Open interest fell 2,008, roughly half the print size, where a fresh open would have pushed it toward ≈7,947.
Why this matters for the risk math. The article below describes a diagonal in which 3,961 long November calls sit underneath 9,100 short February calls, covering ≈43% of them. On net, those long calls were not created on August 10 — about half the print retired existing longs and the rest transferred between holders. Net long open interest at the November $150 strike halved, from 3,986 to 1,978. So whatever cushion the November leg provides is smaller than the trade-day tape suggested, and the "2.3-to-1 short-to-long ratio" understates the imbalance: measured by surviving open interest, there are now 9,101 short February calls against 1,978 long November calls — a ratio closer to 4.6-to-1, and the November cover still disappears at expiration on November 20.
One honest caveat on that inference: open interest is a market-wide total, not this desk's position. We can prove that November $150 long interest fell by half; we cannot prove the buyer in this specific package is the one who ended up with less. The structural point stands regardless — the long side of this strike shrank on the day the short side was created.
🤓 What This Actually Means — Plain English
A call diagonal is when you own a call at one strike/expiration and sell a call at a higher strike, further out in time. Here: long the Nov $150 call (already $12.40 in the money), short the Feb 2027 $180 call (≈$10.80 out of the money, and roughly six months further out). The short leg's extra time and extra distance from the money is what generates the fat premium ($19.29 vs the long leg's $27.00) that funds most of the trade and leaves a net credit.
But this is not a clean 1-for-1 diagonal — and that's the important part. They sold 9,100 Feb calls against only 3,961 Nov calls bought — a ratio of about 2.3-to-1. That leaves ≈5,139 of the short February calls with no long call underneath them at all. In a standard 1:1 diagonal, the long call caps your risk on the short call while both are alive. Here, only about 43% of the short position has that cushion; the rest is effectively a naked short call position from the start.
Two things happen on November 20, when the long leg expires:
- Through November 20, the position behaves like a partial diagonal — the ITM long call absorbs some of the stock's upside move, offsetting some of the loss on the short calls if SPHR rallies.
- After November 20, the long leg is gone. Whatever wasn't rolled or closed leaves the trader flat-out short 9,100 Feb $180 calls with zero offsetting long calls — full, uncapped-style exposure to SPHR above $180 for the remaining ≈3 months into February 19, 2027.
We do not have the Greeks on this trade, so we can't say precisely whether the package nets long or short delta today — that depends on the exact deltas of a deep-ITM Nov $150 call versus an OTM Feb $180 call, which we were not given. What we can say for certain from the structure alone is the asymmetry: this desk is short more than twice as many calls as it is long, and that excess only grows more exposed once the near leg rolls off.
Why would someone do this? A few honest possibilities, and we cannot tell which is true from the tape alone:
- Financing — selling back-month calls to fund (and overfund) a cheaper in-the-money long call.
- A capped-upside view — a bet that SPHR stalls below $180 through February 2027, collecting the credit as the short calls decay.
- An overlay on an existing stock position — someone who already owns SPHR shares using the short calls as an income strategy, with the Nov $150 calls as a smaller, separate directional bet.
One correction to the obvious-sounding story — the data actually argues against it. It's tempting to assume the seller is "harvesting rich premium" because SPHR is up ≈72.9% year to date. That's not quite right. SPHR's implied volatility sits at 52.55% — high in absolute terms, which is why the dollar premiums here are large — but that's only the 29.81st percentile of SPHR's own one-year IV range, and it is running below the stock's own 30-day realized volatility of 56.78%. On a vol-versus-vol basis, these options are arguably cheap relative to how much SPHR actually moves, not expensive. The big dollar figures come from a $162 stock with 55-handle realized volatility, not from an inflated risk premium — which means selling 9,100 calls into this name is a genuinely less comfortable trade than the ≈$6.85M headline credit makes it look. (We could not verify whether Feb 2027-specific implied vol is priced any differently than this blended reading — that's a real gap, noted again in the limits section.)
📈 Technical Setup / Chart Check-Up
YTD Chart
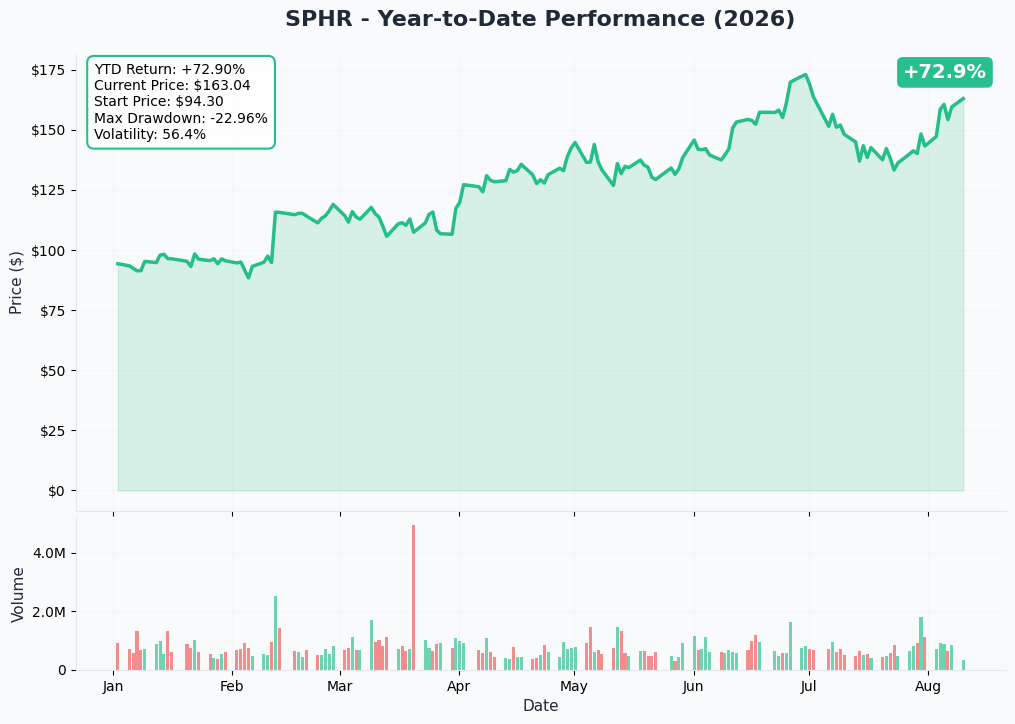
SPHR has been on a wild run — up ≈72.9% year to date, and per the company's own investor materials up ≈302% over the trailing 52 weeks, off a 52-week low of $37.89 against a 52-week high of $174.60. It made its high of $173.03 on June 30, sold off to $147.29 by August 3, and has since recovered to ≈$162 — a ≈15% drawdown and ≈10% recovery inside six weeks. That chop, on top of the longer uptrend, is the backdrop for today's diagonal.
Gamma-Based Support & Resistance — Honestly Thin Data Today
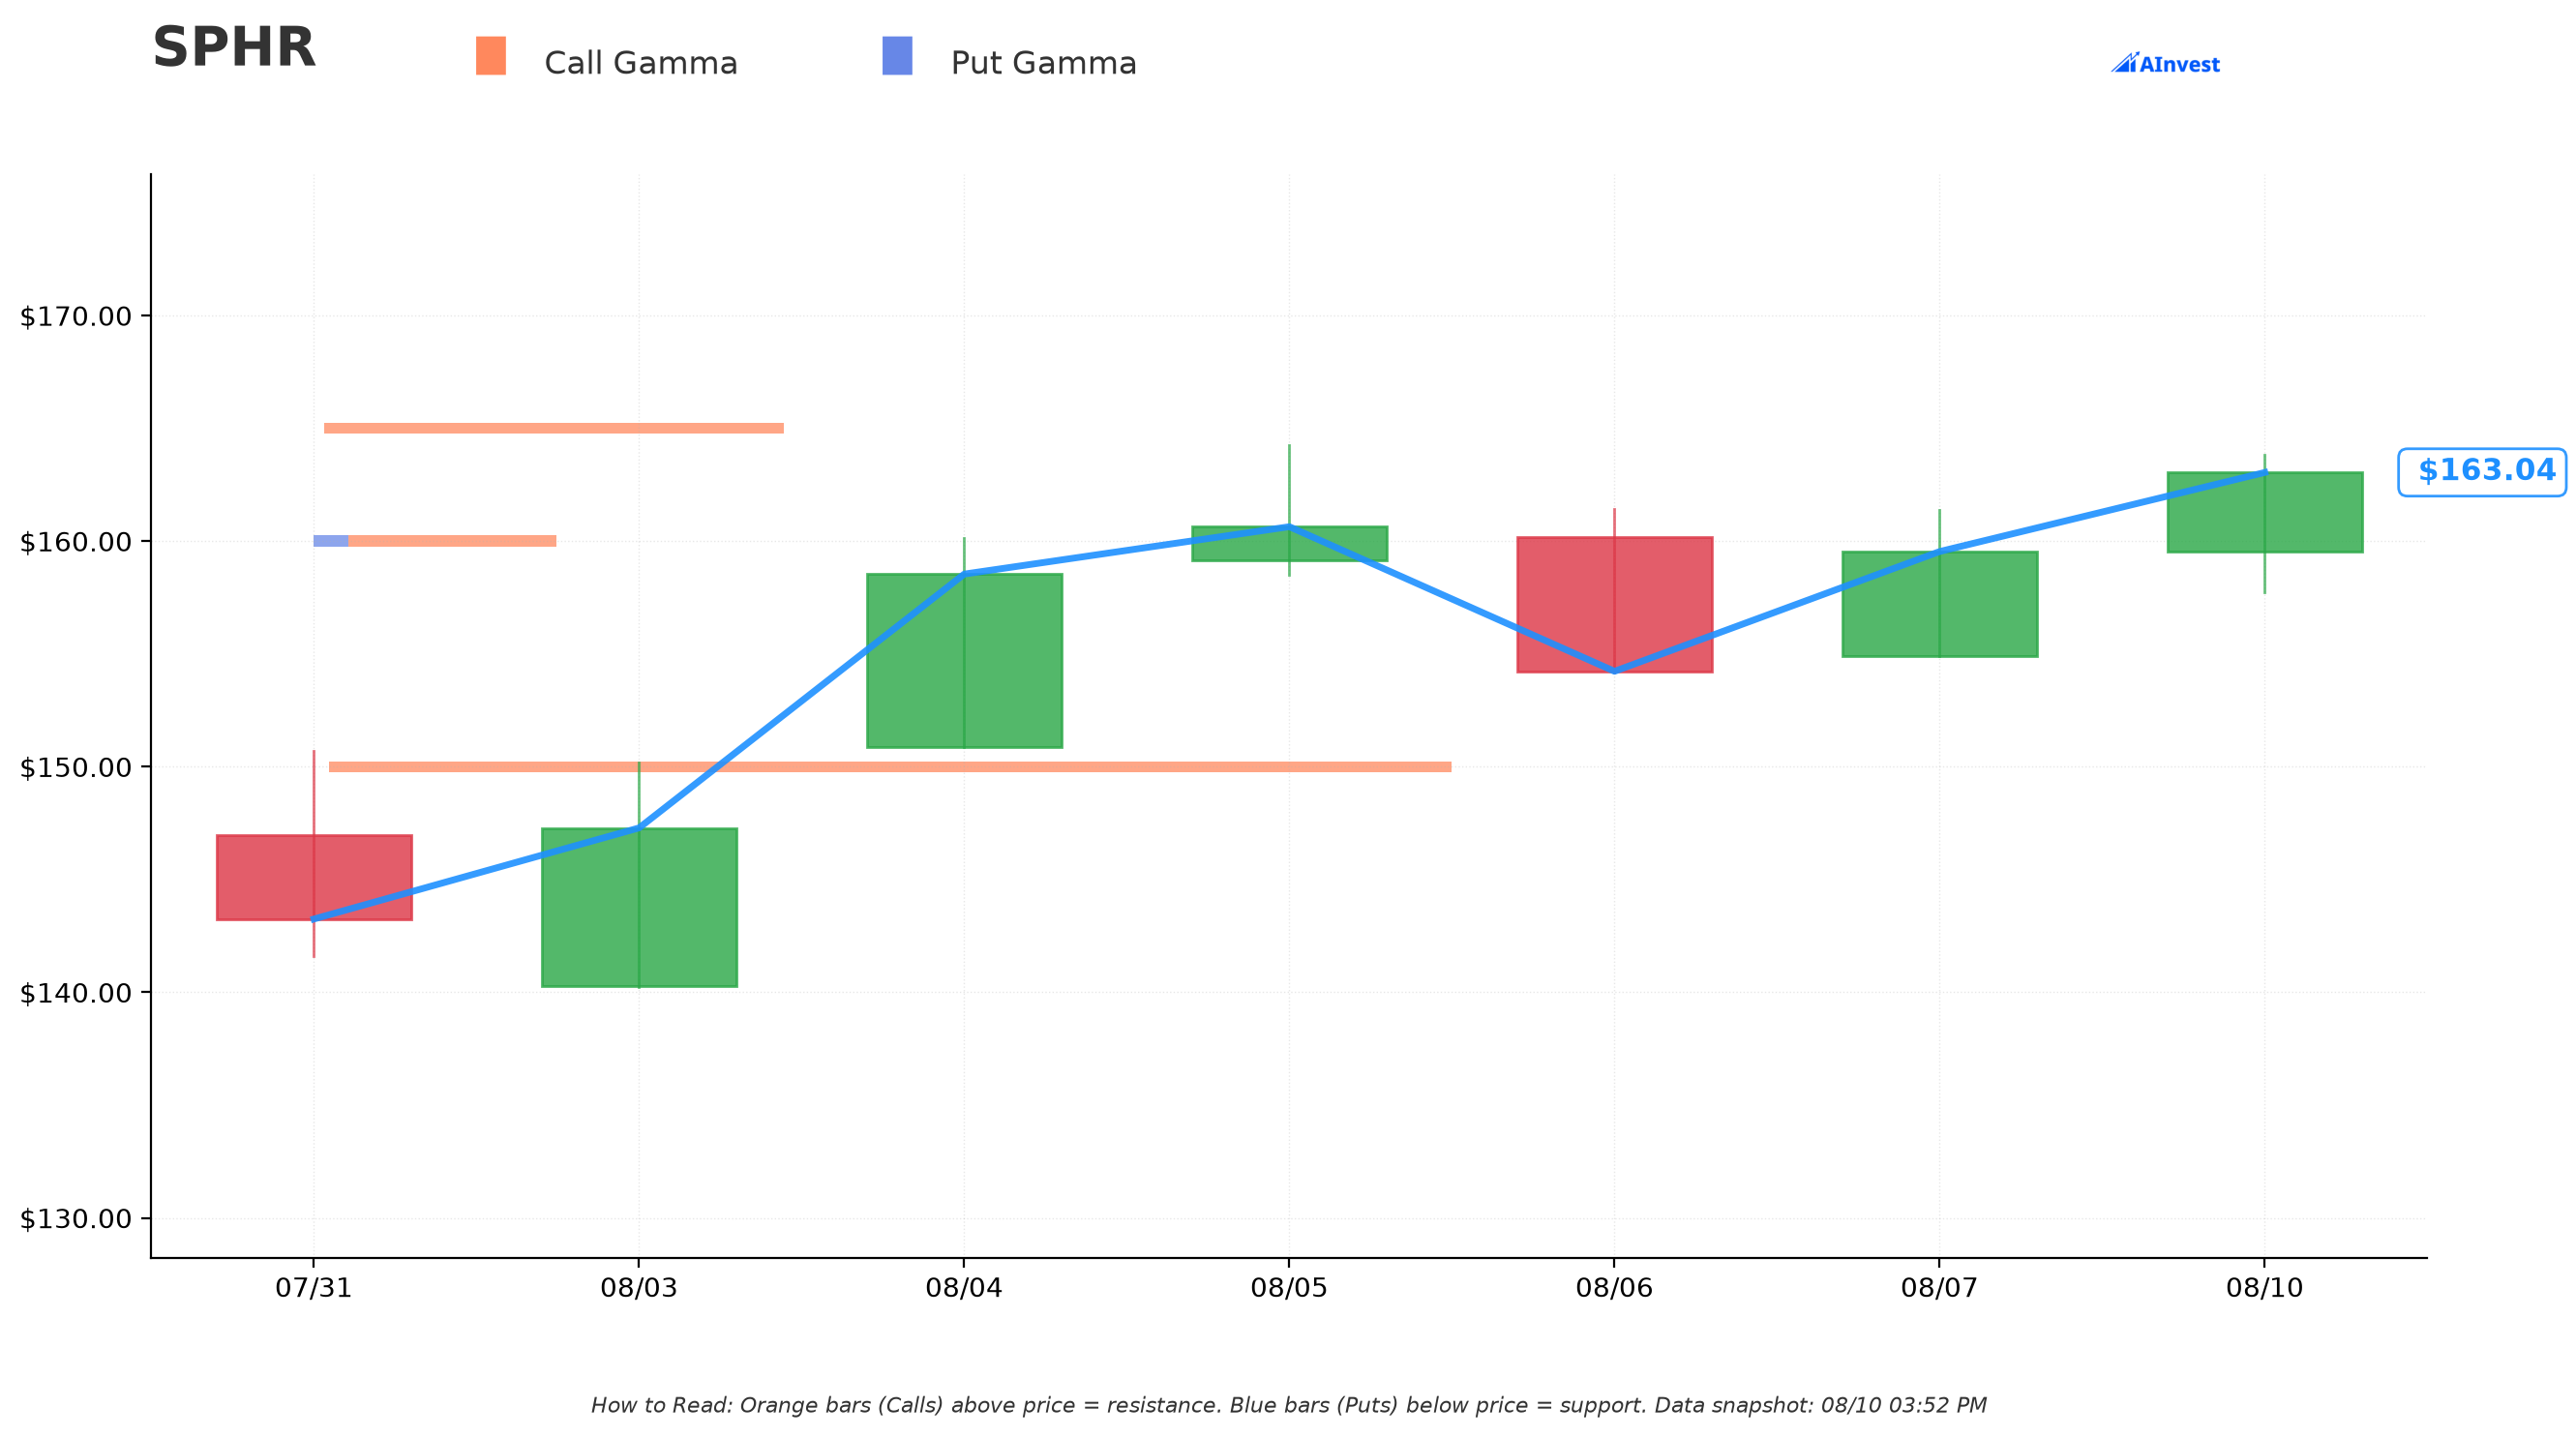
We have to be upfront: today's gamma file for SPHR only carries four strikes — $150, $160, $165, and $180 — with no computed support/resistance zone list or gamma-wall flags coming back. That is nowhere near enough coverage for a full SpotGamma-style wall map on this name, so treat what follows as a rough sketch, not a confident level-by-level read. Current reference price in the file: $163.04.
The four strikes, by total gamma concentration:
- $150 — by far the largest total gamma reading (≈0.65 in the file's units), almost entirely call-side (≈0.64 call vs ≈0.01 put). This sits ≈8.0% below spot — and it's also exactly where today's long Nov call was bought.
- $165 — second-largest (≈0.27 total), again almost all call gamma, sitting ≈1.2% above spot.
- $180 — third (≈0.19 total, almost all call), ≈10.4% above spot — this is the exact strike of today's short Feb calls.
- $160 — smallest of the four (≈0.14 total), ≈1.9% below spot.
One honest limitation worth flagging plainly: put-side gamma is negligible at every strike we have (0.001–0.02) — there is effectively no visible downside "support" wall in this dataset at all. What we have is almost entirely a call-gamma (resistance-type) picture, and only four data points at that. Don't lean on this section for precision; it's directional color at best.
Implied Move Analysis
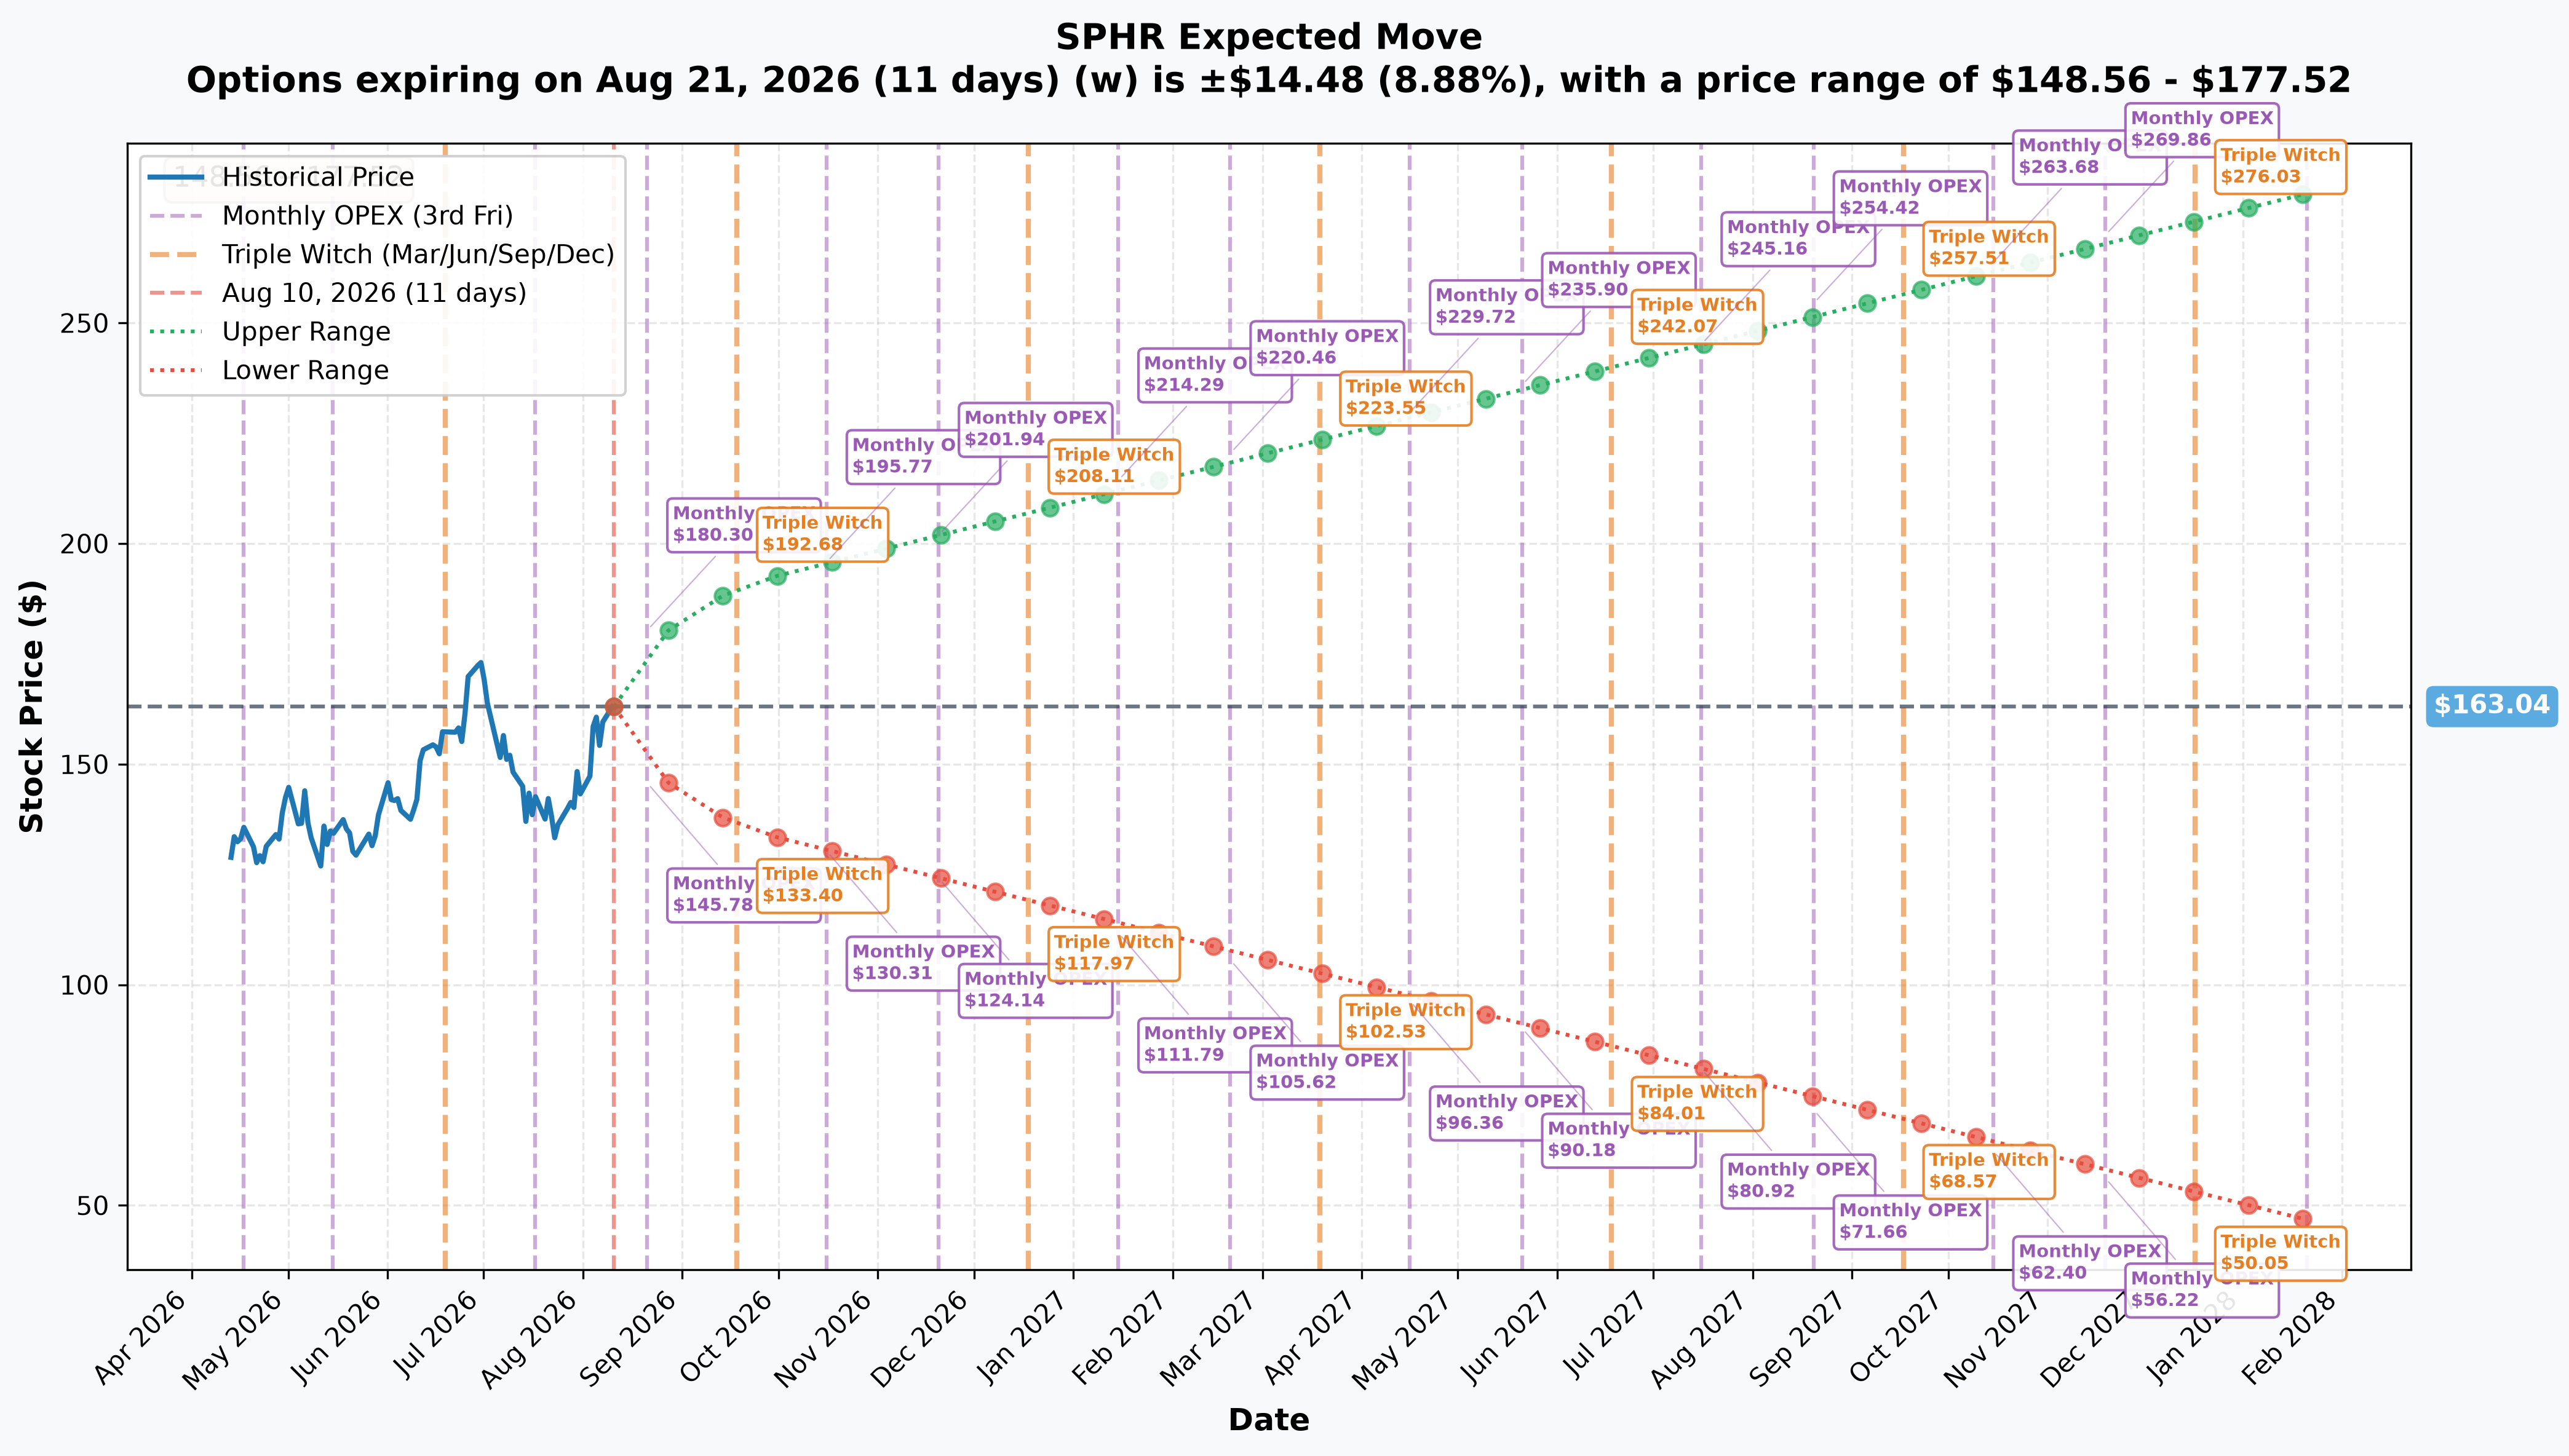
The implied-move file gives concrete ranges for both expirations in today's trade:
- Monthly OPEX (2026-08-21, 11 days out): ±8.9% (±$14.48) → range $148.56 – $177.52
- Quarterly triple witch (2026-09-18, 39 days out): ±16.8% (±$27.46) → range $135.58 – $190.50
- The Nov 20 expiration itself (long leg, 102 days out): implied range $124.14 – $201.94
- The Feb 19, 2027 expiration itself (short leg, 193 days out): implied range $105.62 – $220.46
- Yearly LEAPS reference (2028-01-21, 529 days): ±71.4% (±$116.44) → range $46.60 – $279.48
Translation: the options market is already pricing a plausible path to $201.94 by November 20 — comfortably above both the $150 long strike and even the $180 short strike — and a plausible path to $220.46 by February 19, 2027, which is ≈22.5% above the $180 short strike. That upper bound is the number that matters most for anyone thinking about mirroring the short side of this trade: the market itself assigns real odds to SPHR landing well above where these calls were sold.
🎪 Catalysts
Every date below is a company event date, NOT an option expiration date. The two expirations in this trade are 2026-11-20 (long leg) and 2027-02-19 (short leg).
Window A — before the November 20 expiration (both legs alive)
| Date | Event | Status |
|---|---|---|
| September 2026 (day not published) | Wizard of Oz 2.0 launch — new ride experience, witch character, flying monkeys (CDC Gaming) | Month confirmed, day TBD |
| 2026-10-01 | Metallica "Life Burns Faster" residency opens, 24 shows through March 2027 | Confirmed |
| ≈Nov 3–10, 2026 | Q3 2026 earnings — Zacks and AlphaQuery estimate Nov 3; TipRanks estimates Nov 10; prior-year comparable was Nov 4, 2025 | ESTIMATED — not company-confirmed, but sits comfortably 10–17 days before the Nov 20 expiration |
| Nov 19, 2026 | F1 Las Vegas Grand Prix race week begins (practice/qualifying) | Confirmed — but note below |
A timing subtlety worth stating precisely: the F1 Heineken Las Vegas Grand Prix race day is Saturday, November 21, 2026 — one day AFTER the November 20 expiration of the long call. Race-week anticipation is inside the window; the race itself is not.
Window B — between the two expirations (only the short Feb $180 calls are still alive — the exposed stretch)
| Date | Event | Status |
|---|---|---|
| 2026-11-21 | F1 Las Vegas GP race day | 1 day after the Nov 20 expiration |
| 2026-12-31 | FY2026 fiscal year end | Confirmed |
| Jan–Feb 2027 | Metallica residency second leg | Confirmed |
| ≈Feb 8–18, 2027 | Q4/FY2026 earnings — no data provider has published even an estimate; the only anchor is the prior-year comparable, Feb 12, 2026 | ESTIMATED, genuinely uncertain — a one-to-two-week slip would push it past the Feb 19 expiration entirely |
| "2026 or early 2027" | Management's own stated target on the Q2 2026 call to announce an additional Sphere venue, following the Abu Dhabi template ($1.7B of third-party capital, no cost to Sphere) | Unscheduled, undated, high-magnitude — could land anywhere in Window A or B |
Net read: exactly one earnings report (Q3 2026) sits comfortably inside the November leg's life. A second earnings report (Q4/FY2026) sits near the February leg's expiration but with a thin, unconfirmed buffer — it could easily land after Feb 19 instead of before it. And the single biggest wildcard — an undated new-venue announcement — sits specifically in the stretch where the trader is naked short the Feb $180 calls with no long-call cushion.
🎲 Price Targets & Probabilities
Using the implied-move ranges and gamma concentrations above, here's how the two legs frame out:
- Base case: SPHR chops between the Nov 20 implied range of $124.14–$201.94 through the fall, absorbing Oz 2.0, Metallica, and the estimated Q3 print. The Nov $150 long call stays in the money and is worth exercising, closing, or rolling before expiration.
- Bull case: SPHR pushes toward or through $180 before Feb 19, 2027 — well within the Feb window's own implied upper bound of $220.46. This is exactly the scenario that hurts the short side of this diagonal, especially the ≈5,139 excess short calls that have no long-call cushion once November rolls off.
- Bear case: SPHR gives back some of its 72.9% YTD gain and both legs simply decay — the short Feb $180 calls expire worthless (good for the seller), but the Nov $150 long call also loses value if SPHR drops back toward or below $150.
💡 Four-Reader Interpretation
🚀 YOLO Trader
There isn't much of a YOLO angle in copying this exact structure — it's a credit-collecting overlay, not a lottery ticket. If you want the directional exposure this desk is expressing on the front end, the closest single-leg mirror is the Nov $150 call itself, already $12.40 in the money — but understand you'd be buying it standalone, without the ≈$6.85M in credit this desk collected to subsidize it. Mirroring the short Feb $180 calls without owning the stock or an offsetting long call means taking on real, sizable obligation risk on a name that's up ≈73% this year — that is not a YOLO play, it's the opposite.
📈 Swing Trader
The interesting window here is the front leg's life — now through November 20. Between the estimated Q3 earnings (≈Nov 3–10), the Oz 2.0 launch, and the Metallica residency opening October 1, there's a real catalyst stack inside 102 days, and the implied range ($124.14–$201.94) gives a workable band to trade around. A swing trader could track the $150 and $165 strikes — both carry the largest call-gamma readings in today's (thin) gamma file — as reference points, while being mindful that F1 race day itself lands one day after the Nov 20 expiration, not inside it.
💰 Premium Collector
This is the natural home for a premium-collection read — but be blunt about it: being short 9,100 calls on a stock up ≈73% year to date is a genuine obligation, not free income, and the setup here is unusually uncomfortable. Two separate reasons: first, ≈24.4% of SPHR's tradable float is sold short, against only ≈300,000 shares left to borrow — if that short base gets squeezed, being short calls is exactly the wrong place to stand, because a squeeze rally forces call sellers to chase stock or buy back at a loss into the move. Second, as shown above, implied volatility here (52.55%) is actually running below realized volatility (56.78%) — you are not even being paid a rich premium for that squeeze risk, on a vol-adjusted basis. The Feb window's own implied upper bound is $220.46 — ≈22.5% above the $180 strike — which means the market assigns real odds to these calls landing meaningfully in the money, and management has publicly flagged an undated "another Sphere venue" announcement landing "in 2026 or early 2027" that sits squarely in this short call's exposed window. Roughly 5,139 of the 9,100 sold calls have no long-call cushion at all once the November leg rolls off. If you're drawn to selling calls on SPHR the way this desk did, do it with a plan for what happens after November 20 — a defined ratio, a stock hedge, or a firm intent to roll — not as a "collect the credit and forget it" trade.
🌱 Beginner
A call diagonal just means: own a call, sell a different call against it that's further out in both strike and time, and collect (or pay) the difference. Here the desk collected a net credit because the sold leg ($19.29–$19.30) was worth more in total than the bought leg ($27.00) once you account for how many more contracts they sold. The part to notice as a beginner: they sold more than twice as many calls as they bought (9,100 vs 3,961) — that ratio is what turns a "capped risk" diagonal into something with real, less-capped risk on the extra short contracts. This is not a starter structure to copy directly; if you're new to options, it's worth studying rather than replicating, and definitely worth understanding fully — including what happens to the uncovered portion after the near leg expires — before ever selling calls you can't cover.
⚠️ Honest Limits — What the Tape Cannot Prove
- We cannot prove open vs. close on the Nov $150 leg. Size (3,961) missed prior OI (3,986) by only 25 contracts — genuinely too close to call from today's tape. Tomorrow morning's ≈06:30 ET OPRA open-interest snapshot is the only thing that resolves it.
- We cannot see the trader's Greeks or net delta. Without per-leg delta on a deep-ITM Nov $150 call versus an OTM Feb $180 call, we can't say with precision whether this package is net long, short, or flat delta today — only that the short side outnumbers the long side 2.3-to-1 in contract count.
- We cannot see broker, customer identity, order ID, or any pre-existing position (shares, other options, or otherwise) behind this trade. If the trader already owns SPHR shares, this changes from a pure options bet into a hedged overlay — OPRA data alone cannot tell us that.
- The gamma data for SPHR is thin today — only four strikes, with no support/resistance zone list computed and almost no put-side gamma at all. Treat the gamma section above as directional color, not a precise wall map.
- We could not verify the volatility term structure between the two expirations — whether Feb 2027 implied vol is genuinely richer than Nov 2026's on a like-for-like basis, only that the absolute premiums collected were larger on the back leg.
- Both earnings dates inside this trade's windows are estimates, not company-confirmed dates. Sphere has not published either the Q3 2026 or Q4/FY2026 earnings date as of today.
Disclaimer: Options trading involves substantial risk of loss and is not suitable for all investors. This analysis is for educational purposes only and is not financial advice. The structure described here — a heavily size-skewed call diagonal — carries meaningfully different risk than a simple 1-for-1 diagonal; do not assume the same risk profile without checking the ratio yourself. Always do your own research and consider a licensed financial advisor before trading.
Last updated: 2026-08-11 (pre-market) — the next-day OPRA open-interest snapshot resolved both legs. Feb-19-2027 $180C 2 → 9,101 (+9,099 against a 9,100-lot sale): OPEN (STO), one contract off the published prediction. Nov-20 $150C 3,986 → 1,978 (−2,008): CLOSE, inverting the provisional BTO label — the long leg of the diagonal was not opened, and surviving open interest leaves the package roughly 4.6-to-1 short-to-long rather than 2.3-to-1. The title, order-type cell and risk framing were updated; the ⏳ callout was replaced with the ✅ RESOLVED box.