🐋 SPY ≈$37M Put-Write — Desk Bets the S&P Holds Up Into August
📅 June 15, 2026 | 🔥 Unusual Activity Detected
✅ Updated 2026-06-16: Next-day OPRA OI confirms all three put-write legs opened cleanly — $630P +100,851, $550P +199,969, $470P +99,755 (each ≈ size sold). Fresh sell-to-open put-write confirmed; bullish-to-neutral income.
🎯 The Quick Take
At 09:56:12 this morning, a desk collected ≈$37.4M in premium selling three deep out-of-the-money SPY puts expiring August 21 — a massive, structured put-write on the largest ETF on earth. This is a bullish-to-neutral income trade: the desk pockets the cash and keeps every dollar if SPY stays above the three strike prices by August 21. All three strikes sit 16% to 38% below the ≈$754 spot price — putting them in territory that historically requires a major drawdown to threaten. With Q2 earnings season kicking off July 13 at a ≈+21.9% YoY consensus growth rate and labor markets holding firm, the base case for this trade is collecting the premium and walking away in profit on expiration day.
📊 ETF Overview
SPY — SPDR S&P 500 ETF Trust is the flagship U.S. equity ETF:
- AUM: ≈$600B+ — the largest ETF by assets in the world
- What it tracks: The S&P 500 index (≈503 companies, ≈$45T+ combined market cap)
- Sector / Structure: Broad U.S. large-cap equity; passive market-cap-weighted; top weights in Technology (≈30%), Healthcare, Financials
- Recent performance: SPY hit an all-time closing high of $759.57 on June 2, 2026 (MacroTrends), and is trading ≈$754 as of today — within ≈1% of those all-time highs. The S&P 500 has returned ≈+30% since the November 2024 election, though the past two weeks brought sharp whipsaw action tied to Israel-Iran military strikes and an oil spike
- Concentration risk: The Magnificent Seven account for ≈33.8% of the S&P 500's weight — a meaningful source of index-level volatility if any mega-cap AI name disappoints
💰 The Option Flow Breakdown
The Tape — June 15, 2026 @ 09:56:12: multi-leg auction · SELL (credit)
| Time | Side | C/P | Strike | Exp | Volume | OI | Size | Premium | Spot | OptPx | Symbol |
|---|---|---|---|---|---|---|---|---|---|---|---|
| 09:56:12 | SELL | PUT | $630 | 2026-08-21 | 100,000 | 13,000 | 99,999 | $19M | $753.94 | $1.86 | SPY20260821P630 |
| 09:56:12 | SELL | PUT | $550 | 2026-08-21 | 200,000 | 8,700 | 199,998 | $15M | $753.94 | $0.75 | SPY20260821P550 |
| 09:56:12 | SELL | PUT | $470 | 2026-08-21 | 200,000 | 14,000 | 99,999 | $3.4M | $753.94 | $0.34 | SPY20260821P470 |
Total credit collected: ≈$37.4M
Flow type: multi-leg auction — This was a facilitated, exchange price-improvement auction: a broker worked a complex three-legged order off the open lit book. This is NOT an aggressive sweep and NOT a block cross. A desk deliberately structured this at the open, with all three legs printing simultaneously at 09:56:12. The $550P and $470P legs printed at the bid — classic selling behavior. The $630P held slightly above bid. These are all fresh SELL-TO-OPEN positions (credit collected, not paid).
⏳ Come Back Tomorrow for the OI Confirmation
Next trading day ≈06:30 ET: The overnight OPRA open interest snapshot will confirm these as fresh opening short positions. All three legs show size well above prior OI — the math strongly supports these as new opens:
| Strike | Size | Prior OI | Expected OI after open |
|---|---|---|---|
| $630P | 99,999 | 13,000 | ≈112,000–113,000 |
| $550P | 199,998 | 8,700 | ≈208,000–209,000 |
| $470P | 99,999 | 14,000 | ≈113,000–114,000 |
Because size ≫ prior OI on all three legs, the tape points clearly to fresh short put positions. However, next-day OI may rise by somewhat less than the full size if some existing holders were on the other side of the auction (a transfer of existing positions). Watch the Aug-21 put OI tomorrow morning:
- OI rises close to the full sizes above → confirmed fresh opens, the full ≈$37.4M credit is new positioning
- OI rises by a meaningfully smaller amount → partial transfer; still opening positions, but the net new short may be smaller
🤓 What This Actually Means — Plain English
Let's break this down.
What is a put-write? When you sell (write) a put option, you collect a cash premium upfront and take on the obligation to buy the underlying at the strike price if it falls below that level by expiration. The seller's goal: keep the premium and never have to buy anything. It's the opposite of buying puts for protection — you're the one providing the insurance, and collecting the premium in return.
How the desk makes money: SPY is trading at ≈$754 today. The desk just collected ≈$37.4M in cash by writing:
- 100,000 contracts of the $630 puts ($19M premium, ≈16% OTM) — SPY has to fall ≈$124 before this put is even in the money
- 200,000 contracts of the $550 puts ($15M premium, ≈27% OTM) — SPY has to fall ≈$204 before this one bites
- 100,000 contracts of the $470 puts ($3.4M premium, ≈38% OTM) — SPY has to fall ≈$284 before this one is threatened
Every one of these strikes expires worthless if SPY closes above its respective strike on August 21 — and the desk keeps every dollar of the ≈$37.4M. That's the win condition. The only losing scenario is a major market drawdown.
Why three strikes instead of one? This is a tiered put-write structure. Rather than concentrating all the risk at one strike, the desk distributed ≈400,000 contracts across three deep-OTM levels. This creates a laddered exposure: if there's a modest correction (say, ≈20%), only the $630 leg becomes relevant. A bear market decline (≈27%) would threaten the $550 leg. A 2008/2020-style crash (≈38%+) would be needed to threaten the $470 leg.
This is bullish-to-neutral, not purely bullish. Selling puts does not require SPY to go up. The trade wins as long as SPY doesn't fall too far. It's an income trade — the desk's view is essentially: "The market isn't going to crash 16%+ by August 21, so we'll collect this premium and let time work for us."
Order type: STO — Sell to Open. The desk is opening new short put positions. This is the opposite of the typical "big buy" headline you see. The important number here is the $37.4M credit collected, not money at risk.
The risk to this trade: a sharp, fast decline in SPY. If something goes badly wrong — a Strait of Hormuz closure, a hawkish Fed surprise at the June 17 FOMC, a series of earnings misses in late July — the $630 puts would move toward the money. At that point, the desk either rolls the position (buying the puts back and selling new ones at a lower strike/further out) or takes a loss.
📈 Technical Setup / Chart Check-Up
YTD Performance
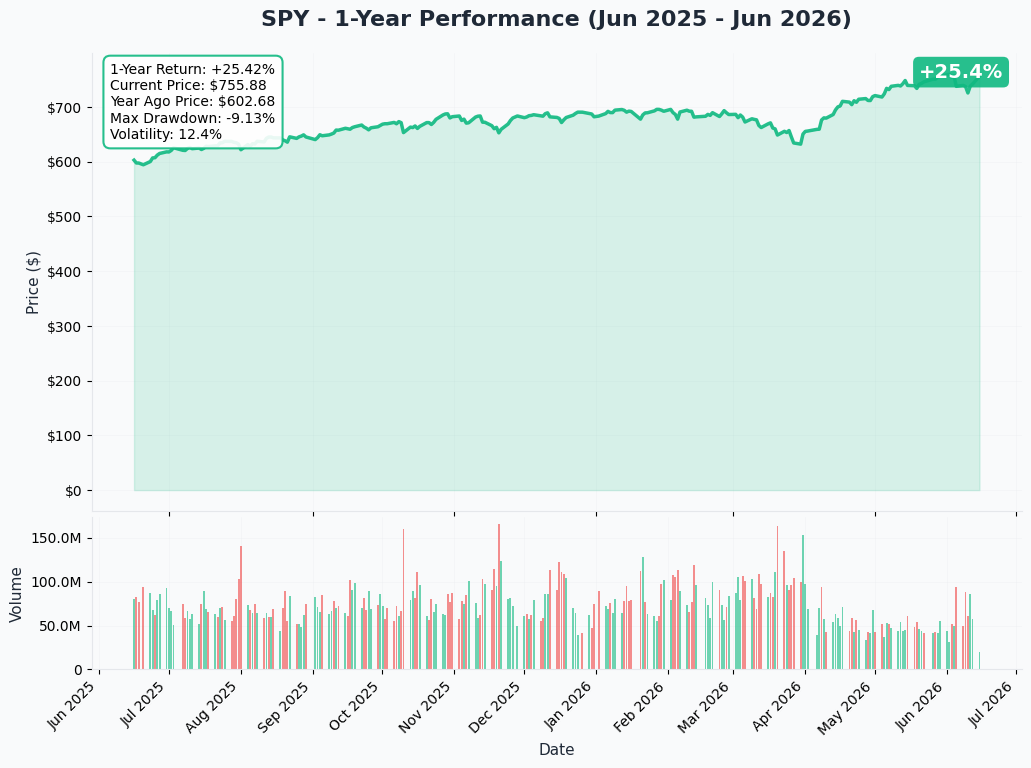
SPY has had a strong 2026 overall, with the index touching all-time highs of $759.57 on June 2 before pulling back into the $750–$756 range on geopolitical turbulence. The chart tells a story of resilience: the market absorbed multiple rounds of Israel-Iran escalation with sharp intraday whipsaw but no sustained breakdown. The current ≈$754 level is right at the confluence of recent trading range support, less than 1% below all-time highs.
Gamma-Based Support & Resistance
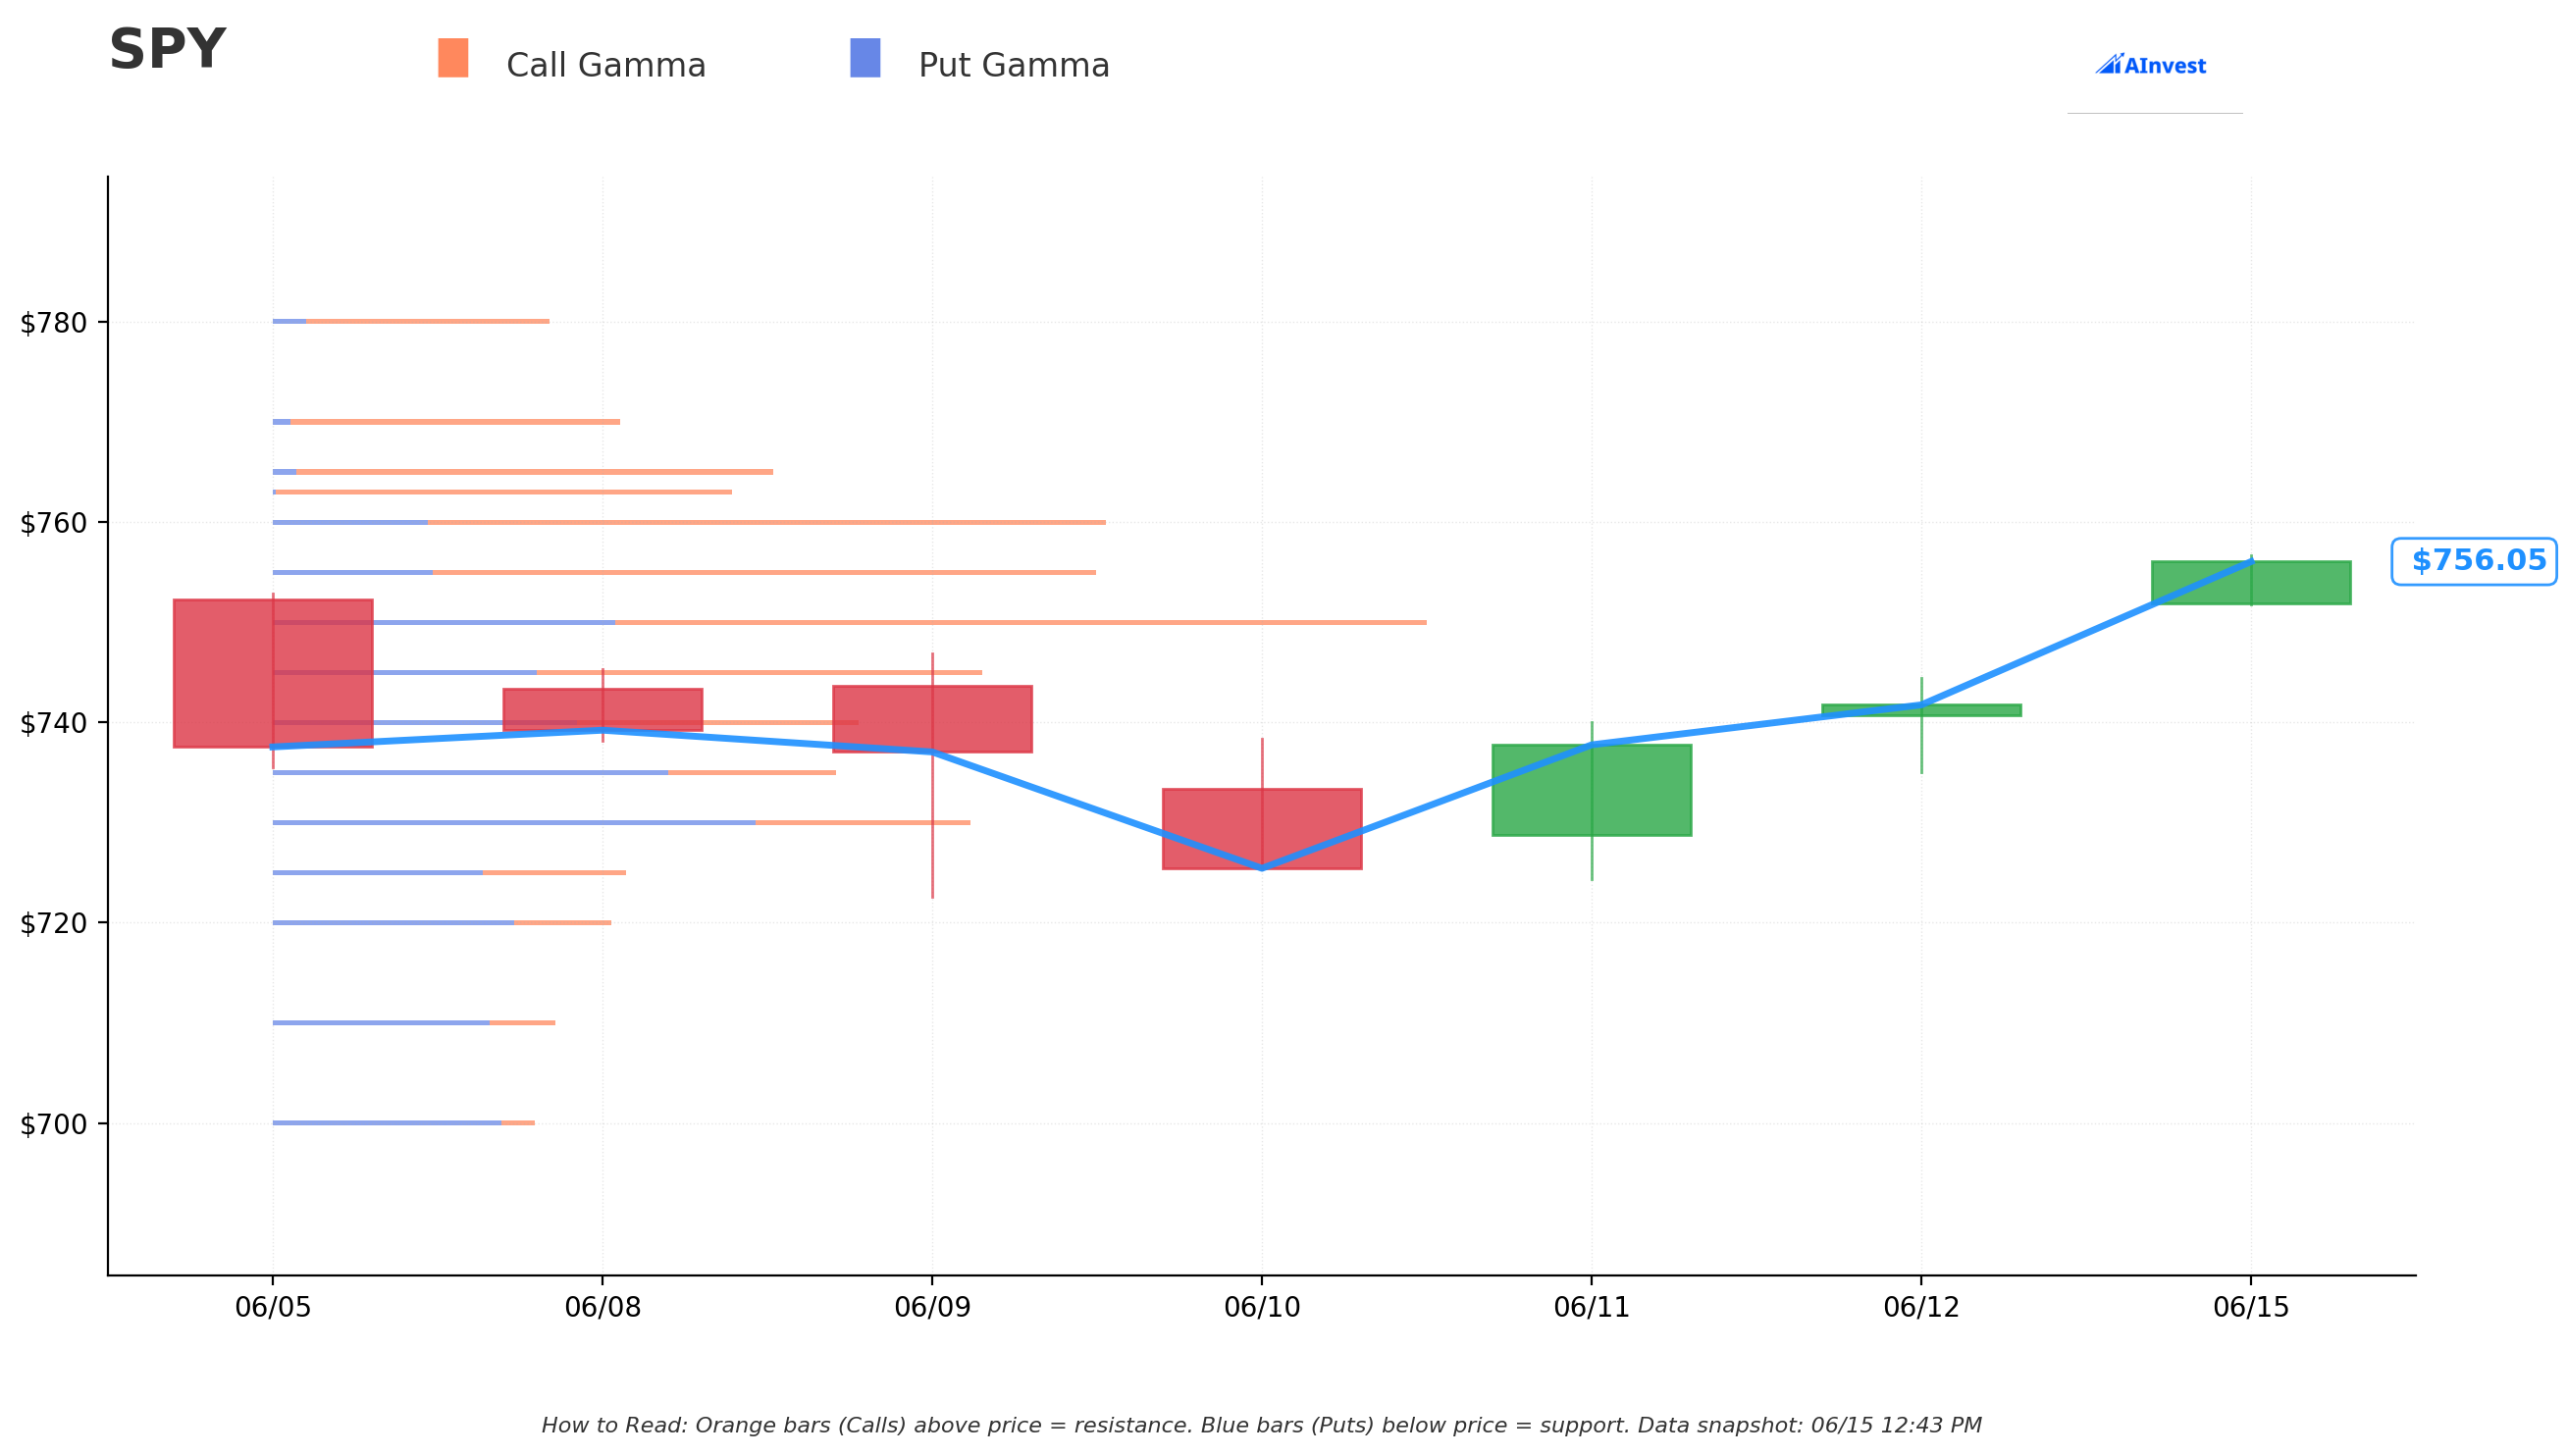
Current Price: ≈$753.94 (spot as of the trade) / ≈$755.94 (live)
🔵 Support Level (Put Gamma Below Price):
- $750 — Key Near-Term Support. Market makers are long puts here, creating a dynamic where they tend to buy SPY on dips toward $750, cushioning the floor. This is the level the short-put desk benefits from most — as long as $750 holds, the nearest short strike ($630) is ≈19% further down.
🟠 Resistance Levels (Call Gamma Above Price):
- $760 — First Resistance. The most immediate call gamma wall. SPY struggled to hold above $760 after the June 2 all-time high close; market makers' hedging creates mechanical selling pressure near this level.
- $795 / $800 — Major Resistance Zone. The next significant call gamma cluster above the range. A clean breakout above $760 would open up this zone as the next target — which would be even better news for the put-write desk (more cushion above all three strikes).
Translation for traders: SPY is sandwiched between $750 support and $760 resistance in the near term. For the short put desk, the $750 gamma floor is actually an ally — it makes a fast drop through that level mechanically difficult. The real risk to this trade is not a gradual drift; it's a sudden vol shock that overwhelms market-maker hedging.
Implied Move Analysis
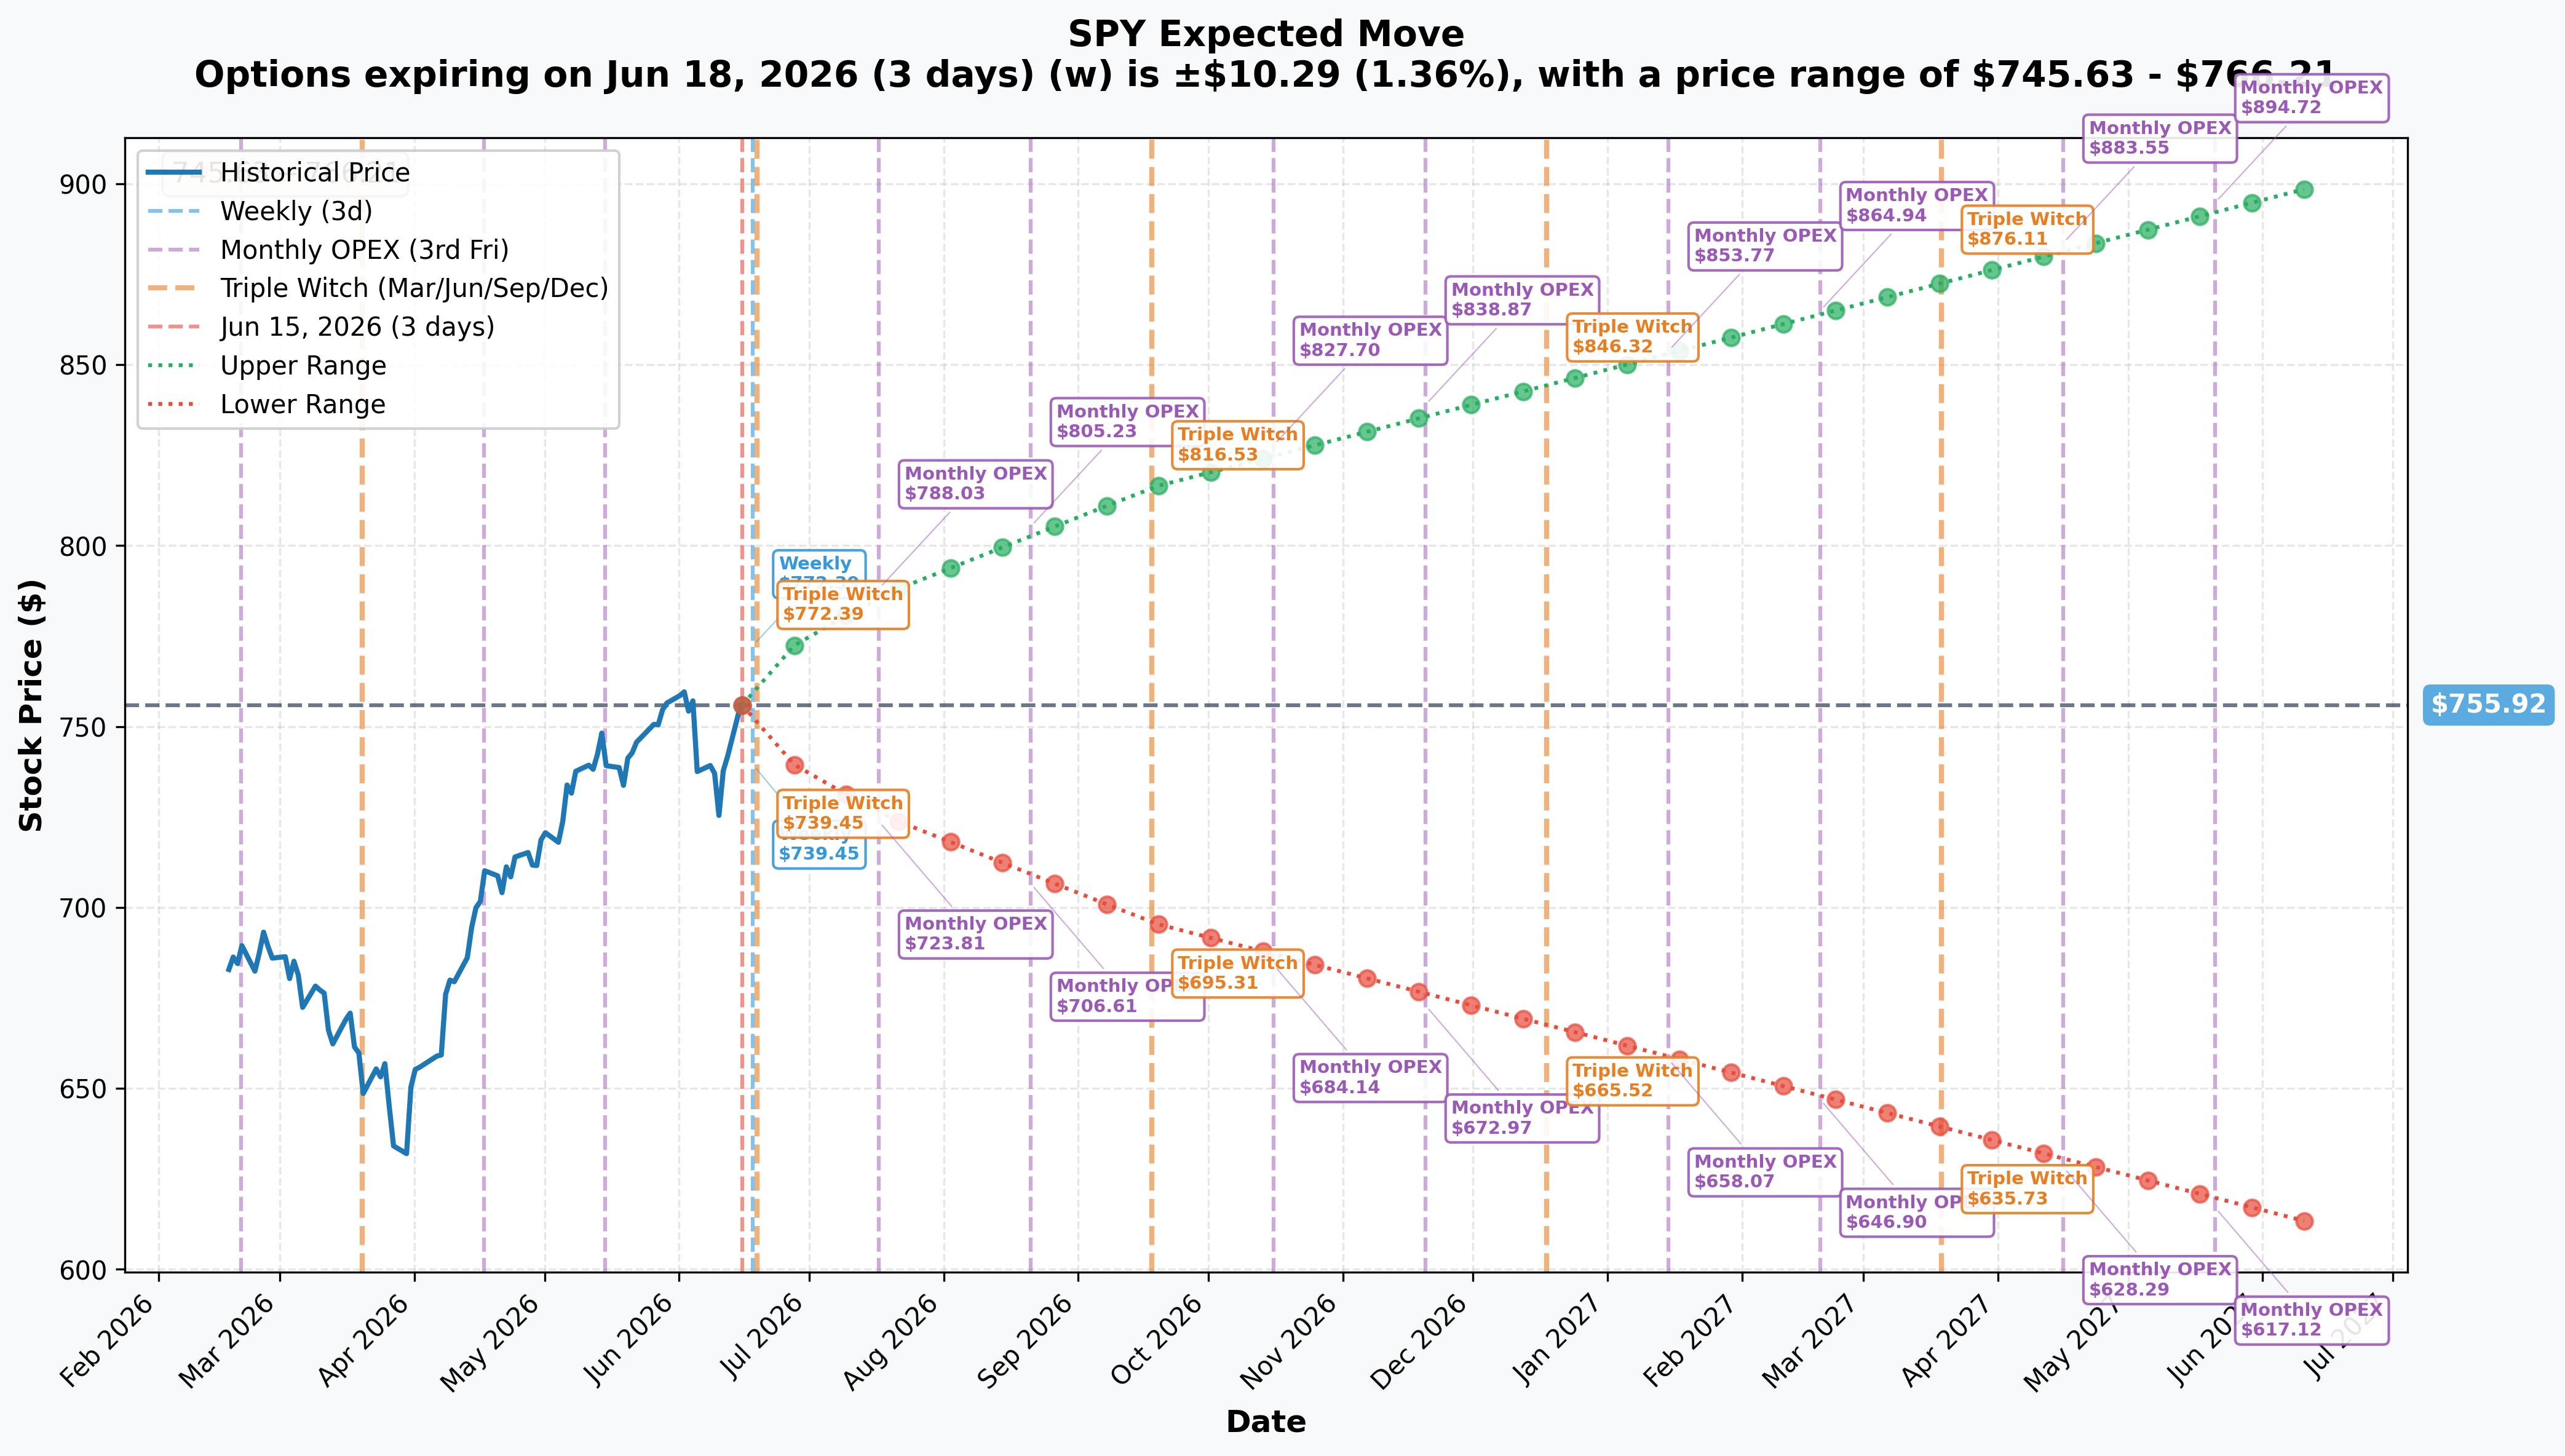
The options market is pricing the following ranges for SPY across expiries:
- 📅 Monthly (exp 2026-07-17): ±4.0% → Range $725.72 – $786.12
- 📅 Quarterly (exp 2026-09-18): ±7.98% → Range $695.62 – $816.22
Here is the critical context for the put-write: even the quarterly lower bound of $695.62 sits about $65 below the highest short put strike at $630. The options market's own one-standard-deviation probability cone, extended to the quarterly expiry, doesn't even threaten the nearest short strike. To put it simply:
| Strike | Distance from Spot | Monthly lower bound ($725.72) | Quarterly lower bound ($695.62) |
|---|---|---|---|
| $630P | ≈−16% | ≈$96 above | ≈$66 above |
| $550P | ≈−27% | ≈$176 above | ≈$146 above |
| $470P | ≈−38% | ≈$256 above | ≈$226 above |
The short puts are so far out of the money that the market's implied vol pricing puts them well below the standard probability cone. These options only become dangerous in a true tail event — the kind that moves markets multiple standard deviations.
🎪 Catalysts
Upcoming (What Drives This Trade Into Aug 21)
June FOMC Meeting — June 16–17, 2026 (tomorrow/Wednesday) 📅 Market-implied probability of no change is ≈97–99.6% — the rate decision itself is not a surprise. The real catalyst is the updated dot plot and Summary of Economic Projections. After the hot May CPI print of +4.2% YoY, any hawkish shift in the dot plot (fewer projected cuts, higher terminal rate) could pressure stocks. Watch for Fed Chair statements on the energy-driven inflation spike — the desk's puts need the June 17 event to be a non-event.
May PCE (Fed's preferred gauge) — June 25, 2026 📅 The April PCE already ran hot at +3.77% YoY. May PCE will show whether energy-led inflation is bleeding into the Fed's own benchmark. A second hot reading back-to-back firms the "higher for longer" narrative and weighs on the premium multiple.
June CPI — July 14, 2026 📅 Another inflation read, landing right as earnings season ramps, per BLS calendar. Inflation stickiness is the macro headwind to watch — the May number already surprised at +4.2%.
Q2 2026 Earnings Season — kicks off July 13 📅 This is the single most important catalyst for the short-put trade. Consensus S&P 500 EPS growth is ≈+21.9% YoY on ≈+10.9% revenue growth, with 57% of companies already issuing positive EPS guidance — well above the 41% five-year average. Strong Q2 reports, especially from the Magnificent Seven (reporting late July / early August), would be a direct tailwind to the put-write. A broad miss, especially if AI-capex narratives disappoint, is the key bear risk.
July FOMC Meeting — July 28–29, 2026 📅 Expected to hold at 3.50–3.75%, with some firms now modeling no cuts through year-end and even a small probability of a late-2026 hike. The meeting landing right before the Aug-21 expiry means any hawkish surprise in late July is a real-time risk to the position.
AI Capex Season (late July – early August) 📅 Hyperscaler 2026 AI capex is tracking toward ≈$725 billion. With the Magnificent Seven at ≈33.8% of the S&P 500, their earnings are effectively index-level catalysts. Beats = premium tailwind; misses = the fastest path to a vol spike.
Recently Happened (Context for Current Level)
May CPI Hot at +4.2% YoY (June 10, 2026) — Energy prices jumped +3.9% for the month (+23.5% YoY) as the Israel-Iran conflict spiked oil. This is the single event most responsible for the vol environment in which this put-write was done.
Israel-Iran Military Conflict (escalating June 2026) — Israel launched airstrikes on Iran's nuclear facilities; WTI jumped +6.7% on the initial strike day. US Central Command struck Iranian military targets, broadening the conflict. Markets showed sharp intraday drops but recovered — the S&P 500 bounced +1.75% in a single session on a temporary ceasefire signal. The conflict is ongoing as of today.
May Jobs Report (June 5, 2026) — +172,000 payrolls, crushing the +80,000 consensus; unemployment held at 4.3%. A strong labor market is the backbone of the soft-landing narrative that underpins bullish-to-neutral positioning like this put-write.
🎲 4-Reader Interpretation
🚀 YOLO Trader
This isn't your kind of trade to copy directly — selling puts at this size requires serious margin capital and defined tail risk. But there's a signal here worth using: a desk just took ≈$37M that the market stays above $630 by August 21. If you agree, and you want leveraged upside exposure, consider buying SPY call spreads rather than selling puts: e.g., a Aug-21 $760/$780 call spread captures a bullish breakout above resistance for a fraction of the put-write's capital. Defined risk, directional leverage, and aligned with what the big desk is implicitly saying about the near term.
📊 Swing Trader
The key technical levels to trade around are the $750 gamma support (buy the dip) and the $760 gamma resistance (potential short-term ceiling). SPY has been bouncing inside this band. A swing trade idea: buy SPY or a near-dated call spread on a pullback to $750–$751 with a tight stop below $748. Target the $760 breakout. The put-write desk is essentially telling you the floor is much lower — use the $750 gamma support as your trade anchor. August earnings season will be the catalyst that breaks the range in one direction.
🛡️ Premium Collector
This is exactly the kind of trade you should study. The desk chose strikes so far OTM that even the quarterly implied-move lower bound doesn't threaten them. For retail-scale premium collection, consider the same framework scaled down: selling the Sep-2026 $700 or $680 put (further out than even the $630 leg) and collecting a few hundred dollars per contract. The market is paying meaningful vol premium for tail protection right now — the put-write desk noticed, and collected ≈$37M worth. With the FOMC meeting June 17 as an event to wait through, look for entries after the June 17 dot plot if you want a cleaner vol picture before selling.
🌱 Entry-Level / Beginner
Here is what happened in plain English: an institution just sold put options on SPY and collected ≈$37.4 million in cash upfront. Selling a put option means you are promising to buy SPY at a specific price if the market falls that far. The institution collected the cash, and now they are fine as long as SPY stays above $630 by August 21. With SPY at ≈$754 today, the market would have to fall about 16% just to reach the first strike, and 38% to reach the lowest. The bet is basically: "We don't think there's going to be a major crash before August 21, so we'll take the premium." The risk — if there is a crash — is that they'd have to buy a LOT of SPY at prices above the market. This is called a "put-write" and it's one of the most common strategies used by large institutions for income.
⚠️ Risk Factors
Options trading involves substantial risk of loss. Here are the specific risks that could work against this short-put structure:
The Israel-Iran Conflict Is the #1 Tail Risk A Strait of Hormuz disruption — which carries ≈20M barrels per day of crude transit — could push Brent above $130/bbl in the tail scenario. That would re-ignite inflation, force a hawkish Fed response at a ≈83rd-percentile forward P/E of ≈22.7x, and compress multiples fast. The most direct path to a >16% drawdown that threatens the $630 put runs through an oil shock, not an earnings miss. This risk is live and undated.
Sticky Inflation → Hawkish Dot Plot (June 17) With May CPI at +4.2% and April PCE at +3.77%, a hawkish shift in the June 17 dot plot — fewer projected cuts, or a hint of a rate hike — could cause a sharp risk-off reaction in equities. The FOMC meeting is the nearest-dated binary event for this trade.
A Vol Spike Hurts the Short-Put Position Immediately Even if SPY stays above $630, a sudden spike in implied volatility would cause the short puts to increase in value — meaning the desk would show a mark-to-market loss. Geopolitical shocks (think the June 8 drop following Iranian counter-strikes) cause vol to spike even when the underlying only moves 1–2%. The desk's risk is not just directional; it's also volatility exposure.
Stretched Valuations Leave Little Room for Earnings Misses The S&P 500 forward P/E is ≈22.7x — in the ≈90th historical percentile. When valuations are this stretched, a single large-cap earnings disappointment (especially from a Magnificent Seven name like Nvidia or Microsoft, which together account for significant index weight) can cascade into a fast, sharp drawdown. The Mag 7 are ≈33.8% of the index — concentration risk is real.
Tariff Passthrough Is an Ongoing Drag US consumers are absorbing an increasing share of total tariff costs — projected to rise toward ≈67% as pre-tariff inventory buffers deplete. Sustained goods inflation at the highest import tariff levels since 1935 compresses consumer spending margins and could weigh on revenues in the second half of 2026.
What the OPRA Tape CANNOT Tell Us: We know the mechanism (multi-leg auction), the three strikes, the sizes, the premiums collected, and that these are fresh selling positions. We do not know the desk's identity, whether these puts are part of a broader hedged structure, or what their specific rolling / stop-loss thresholds are. We read the tape; we cannot read minds.
🎯 The Bottom Line
Here's the deal: a desk just collected ≈$37.4M in cash and bet that the S&P 500 does NOT crash 16%+ before August 21. That's a high-confidence-looking setup on paper — all three strikes are well outside the options market's own implied-move probability cone — but it's not without real risks.
The bull case (puts expire worthless): Q2 earnings season at ≈+21.9% YoY consensus growth, a strong labor market (+172K May payrolls), and SPY within ≈1% of all-time highs make a 16%+ crash by August 21 a low-base-case scenario. The $750 gamma support level reinforces the mechanical floor.
The bear case (the real risk to the trade): A live Israel-Iran conflict with oil already up 7%+, CPI re-accelerating to 4.2%, and a ≈90th-percentile valuation are the ingredients for a fast, deep drawdown if a tail event materializes. The Strait of Hormuz is the single highest-variance undated catalyst.
Key dates to watch:
- 📅 June 17: FOMC rate decision + dot plot — the nearest binary event
- 📅 June 25: May PCE — second inflation datapoint in two weeks
- 📅 July 13: Q2 earnings season begins (big banks)
- 📅 July 14: June CPI
- 📅 July 28–29: July FOMC — final meeting before Aug-21 expiry
- 📅 Late July / Early August: Magnificent Seven earnings — index-level swing factor
- 📅 August 21, 2026: SPY $630/$550/$470 puts expiration
- 📅 Monday June 16 ≈06:30 ET: OPRA OI snapshot — confirming fresh opens (expected OI rise ≈100K on $630P, ≈200K on $550P, ≈100K on $470P; may be less if transfers)
If you hold SPY stock: The $750 gamma support is your near-term floor to watch. A break below $748–$750 on a geopolitical shock removes the mechanical prop and could accelerate a move lower. Stay aware of the FOMC and earnings calendar — those are the scheduled events that could break the current range.
If you are watching from the sidelines: The implied-move data shows SPY's monthly range of $725.72–$786.12. A clean break above $760 gamma resistance would signal the range is resolving upward. The AI earnings in late July are the most likely catalyst for that move.
If you are bearish: The $750 gamma support level is where bears need a close below to confirm a broader breakdown. The June 17 FOMC dot plot and June 25 PCE are the near-term catalysts that could provide that trigger. A Strait of Hormuz disruption remains the tail scenario that would quickly put the $630 puts in play.
A ≈$37M put-write on the largest ETF on earth, structured with tiered deep-OTM strikes and a 9-week runway into a packed earnings and macro calendar — income-focused, high base-case odds, and clear about what it would take to lose.
Disclaimer: Options trading involves substantial risk of loss and is not suitable for all investors. This analysis is for educational and informational purposes only and does not constitute financial advice. Past unusual options activity does not guarantee future returns. Selling put options carries significant downside risk: the short put seller is obligated to purchase shares at the strike price if SPY falls below the strike at expiration, which can result in losses substantially exceeding the premium collected if the underlying declines sharply. A ≈$37.4M credit on 400,000 contracts across three strikes represents institutional-scale capital requirements and margin obligations that differ substantially from retail options accounts. Always conduct your own due diligence and consider consulting a licensed financial advisor before making any trading decisions. Open/close classification is based on size-vs-prior-OI inference and will be confirmed by next-day OPRA open interest data (≈06:30 ET, Monday June 16).
Last updated: June 15, 2026