🦋🛡️ SPY $31.8M Crash-Insurance Butterfly — the Feed Said "Puts Sold," the Tape Says Puts Bought
📅 2026-07-31 | 🔥 Unusual Activity Detected — Two Floor-Negotiated Put Butterflies
✅ UPDATE — August 3, 2026 pre-market: the OI check is in and all six legs confirmed open — every one within 100 contracts of our published prediction. 1,050,000 contracts of new open interest were created across the two put ladders, with no meaningful transfer component anywhere. See the ✅ RESOLVED box.
🎯 The Quick Take
Someone paid ≈$31.8M today to build two long put butterflies on the SPDR S&P 500 ETF Trust (SPY) — one expiring 2026-09-30, one expiring 2026-10-16 — that can be worth up to ≈$3.0B combined if SPY is trading between roughly $435 and $635 at expiry. A quick-look feed flagged this as "four SPY put sales totaling $114M," which is the opposite of what happened: the tape shows six legs, not four, forming a 1×2×1 ratio that only exists in one structure — a butterfly — and the buyer is paying money, not collecting it. This is a defined-risk, defined-payoff hedge, not a bearish bet that SPY crashes to zero, and it does not imply a crash is coming. It reads like textbook crash insurance for a large portfolio.
📊 Fund Overview — What You're Actually Looking At
SPY is the original S&P 500 index fund — the SPDR S&P 500 ETF Trust, sponsored by State Street Global Advisors, tracking the S&P 500's 500-odd large- and mid-cap US stocks on a market-cap-weighted basis. It has traded since January 1993, making it the oldest ETF in the US market.
| Metric | Value |
|---|---|
| Assets under management | ≈$789.1B |
| Expense ratio | 0.09% |
| Legal structure | Unit Investment Trust (UIT) — SPY cannot reinvest dividends between distributions or lend securities, unlike newer "open-end" S&P 500 funds |
| Holdings | ≈505 |
| 52-week range | $619.29 – $760.40 |
| Spot on 2026-07-31 | ≈$746 |
Top holdings: Apple 7.65%, NVIDIA 7.38%, Microsoft 5.24%, Amazon 3.60%, Alphabet (GOOGL+GOOG combined) 5.52%, Broadcom 2.87%, Meta 1.85%, Micron 1.54%, JPMorgan 1.47% — the top 10 names are ≈37% of the fund.
Sector breakdown: Information Technology 37.2%, Financials 12.6%, Communication Services 9.4%, Health Care 9.2%, Consumer Discretionary 8.9%, Industrials 8.7%, Consumer Staples 4.7%, Energy 3.4%, Utilities 2.2%, Real Estate 1.9%, Materials 1.9%.
Why the structure matters here: because SPY is a UIT holding all 500-plus stocks directly, options on SPY are effectively options on the broad US market — a butterfly here is a bet on where the whole index lands, not on any single company.
💰 The Trades — Two Butterflies, 26 Minutes Apart
What the raw screenshot showed: four legs, every single one labeled SELL, adding up to a headline "$114M in put sales." What the full-chain tape scan actually shows at both timestamps: exactly three prints each, in a 1×2×1 size ratio — the fingerprint of a long butterfly, not four unrelated sells. The screenshot missed the third leg of each package (the deep, cheap wing) and mislabeled the direction on the rest.
Package A — 14:22:50, expires 2026-09-30 🤝 FLOOR-NEGOTIATED BLOCK
| Time | Symbol | Buy/Sell | Type | Expiration | Strike | Premium | Volume | Prior OI | Size | Spot | Option Price | Option Symbol |
|---|---|---|---|---|---|---|---|---|---|---|---|---|
| 14:22:50 | SPY | BUY | PUT | 2026-09-30 | $635 | $30.30M | 150,124 | 693 | 150,000 | $746.27 | $2.02 | SPY20260930P635 |
| 14:22:50 | SPY | SELL | PUT | 2026-09-30 | $535 | $18.60M | 300,001 | 733 | 300,000 | $746.27 | $0.62 | SPY20260930P535 |
| 14:22:50 | SPY | BUY | PUT | 2026-09-30 | $435 | $3.15M | 150,000 | 425 | 150,000 | $746.27 | $0.21 | SPY20260930P435 |
Net debit: $0.99/share = $14.85M paid. Max value at expiry (SPY lands exactly at $535) = $100/share = $1.50B. That's ≈101:1 — the ratio the screenshot's "$114M sold" framing completely inverted.
Package B — 14:48:24, expires 2026-10-16 🤝 FLOOR-NEGOTIATED BLOCK
| Time | Symbol | Buy/Sell | Type | Expiration | Strike | Premium | Volume | Prior OI | Size | Spot | Option Price | Option Symbol |
|---|---|---|---|---|---|---|---|---|---|---|---|---|
| 14:48:24 | SPY | BUY | PUT | 2026-10-16 | $625 | $38.55M | 150,000 | 5,778 | 150,000 | $746.19 | $2.57 | SPY20261016P625 |
| 14:48:24 | SPY | SELL | PUT | 2026-10-16 | $525 | $26.40M | 300,023 | 765 | 300,000 | $746.19 | $0.88 | SPY20261016P525 |
| 14:48:24 | SPY | BUY | PUT | 2026-10-16 | $425 | $4.80M | 150,000 | 4,591 | 150,000 | $746.19 | $0.32 | SPY20261016P425 |
Net debit: $1.13/share = $16.95M paid. Max value at expiry (SPY lands exactly at $525) = $100/share = $1.50B. That's ≈88:1.
Combined: ≈$31.80M paid today for a structure that can be worth up to ≈$3.0B at the two expiries. Every one of the six legs printed against prior open interest of just 425 to 5,778 contracts — sizes of 150,000 and 300,000 dwarf that by two to three orders of magnitude on four of the six strikes. This is brand-new risk on the board, not a roll or a position adjustment.
✅ RESOLVED — All Six Legs Confirmed Open. Every Prediction Hit.
All six legs were already near-proven fresh opens from the tape alone — the trade sizes (150,000 / 300,000 contracts) so overwhelm the prior open interest (425–5,778) that there was no realistic way that volume was mostly closing existing positions. The August 3 pre-market OPRA snapshot confirms all six, and every single leg landed within 100 contracts of our published prediction. This is the cleanest resolution of the entire July 31 board, at by far the largest size.
| Leg | Baseline OI (Jul 31 snap) | Predicted | Resolving OI (Aug 3 snap) | Δ | Print size | Δ as % of print | Verdict |
|---|---|---|---|---|---|---|---|
| $635 put (Sep-30) | 693 | ≈150,700+ | 150,684 | +149,991 | 150,000 | ≈100.0% | ✅ OPEN (BTO) |
| $535 put (Sep-30) | 733 | ≈300,700+ | 300,766 | +300,033 | 300,000 | ≈100.0% | ✅ OPEN (STO) |
| $435 put (Sep-30) | 425 | ≈150,400+ | 150,436 | +150,011 | 150,000 | ≈100.0% | ✅ OPEN (BTO) |
| $625 put (Oct-16) | 5,778 | ≈155,700+ | 155,751 | +149,973 | 150,000 | ≈100.0% | ✅ OPEN (BTO) |
| $525 put (Oct-16) | 765 | ≈300,700+ | 300,857 | +300,092 | 300,000 | ≈100.0% | ✅ OPEN (STO) |
| $425 put (Oct-16) | 4,591 | ≈154,500+ | 154,592 | +150,001 | 150,000 | ≈100.0% | ✅ OPEN (BTO) |
1,050,000 contracts of new open interest created across six strikes, and not one of them shows a meaningful transfer component. The largest deviation from the print size anywhere in the table is 92 contracts on a 300,000-lot leg — a rounding error. Both put ladders were built from scratch; nothing here was recycled from an existing position.
The real question for the sessions ahead was never open-vs-close — it's whether open interest holds steady into September, which would confirm this is a patient, multi-month hedge being carried through the risk window, or whether it gets unwound early on any market rally, which would tell us the position was tactical rather than a long-term portfolio hedge. That watch starts now, from a confirmed base.
🤓 What This Actually Means — Plain English
A raw screenshot cannot see a butterfly. That's the whole story here.
A long put butterfly is three trades stapled together, and it only makes sense as a package:
- 🛒 Buy one put at a high strike ($635) — expensive, close to the money.
- 💰 Sell two puts at a lower strike ($535) — collects a chunk of premium back.
- 🛒 Buy one put at an even lower strike ($435) — cheap, far out of the money.
Individually those look like three random trades (and if you only see two of the three, exactly what the screenshot did here, it looks like a directionless mess of "sells"). Stapled together, they form a position that costs very little up front ($0.99/share for Package A, $1.13/share for Package B) and pays its absolute maximum if SPY lands exactly on the middle strike at expiry — then fades back to zero outside the wings.
Why we're calling this a BUY, not a sell, even though the screenshot said otherwise: every leg on a floor-negotiated combo trade prints at a single blended price, and the exchange's per-leg "buy or sell" flag on that kind of ticket is not reliable — this is a known quirk of floor block trading, not a guess. So we look at the economics instead, and the economics are decisive. If you were the seller of this structure, you'd be risking ≈$1.485B (the $1.50B max payout minus the $14.85M you'd collect) to pocket $14.85M up front — a roughly 100:1 bet against yourself. No institution takes that trade. On the other side, paying ≈$32M for defined-risk, defined-maximum crash convexity is a completely ordinary pension-fund or tail-risk-fund hedge. We're calling this HIGH confidence on the structure (the 1×2×1 ratio and the net debit are tape fact) and MEDIUM-HIGH confidence on the direction (an economic inference, not a tape-proven certainty).
Here's the payoff shape at expiry, worked through in real numbers, using Package A's $635/$535/$435 fly on 150,000 contracts (the Oct-16 fly works identically, just centered $10 lower):
| SPY at expiry | Move from spot ($746) | Butterfly value per share | Gross payout | Net P&L after $14.85M cost |
|---|---|---|---|---|
| $700 | −6.2% | $0 (all three legs worthless or unaffected) | $0 | −$14.85M (full premium lost) |
| $600 | −19.6% | $35 | $525M | +$510.15M |
| $535 (the body — max payout) | −28.3% | $100 | $1.50B | +$1.485B |
| $480 | −35.7% | $45 | $675M | +$660.15M |
| $430 (below the $435 wing) | −42.4% | $0 | $0 | −$14.85M (full premium lost) |
The honest, important part: this structure pays its maximum only in a fairly narrow band — roughly between the two outer wings ($435 and $635, or ≈−15% to −42% from today's spot). If SPY is flat or up, the trade loses the full premium. If SPY crashes straight through the $435 wing — a move of more than ≈42% — the butterfly is worth zero at expiry, not billions. It is not a bet that the market crashes; it's insurance that only pays inside a specific damage zone, with a hard expiration date. Someone buying this is not forecasting a crash — they're pricing the cost of protection if one happens to land in that zone, cheaply, because the wings are so far out of the money.
Order types, in plain terms: every leg is a fresh opening trade (BTO on the two wings, STO on the two-lot body), all six proven against a nearly untouched prior open interest. Motive is inferred, not proven: the small resulting net short-delta exposure (≈−510,000 shares for Sep, ≈−502,500 shares for Oct, against ≈$3.0B of combined face value if fully in-the-money at the body) is exactly what you'd expect from a hedge overlay on a much larger long-equity book, not from someone trying to make a leveraged directional bet on the whole position. We cannot see the rest of the portfolio, so "hedge" is our best-supported read, not a confirmed fact.
📈 Technical Setup / Chart Check-Up
YTD Performance Chart
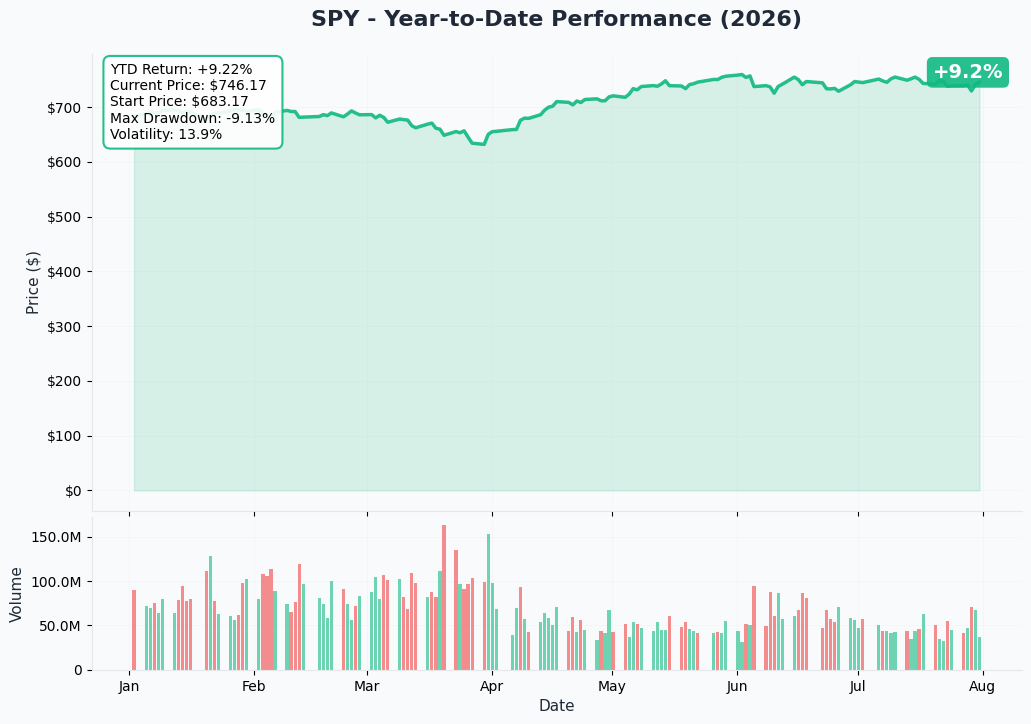
SPY sits ≈$746, inside a 52-week range of $619.29 – $760.40, roughly 2% below its 52-week high after the broader tech/AI-capex correction of the last two weeks of July. The tape shows this trade landing the same week the Nasdaq-100 clawed back from a ≈10% correction on blowout mega-cap cloud earnings — context for why someone might want cheap, deep downside protection precisely now, not a signal that more selling is coming.
Gamma-Based Support & Resistance
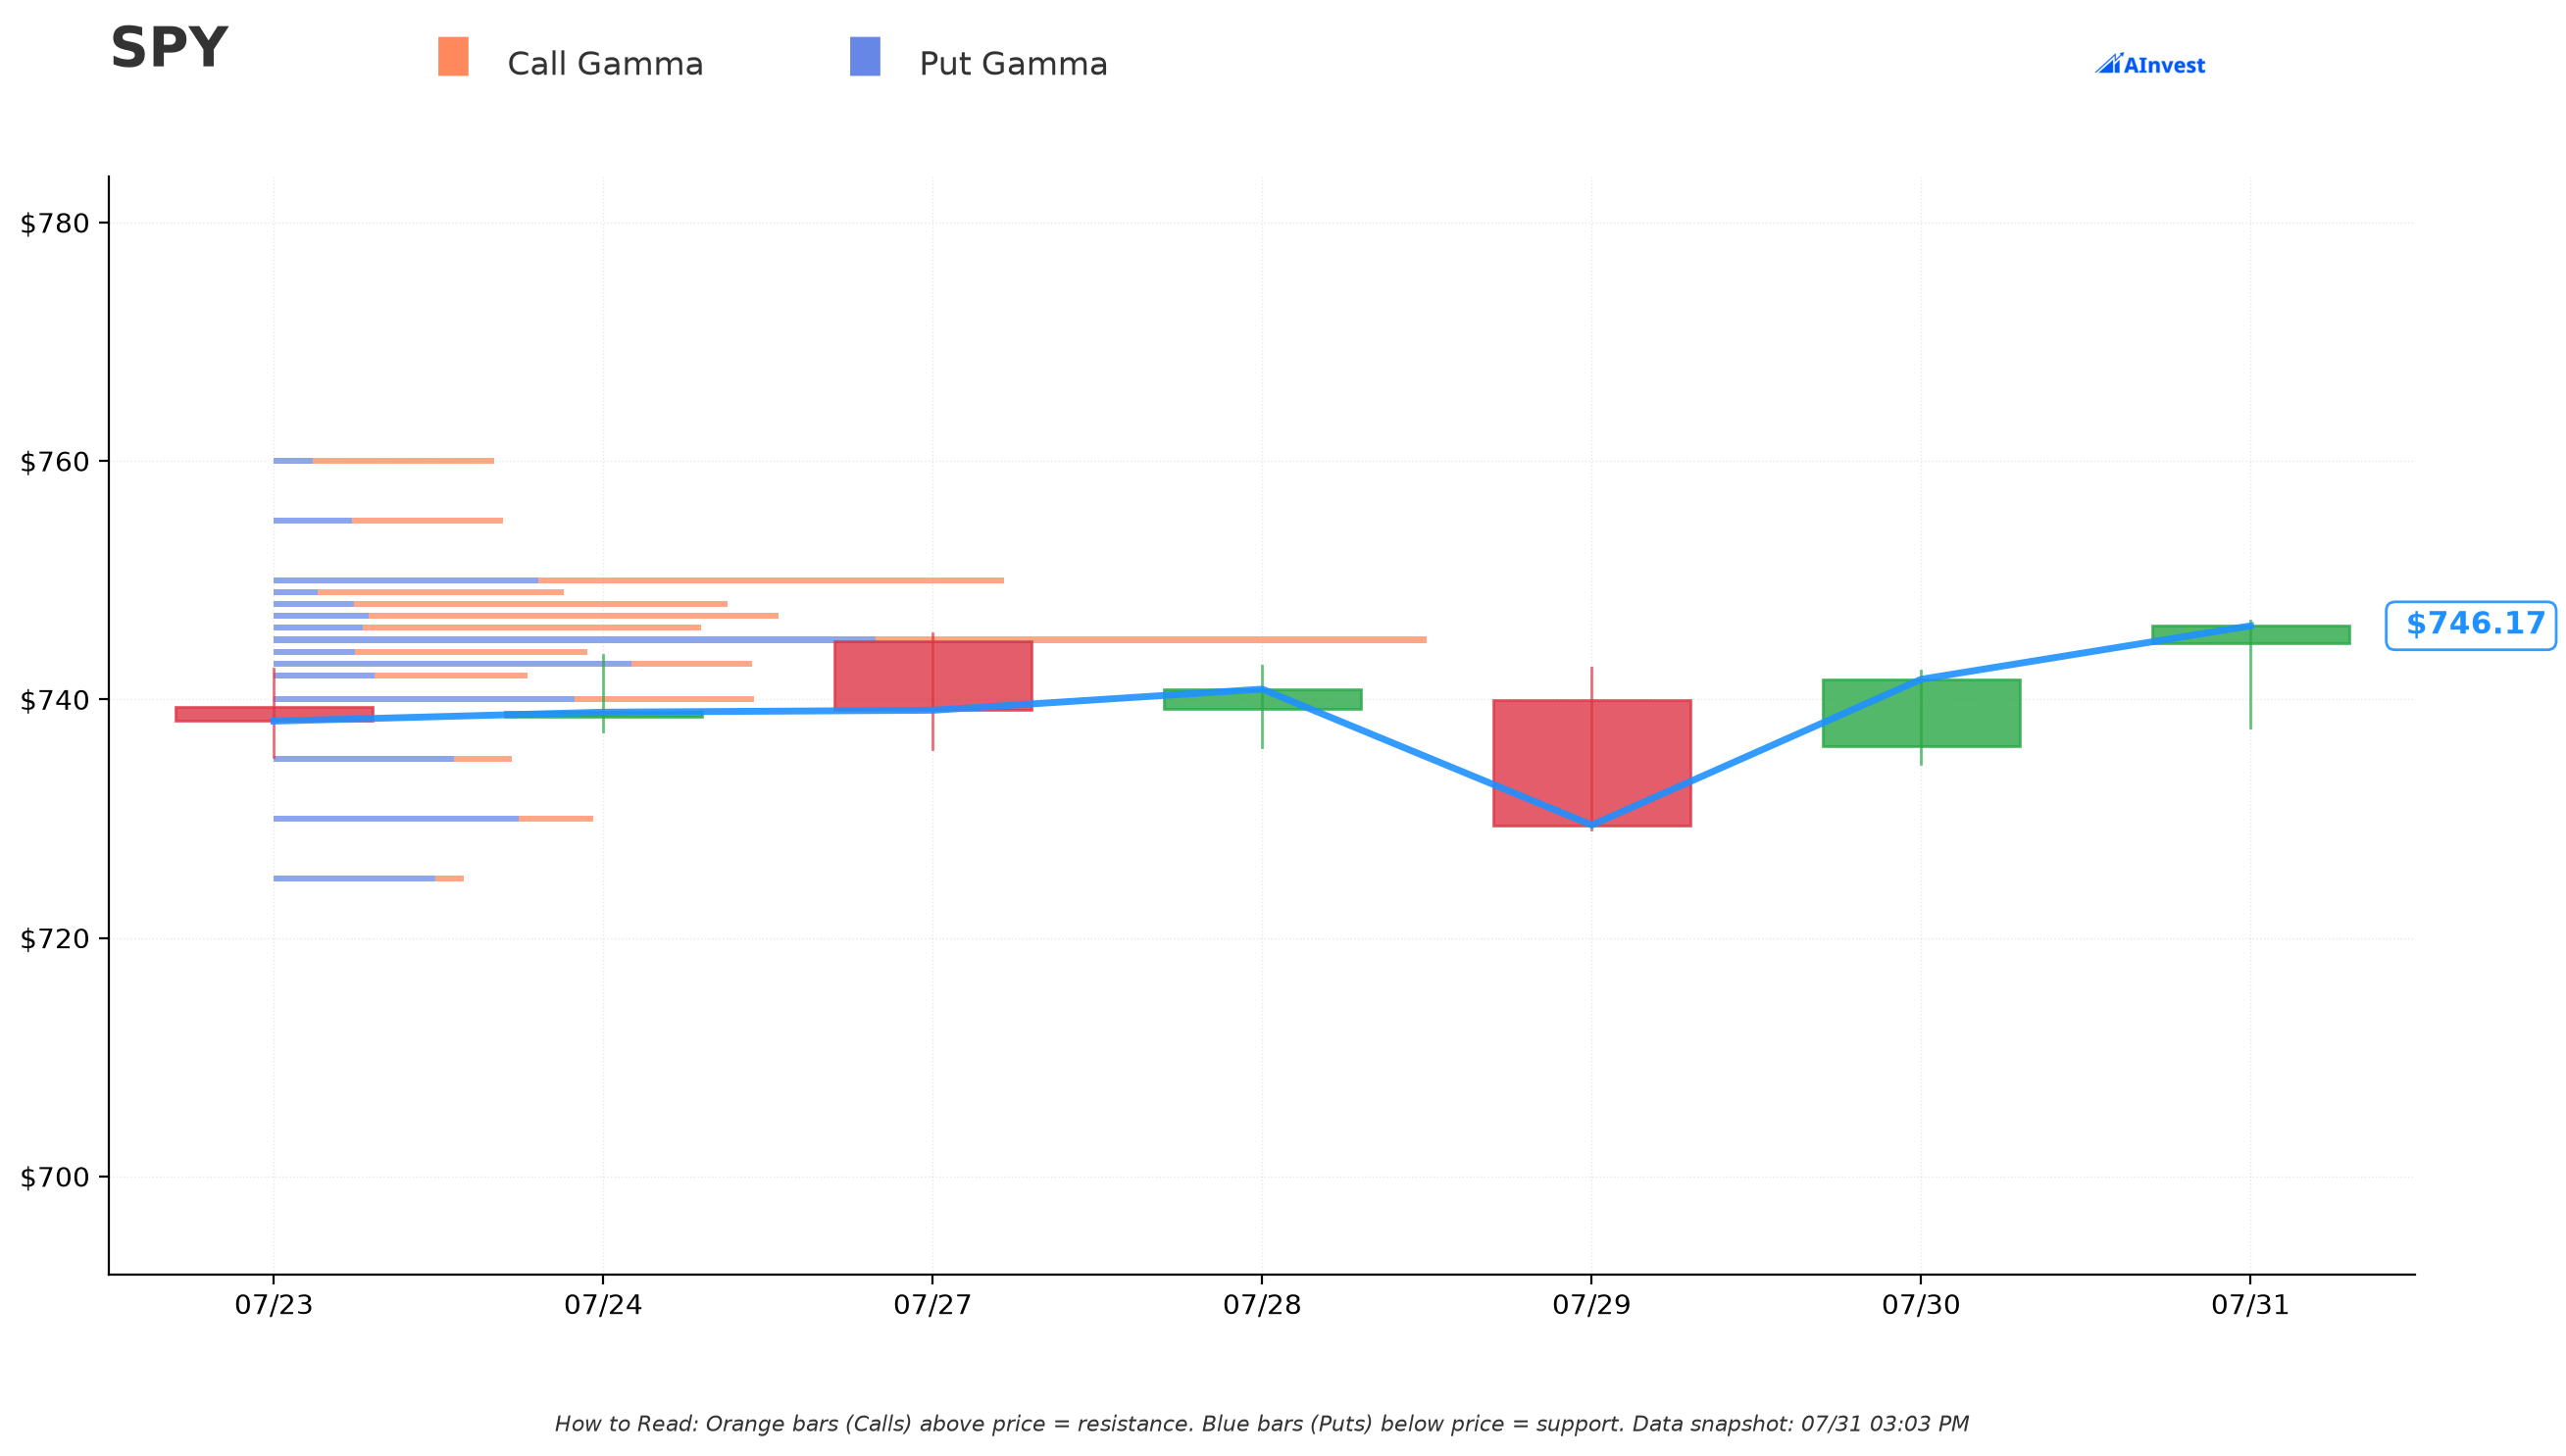
Current price: ≈$746
- 🔵 Immediate support: $745 — the single strongest gamma level on the board (very strong, ≈0.16% below spot).
- 🔵 Secondary support: $690 — ≈7.5% below spot, very strong.
- 🟠 Immediate resistance: $750 — very strong, ≈0.51% above spot; a tight $745–$750 range is where dealer hedging is most concentrated right now.
- 🟠 Further resistance: $790 and $800 — ≈5.9% and ≈7.2% above spot, both very strong.
The reality check that matters for this trade: the butterfly's body strikes ($535 and $525) sit so far below spot that they carry almost no dealer gamma positioning at all — total gamma exposure at the $535 strike is a small fraction of a percent of the exposure sitting at $745–$750. In plain terms, the market makers aren't meaningfully hedged anywhere near where this butterfly pays off. That's consistent with what it is: tail insurance for an extreme scenario, not a level the market is currently pricing as a live near-term target.
Implied Move Analysis
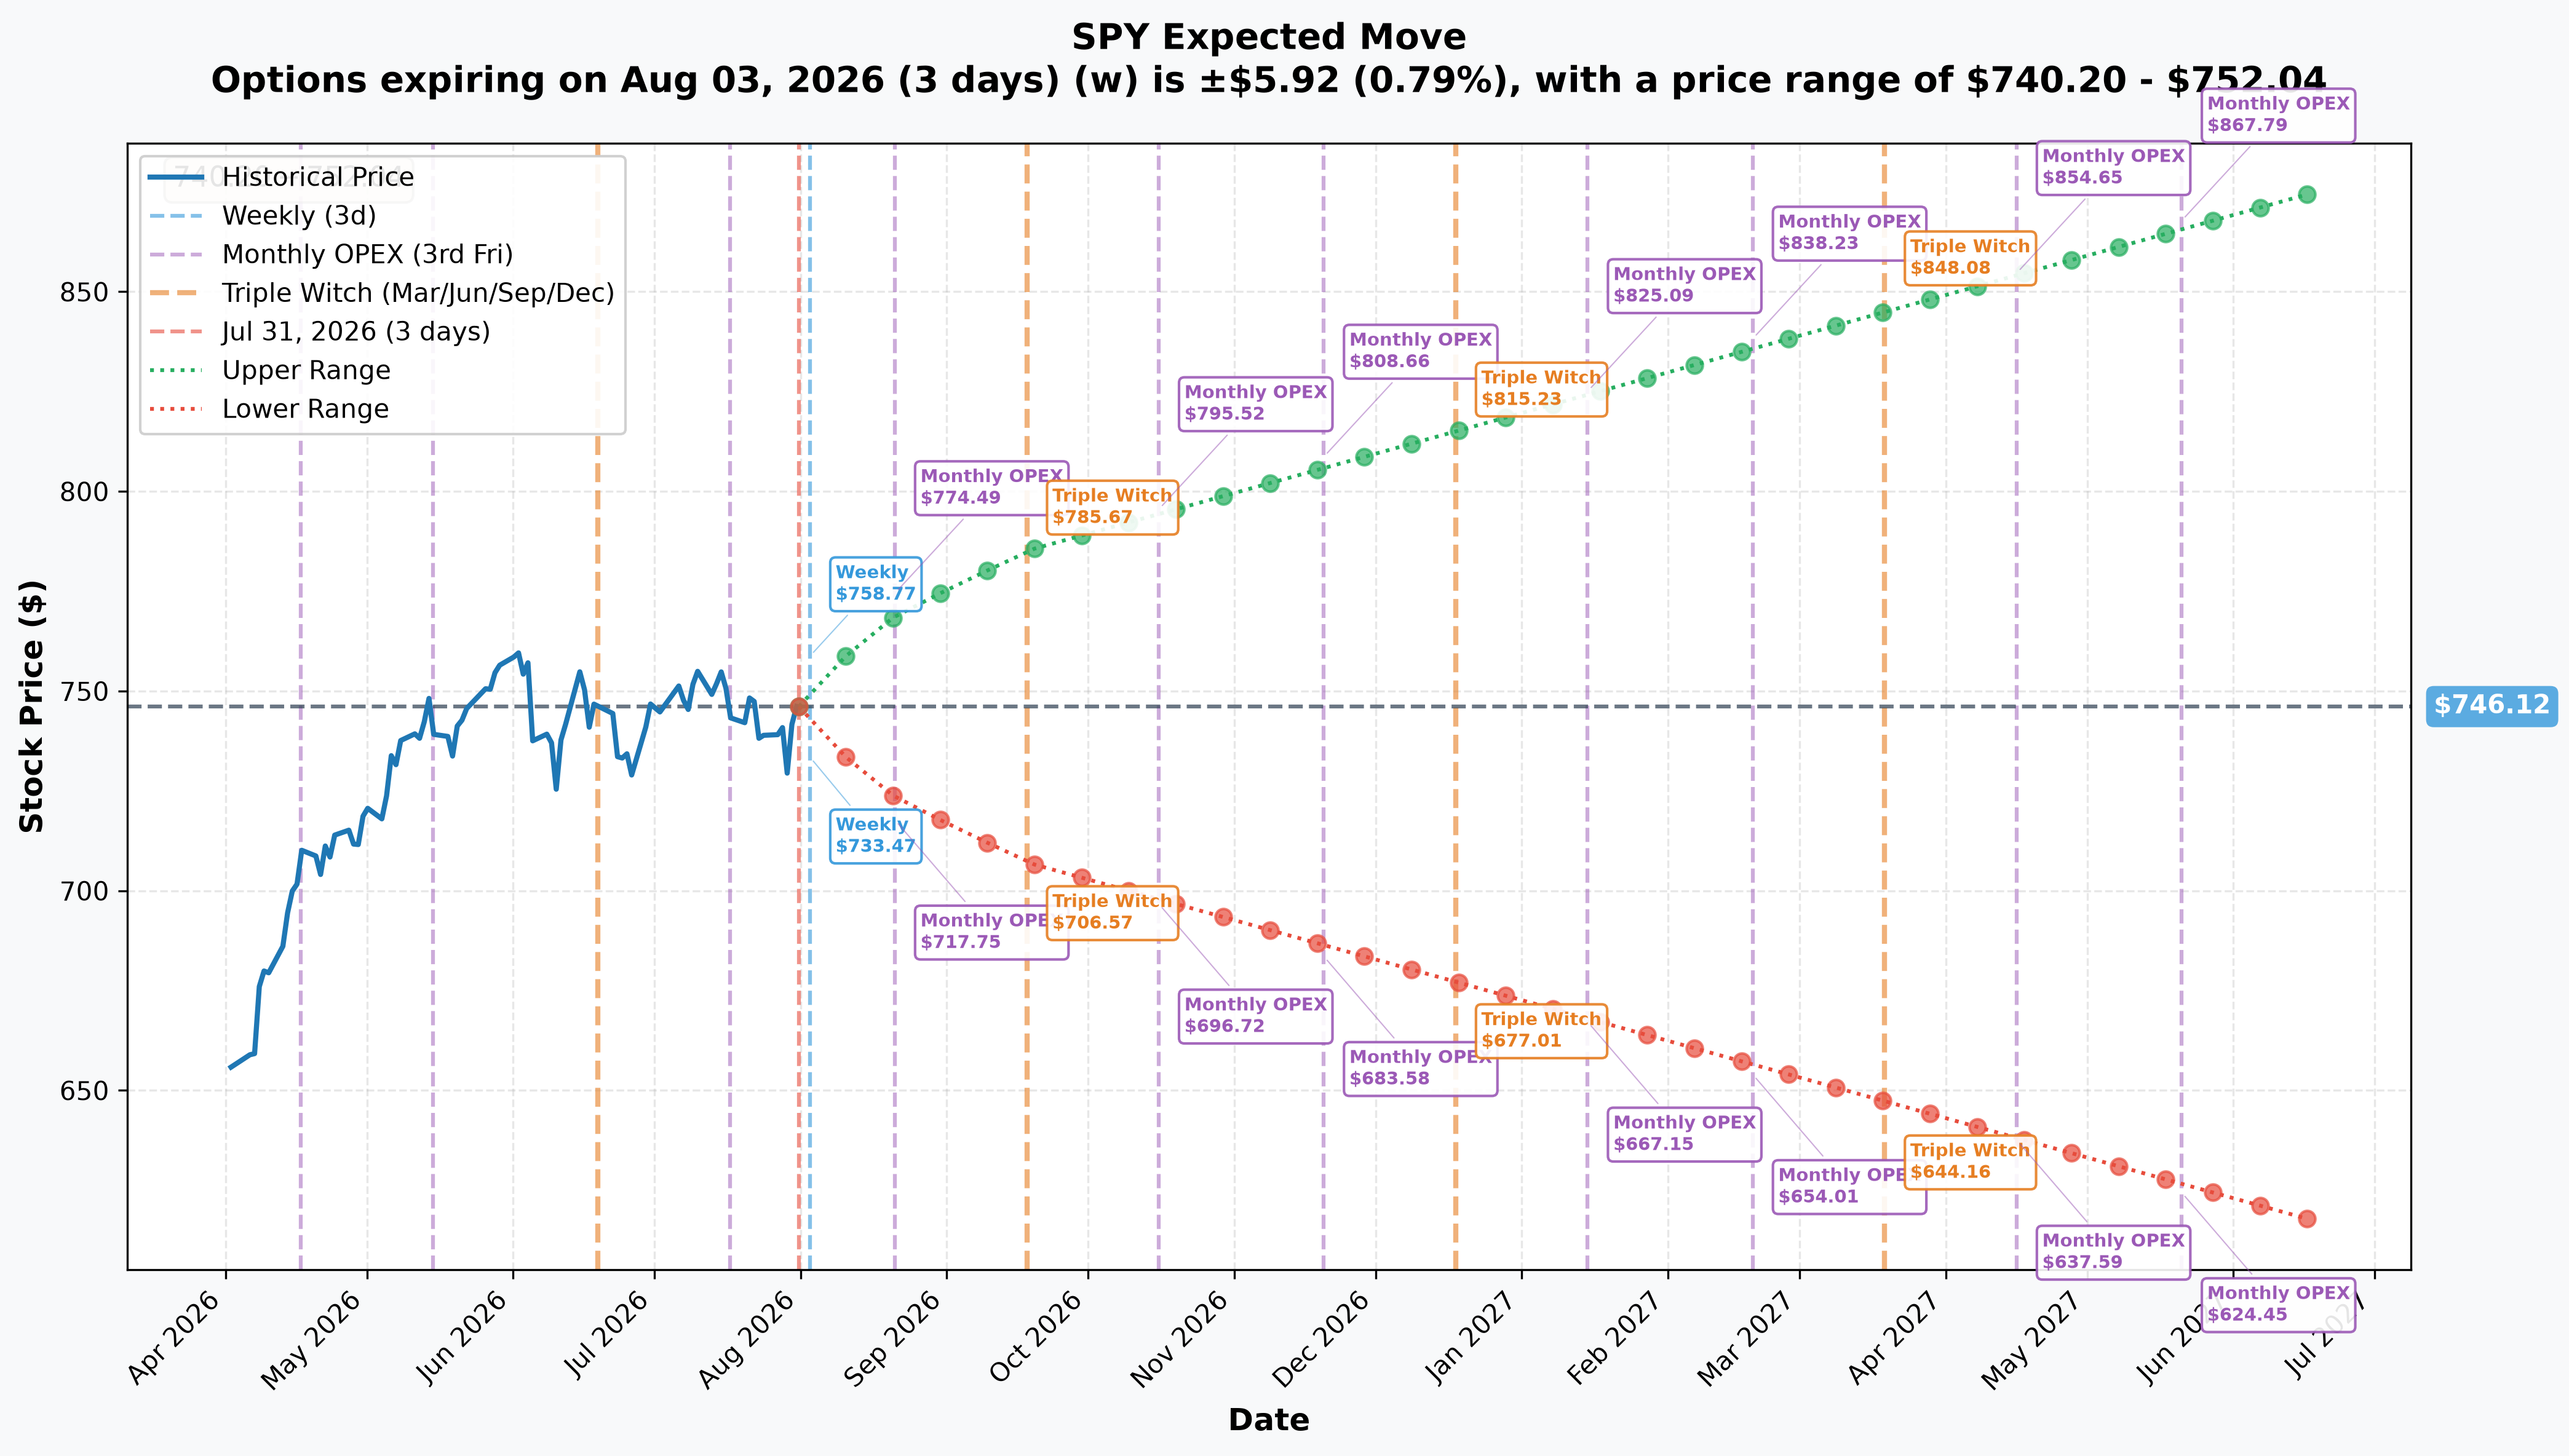
Per the options market's own pricing:
- Weekly (2026-08-03, 3 days): ±0.79% (±$5.92) → range $740.20 – $752.04
- Monthly OPEX (2026-08-21, 21 days): ±3.11% (±$23.23) → range $722.89 – $769.35
- Triple Witch (2026-09-18, 49 days — the closest print to Package A's Sep-30 expiry): ±5.26% (±$39.22) → range $706.57 – $785.67
- Monthly OPEX (2026-10-16, 77 days — Package B's exact expiry): range $696.72 – $795.52
- LEAPS out to 2027-06-17 (321 days): ±17.23% (±$128.57) → range $617.55 – $874.69
This is the single best reality check on how far out-of-the-money this trade is. Even the options market's own pricing for Package B's exact expiration date only sees SPY plausibly trading down to ≈$696.72 — nowhere near the $525 body strike, and not remotely close to the $425 lower wing. Even the far-dated 321-day LEAPS cone, spanning all the way to June 2027, only reaches down to ≈$617.55 — still above every strike in both butterflies. The options market is not pricing this scenario as likely. That's exactly what you'd expect from a low-cost tail hedge: cheap because the market thinks it's unlikely, valuable precisely because it's cheap if the unlikely happens.
🎪 Catalysts — Mapped to Each Expiry
🔥 Backdrop already in the rearview mirror (relevant context, not inside either window)
The trade printed the trading day after a consequential July 29, 2026 FOMC decision: the Committee held the federal funds rate at 3.50%–3.75% on a 9–3 vote, with three members — Beth Hammack, Neel Kashkari and Lorie Logan — dissenting in favor of a 25bp hike, not a cut, under new Fed Chair Kevin Warsh. Markets are now pricing one to two possible hikes by year-end, per U.S. Bank — an unusually hawkish setup for a market that had just been through a chip-led correction. Separately, the Nasdaq-100 fell roughly 10% from its June record by July 29 on AI-capex skepticism, and semiconductors specifically entered a bear market before finding a sharp bid on July 30 following strong equipment-maker earnings.
📅 Inside the Sep-30-2026 window (Package A)
- Aug 26, 2026 — NVIDIA Q2 FY2027 earnings, the single largest sentiment catalyst for the AI-capex trade that drove July's correction (guidance was $91.0B ±2%, excluding China).
- Sep 15–16, 2026 — FOMC meeting with a full Summary of Economic Projections (dot plot) — the first complete quarterly projection round under Chair Warsh, who has already seen three colleagues dissent for a hike.
📅 Inside the Oct-16-2026 window (Package B — everything above, plus)
- Oct 2, 2026 — September Employment Situation report.
- Oct 14, 2026 — September CPI, the last inflation print before the late-October FOMC meeting and two days before this exact expiry.
- Mid-October 2026 — the opening days of Q3 corporate earnings season, when financial and industrial bellwethers typically report first, giving the market its first broad read on Q3 corporate health ahead of the mega-cap tech prints that follow later in the month.
Neither expiry spans the November 3, 2026 midterm elections — both packages resolve well before that date.
🧑💻 Four-Reader Interpretation
🚀 YOLO Trader
That "≈101:1" and "≈88:1" ratio is real, but it is a maximum payoff at one exact price on one exact date — not an expected value, not a probability, and definitely not "risk $32 to make $3,000." SPY has to land in a fairly narrow ≈$100-wide band by a hard deadline for any meaningful payout, and the implied-move cone above says the options market itself doesn't see that as likely. Trying to copy this trade retail-sized (buying a cheap wing without the offsetting sold body, for example) turns it into an entirely different, much worse bet. If you want convex downside exposure, study the shape, don't just chase the ratio.
📊 Swing Trader
The useful signal here isn't "SPY is going to crash" — it's that a sophisticated player is willing to pay real money for protection specifically in the $435–$635 zone through mid-October, right as the September FOMC dot plot and Q3 earnings season line up. That's a reasonable window to tighten stops or trim position size into, not a reason to short the index outright.
💰 Premium Collector
This trade is a reminder that someone, somewhere, is a natural buyer of the exact kind of tail protection that premium-selling strategies are structurally short. If you sell cash-secured puts or covered calls on SPY, this is the kind of flow that occasionally shows up as a bid under far-OTM puts even when nothing else is happening — worth knowing when you're pricing your own strikes.
🌱 Beginner
Don't worry about copying this trade — it requires $31.8M of capital and institutional-size access to floor-negotiated pricing that retail platforms don't offer. The lesson to take instead: big, scary-looking headline numbers ("$114M in puts sold!") can be completely wrong when a screenshot only captures part of a multi-leg trade. Always ask "is this the whole trade, and did I read the direction right?" before reacting to any options headline — including this one.
⚠️ Risk Factors & Honest Limits
What the tape proves, plainly: six legs, all in a 1×2×1 ratio, all against prior open interest of 425–5,778 contracts, all proven fresh opens, net debit of $14.85M (Sep) and $16.95M (Oct), maximum theoretical payout of $1.50B per package if SPY lands exactly on the body strike.
What is inferred, not proven: that the package is a long butterfly rather than a short one (an economic argument from the 100:1/88:1 risk asymmetry, not a tape-certain fact); that the motive is portfolio hedging rather than an outright directional bet (we cannot see any other position the buyer holds); and that this represents one buyer rather than one seller and one buyer meeting through a facilitating desk (floor trades match a counterparty, but customer identity is invisible to the tape).
What could go wrong with our read: if new information emerges that the per-leg side flags were in fact correct despite the poor economics, this would need to be revisited — though a ≈100:1 unfavorable risk/reward for a seller makes that scenario very unlikely. What we genuinely cannot know: the buyer's broker, account, or the rest of their book; whether this is one hedge or a piece of a much larger multi-asset hedging program; and whether it gets closed early if SPY rallies (only the next several sessions of open-interest data can answer that).
Standing risk disclosure: options trading involves substantial risk of loss and is not suitable for all investors. This analysis is for educational purposes only and is not financial advice. The trade profiled here required $31.8M of capital, institutional floor-block access, and a defined-risk structure most retail accounts cannot replicate at this size or pricing. Past option flow is not predictive of future price action — this is a description of one day's institutional positioning, not a forecast.
About SPDR S&P 500 ETF Trust (SPY): the original US ETF, launched January 1993, structured as a unit investment trust holding all ≈505 S&P 500 constituents, with ≈$789.1B in assets and a 0.09% expense ratio.
Last updated: 2026-08-03 — next-day OPRA open interest confirmed all six legs OPEN, ≈100% of print size on every one (1,050,000 contracts of new open interest).