🛡️ SPY $25.35M Crash-Insurance Butterfly — The Third Expiry of a Growing Program
📅 2026-08-03 | 🔥 Unusual Activity Detected
✅ UPDATE — August 4, 2026 pre-market: all three legs confirmed OPEN — and the position that appeared is TWICE the size that printed. Open interest rose +300,023 / +600,147 / +300,057 on the $380 / $500 / $620 puts against prints of 150,000 / 300,000 / 150,000 — exactly 2.00× on every leg, in the same 1:2:1 butterfly ratio. See the ✅ RESOLVED box for what that does and does not prove.
🎯 The Quick Take
A single desk just bought a $25.35 million put butterfly on the S&P 500 ETF, expiring 2026-11-20, structured as 150,000 × $620 puts BOUGHT, 300,000 × $500 puts SOLD, 150,000 × $380 puts BOUGHT — a textbook 1×2×1 long fly. This is not a one-off: it is the third consecutive monthly expiry carrying the exact same shape, following a Sep-30 635/535/435 fly (≈$14.85M) and an Oct-16 625/525/425 fly (≈$16.95M) put on 2026-07-31. Someone is laddering ≈$57M of deep, narrow crash convexity across September, October, and now November — a program, not a trade. This is insurance buying, not a crash forecast, and it pays out only inside a specific window, not on every move down.
🏛️ Fund Overview — SPY Isn't a Company
SPDR S&P 500 ETF Trust (SPY) tracks the S&P 500 Index and is the oldest and most heavily traded ETF in the US, launched 1993-01-22. It is structured as a unit investment trust (UIT) — not a modern 1940-Act open-end fund like its rivals IVV and VOO — meaning it must hold the index constituents exactly as specified and cannot reinvest dividends between quarterly payout dates.
| Metric | Value |
|---|---|
| Total net assets (AUM) | ≈$795.3B |
| Gross expense ratio | 0.0945% |
| Holdings | 504 securities |
| 52-week range | $625.58 – $760.40 |
| Average daily volume | ≈25.6M shares |
| 30-day SEC yield | 0.97% |
Top holdings (weight): NVIDIA 7.55%, Apple 7.04%, Microsoft 5.36%, Amazon 4.13%, Alphabet (A+C combined) 5.86%, Broadcom 2.86%, Meta 1.90%, JPMorgan 1.46%, Berkshire Hathaway 1.46%. The top 10 names alone are ≈37.6% of the fund.
Sector weights: Information Technology 36.60%, Financials 12.48%, Communication Services 9.91%, Consumer Discretionary 9.40%, Health Care 9.10%, Industrials 8.70%. Tech plus Communication Services alone is ≈46.5% of the index — which is exactly why the July semiconductor unwind knocked the whole ETF into its first July decline since 2014.
The UIT wrapper costs SPY a consistent ≈14-17 basis points a year versus the underlying index (cash drag from no dividend reinvestment, no securities lending) — a real cost for buy-and-hold investors, but irrelevant here. What matters for an options desk is that SPY's book is the deepest, most liquid listed options market on Earth, which is exactly the kind of size 150,000-lot legs need to clear in one print.
💰 The Trade — Buy the Wings, Sell the Body, 1×2×1
Floor-negotiated block, printed 10:25:46, spot $754.60. Three legs, one package.
| Time | Buy/Sell | Call/Put | Expiration | Strike | Size | Option Price | Premium | Prior OI | Option Symbol |
|---|---|---|---|---|---|---|---|---|---|
| 10:25:46 | BUY | PUT | 2026-11-20 | $620 | 150,000 | $3.57 | $53.55M | 719 | SPY 11/20 $620P |
| 10:25:46 | SELL | PUT | 2026-11-20 | $500 | 300,000 | $1.14 | $34.20M | 397 | SPY 11/20 $500P |
| 10:25:46 | BUY | PUT | 2026-11-20 | $380 | 150,000 | $0.40 | $6.00M | 968 | SPY 11/20 $380P |
🤝 FLOOR-NEGOTIATED BLOCK — not a sweep, not a cross. This traded manually on the floor with a known counterparty on the other side; there was no aggression against the lit book. Ratio: 1 × 2 × 1 — one wing, twice the body, one wing — the exact signature of a long butterfly. Net debit: $3.57 − (2 × $1.14) + $0.40 = $1.69/share = $25.35M paid.
Why we call this LONG, not short, even though the feed's own labels contradict each other: the raw feed tagged the $500 body as a BUY and the $620 wing as a SELL — which is internally inconsistent with any butterfly (a fly is always wings-same-direction, body-opposite). The economics settle it. Selling this structure means being short $120/share of maximum value — ≈$1.77B of risk — to collect $25.35M of premium. No rational seller takes that trade. Buying ≈$25M of deep, narrow crash convexity is a completely standard tail-hedge structure for a pension fund, insurer, or vol-targeting overlay. Confidence: HIGH on structure (the 1×2×1 ratio and net debit are tape fact), MEDIUM-HIGH on direction (the "long" call is an economic inference, not a labeled fact).
All three legs are PROVEN opens — 150,000-750,000 lots each against prior open interest of just 719 / 397 / 968 contracts. There is no ambiguity here about whether size exceeds OI; it exceeds it by 150-750×.
Package delta ≈ −564,000 shares. No offsetting equity block was found anywhere near the 10:25:46 print — the exposure is naked, not hedged with stock.
✅ RESOLVED — Next-Day OI Is In (August 4, 2026 pre-market)
The OPRA open-interest snapshot timestamped August 4, 2026 ≈06:30 ET reflects the close of business August 3 — the definitive open-vs-close test we flagged when this published. Here is what it says.
| Leg | Baseline OI (Aug-3 snap) | Resolving OI (Aug-4 snap) | Δ | Print size | Δ as % of print | Verdict |
|---|---|---|---|---|---|---|
| Nov-20-2026 $620 put (bought) | 719 | 300,776 | +300,057 | 150,000 | ≈200.0% | ✅ OPEN (BTO) |
| Nov-20-2026 $500 put (sold) | 397 | 600,544 | +600,147 | 300,000 | ≈200.0% | ✅ OPEN (STO) |
| Nov-20-2026 $380 put (bought) | 968 | 300,991 | +300,023 | 150,000 | ≈200.0% | ✅ OPEN (BTO) |
The open is proven beyond any doubt. All three strikes were near-empty before August 3 (397 to 968 contracts) and now carry 300,000 to 600,000. This is unambiguously a new crash-insurance butterfly, exactly as published — the third expiry of the program the article described.
📌 The anomaly worth flagging: the open interest created is exactly double what printed
Every leg came in at 2.00× its print size, and the 1:2:1 butterfly ratio held perfectly across the doubling. That is not a rounding artifact and it is not a data problem with the symbol or expiry — we checked seven other SPY November-20 strikes over the same two snapshots, and every one of them moved normally (open interest changes of −20 to +162 contracts against their own volumes). The doubling appears only at the three strikes of this structure.
What the tape says, independently: consolidated OPRA volume at those strikes on August 3 was 150,087 / 300,233 / 150,070 contracts — matching the printed package almost exactly, with no second block visible anywhere in the session.
So the two facts are in tension, and we are not going to paper over it. Open interest cannot rise by more than the contracts that trade — unless positions were created through a channel that never reached the consolidated tape. The most plausible explanation (inferred, not proven) is that a second, identical package was cleared off-tape — a clearing-only transfer or a give-up allocated across accounts — so the position registered at the clearinghouse is twice what the public tape shows.
What this means for a reader:
- Proven: the butterfly is newly opened, at all three strikes, in the correct ratio.
- Proven: the position now standing at those strikes is ≈2× the $25.35M package described in this article — roughly 300,000 / 600,000 / 300,000 contracts of crash insurance, not 150,000 / 300,000 / 150,000.
- Not proven: how the second half got there, or whether it belongs to the same buyer. OPRA shows contracts, not accounts, and it shows no second print.
- Unchanged: every strike level, breakeven, and payoff shape in the analysis below. Only the scale is larger.
🤓 What This Actually Means — Plain English
Think of a put butterfly as insurance with a very specific address. You're not just betting the market falls — you're betting it falls to a particular level, by a particular date, and stays roughly there. Here's the shape:
- Buy 1 put at $620 (the "far-from-danger" wing, ≈17.8% below spot) — this is your base insurance policy.
- Sell 2 puts at $500 (the body, ≈33.7% below spot) — you collect a big premium here to help pay for the $620 puts, but in exchange you cap how much protection you get.
- Buy 1 put at $380 (the "deep crash" wing, ≈49.6% below spot) — this caps your risk on the short $500 puts, so you can never lose more than the $25.35M you paid.
The payoff only works if SPY lands near $500 by 2026-11-20. Here's the actual math per the full 150,000-contract package (15 million shares of notional per leg), net of the $25.35M cost:
| SPY at expiry (Nov 20) | Payoff per share | Total package P&L |
|---|---|---|
| $720 (near current highs) | $0 | −$25.35M (max loss — full premium gone) |
| $620 (upper wing) | $0 | −$25.35M (max loss — exactly at the wing, worthless) |
| $500 (the body — MAX PAYOUT) | $120.00 | +≈$1.77B (the 71:1 headline number) |
| $440 (halfway between body and lower wing) | $60.00 | +≈$875M |
| $380 (lower wing) | $0 | −$25.35M (max loss — worthless again) |
Notice the shape: the payoff is a tent, not a ramp. It rises from zero at $620, peaks hard at $500, then falls back to zero at $380. A crash that overshoots all the way through $380 pays this position nothing — same outcome as no crash at all. That is the single most important thing to understand about the "≈71:1" number that will get thrown around: it is the max ratio at one exact price, not a probability-weighted expectation. Most of the possible outcomes on this trade — SPY flat, up, or down-but-not-to-$500 — lose the full $25.35M.
What this tells us about the buyer's thinking: they are not calling for a specific crash target. They're buying protection cheaply by financing the far-OTM $620 puts with premium collected from selling $500 puts they consider unlikely to matter much either way, while the $380 wing caps their worst case. It's a classic pension/tail-fund structure — cheap, capped, laddered across months so the "address" of the insurance keeps rolling forward in time.
📈 Technical Setup
YTD Chart
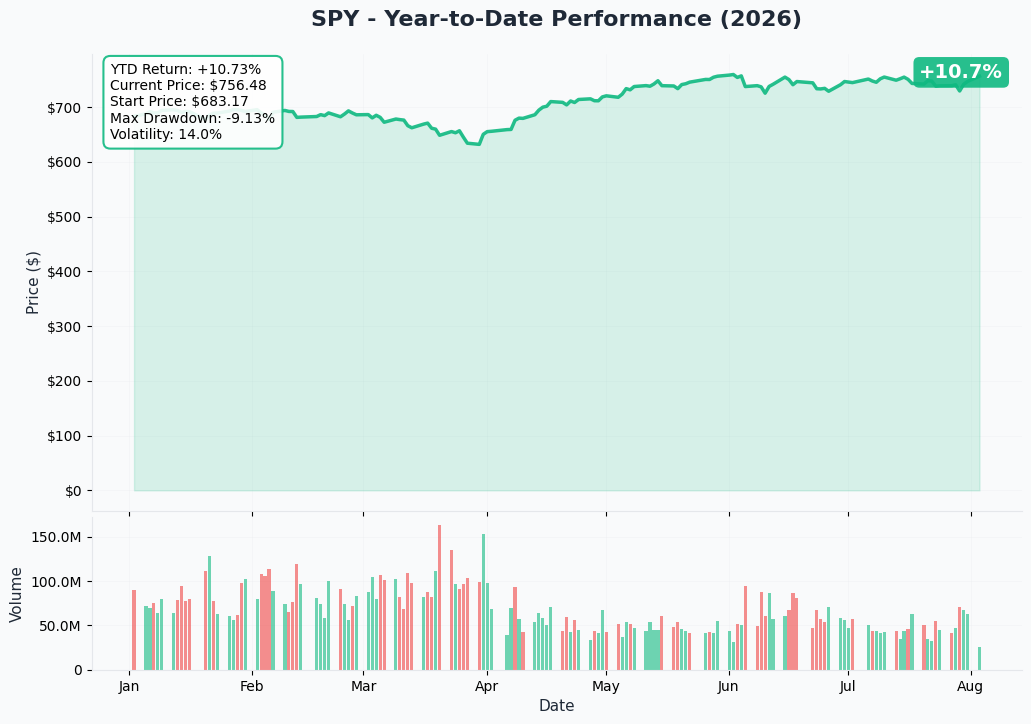
SPY closed out a rough July — its first July decline since 2014 — driven by a semiconductor unwind, then rallied hard off the 2026-07-29 hawkish Fed hold, sitting today just ≈0.6% below its 52-week high of $760.40. The 52-week range is $625.58-$760.40 — worth noting that the low of that range ($625.58) sits almost exactly on top of the near wing of last week's Oct-16 fly ($625), underlining how these butterflies are being placed at levels the index has actually visited in the past year, not fantasy strikes.
Gamma-Based Support & Resistance
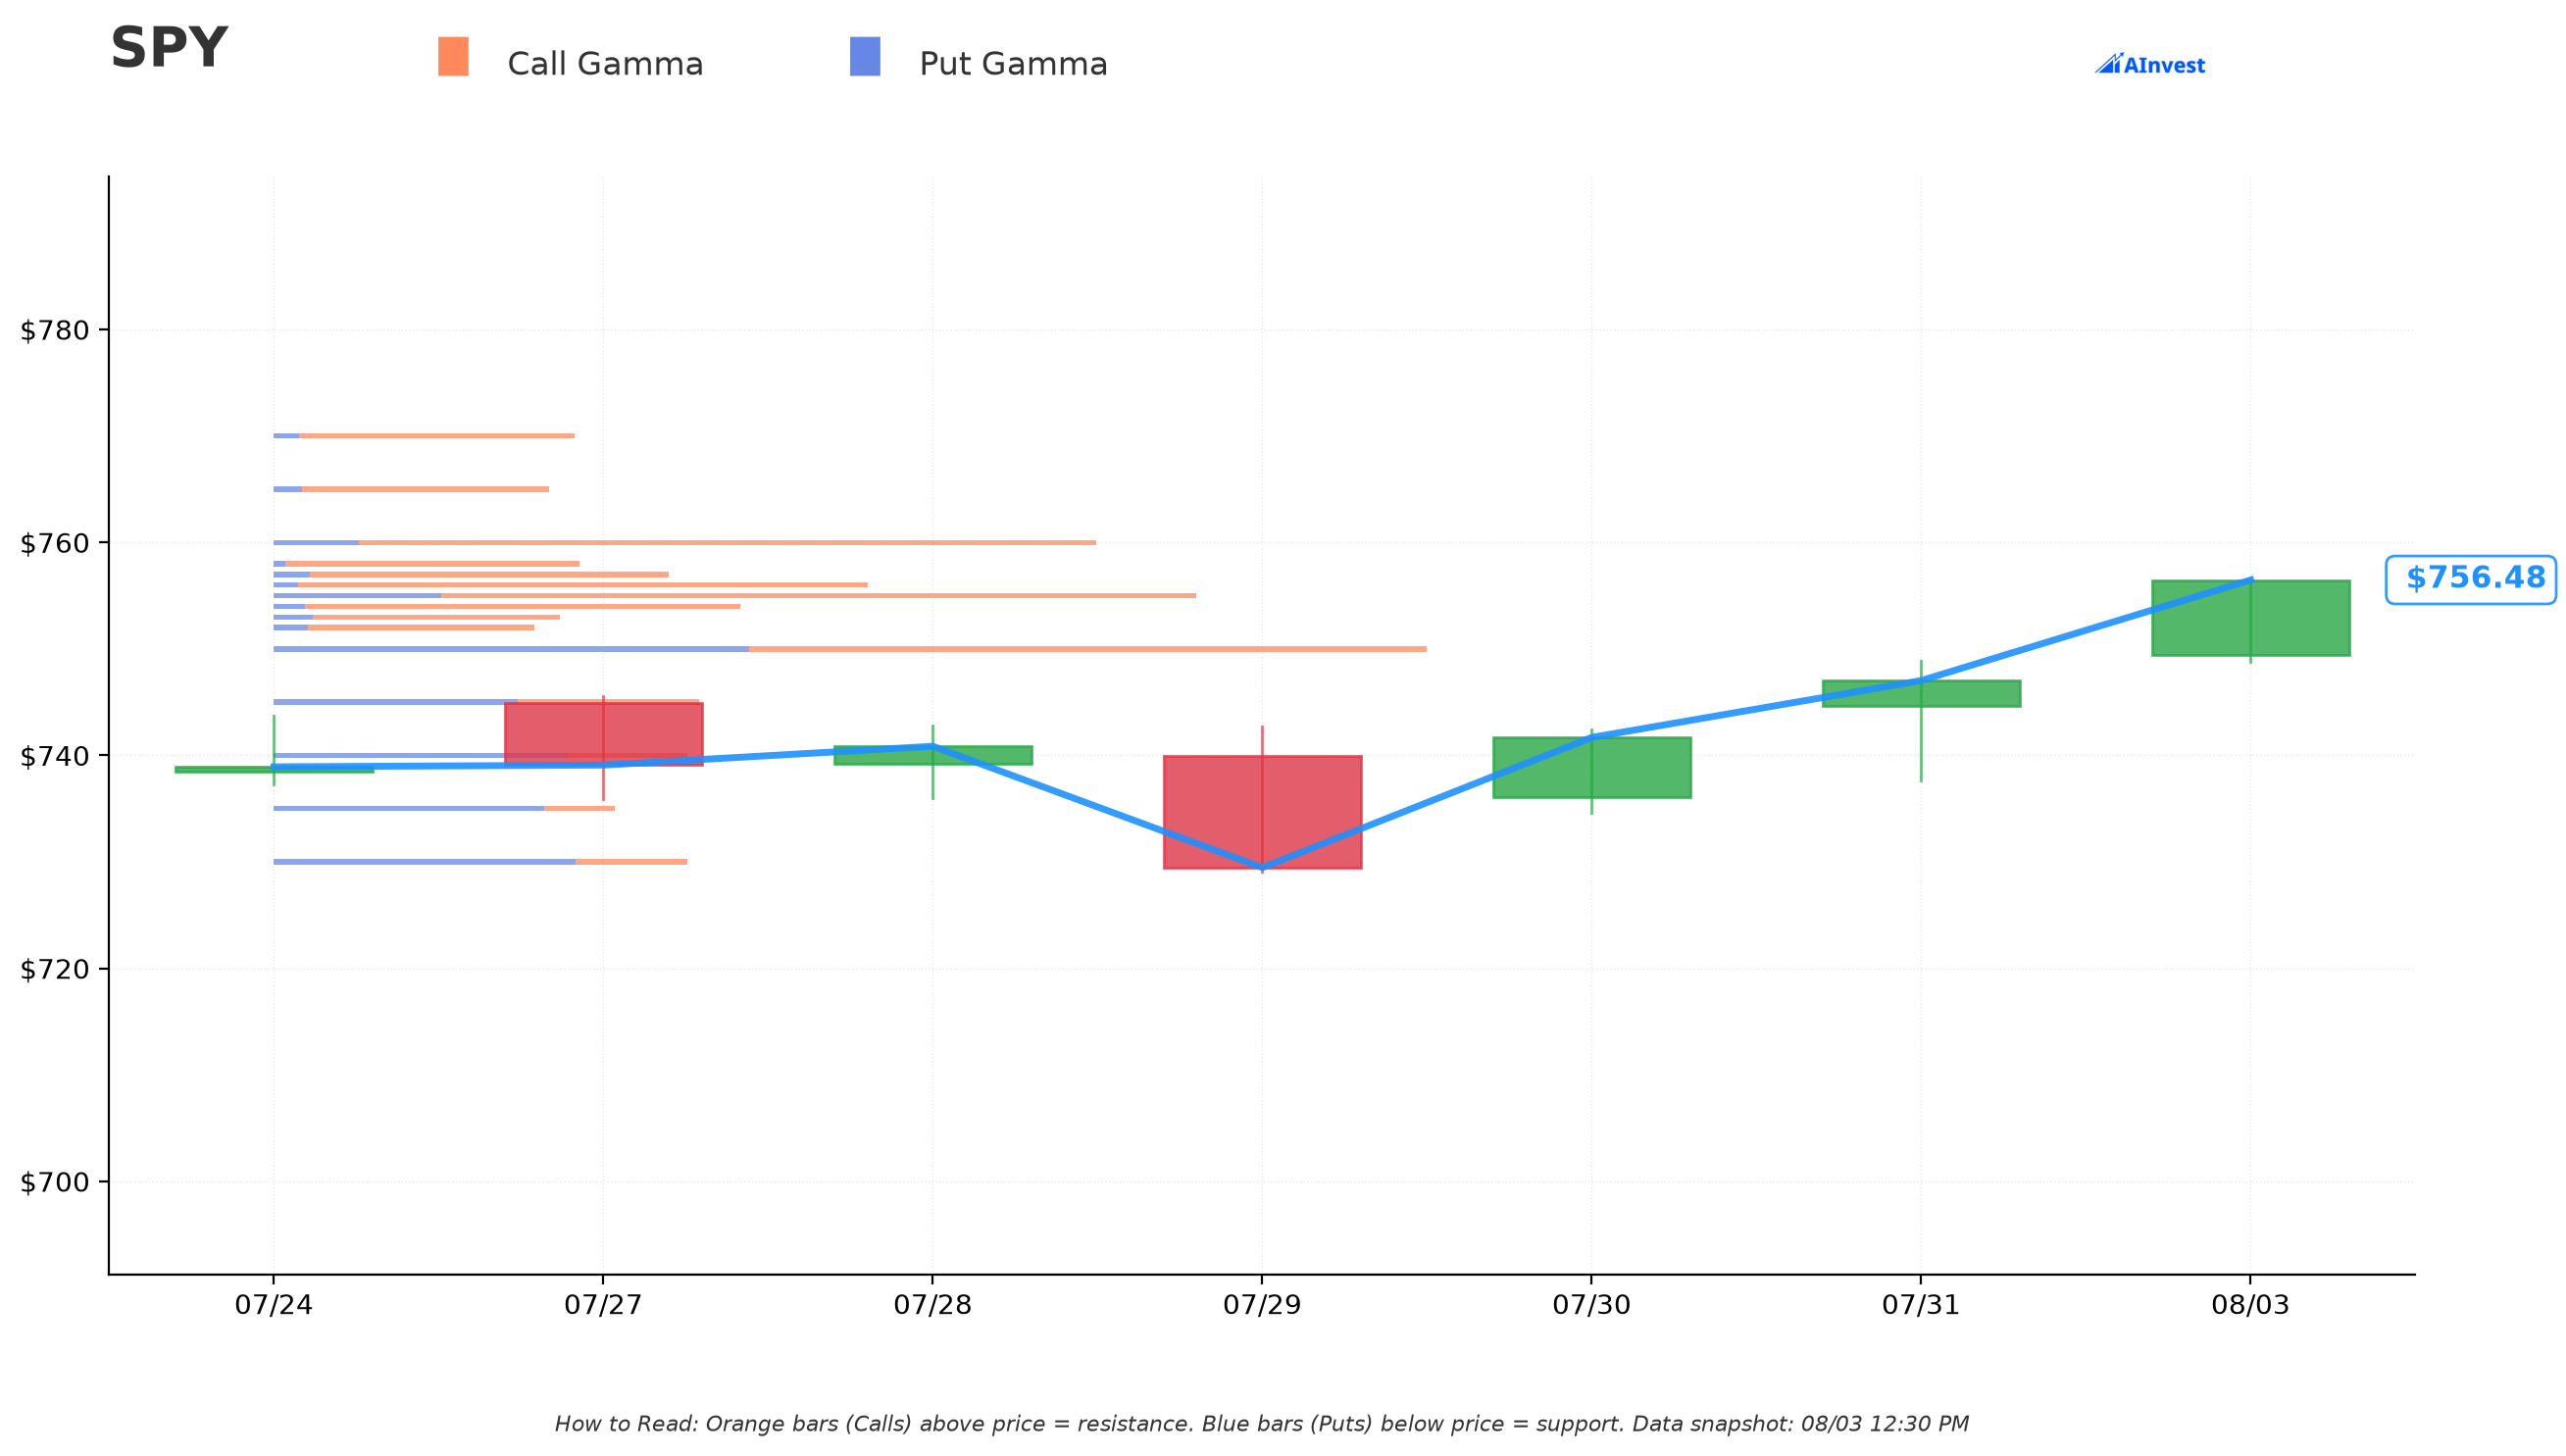
Dealer gamma is concentrated tightly around spot: $750 is the strongest nearby support (Very Strong, total GEX ≈417), and $760 is the strongest nearby resistance (Very Strong, total GEX ≈295), with secondary resistance building at $800 and $810. That's the market's near-term structure — completely different terrain from where this butterfly lives. At the fly's own strikes, today's gamma map shows $620 carrying only ≈11.7 total GEX (put-dominated, 18.0% below spot) and $500 carrying just ≈1.9 total GEX (33.9% below spot) — there's essentially no dealer hedging flow at these levels yet. That's normal for a fresh, far-dated structure: the gamma only starts to matter as expiry approaches and/or spot actually migrates toward the strikes.
Implied Move — Does the Market Even Price a Move to $500?
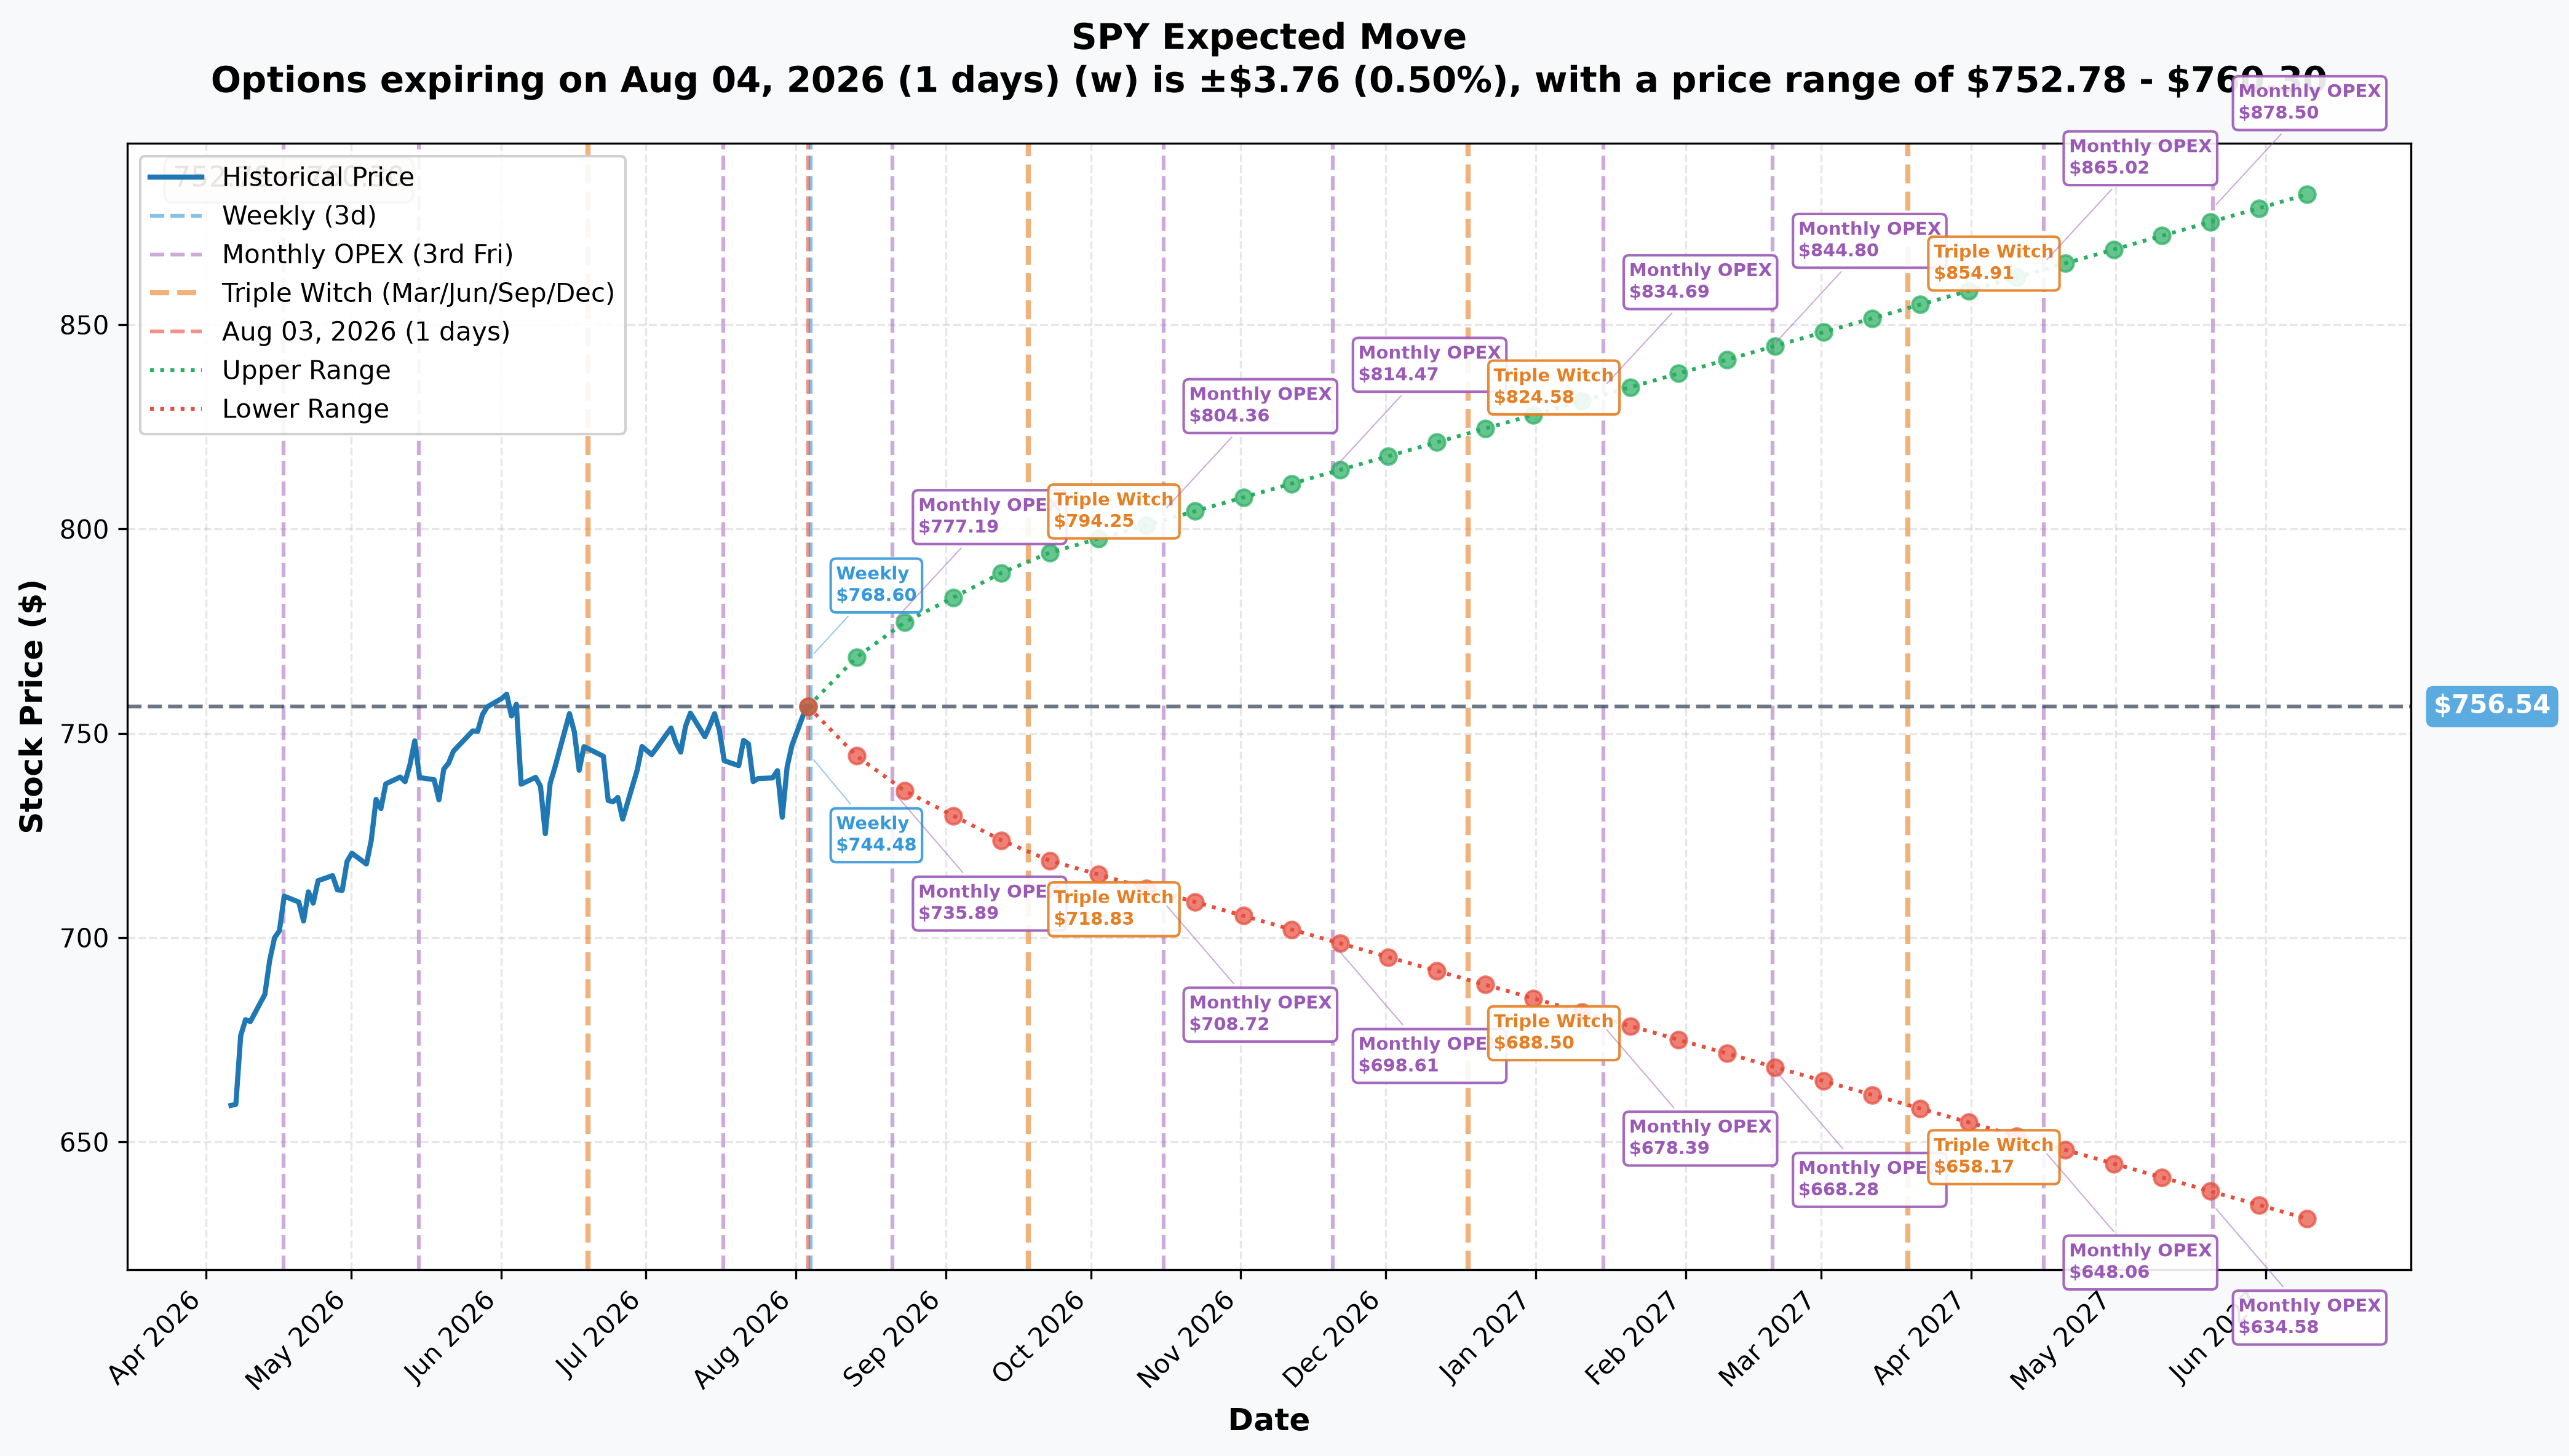
This is the reality check. The 2026-11-20 OPEX implied-move cone — the options market's own 1-sigma-ish range for where SPY lands by that date — spans $698.61 to $814.47. That means the market-implied range for November expiry doesn't even reach the $620 upper wing, let alone the $500 body or the $380 lower wing. By the market's own current pricing, this butterfly's entire payoff zone sits outside the range options are pricing as a "normal" move. That's exactly what you'd expect from a genuine tail hedge: it's not supposed to be probable, it's supposed to be cheap and there in case something the market isn't currently pricing actually happens.
🎪 Catalysts — Mapped to the 2026-11-20 Expiry
Everything below lands INSIDE the trade (before Nov 20) unless marked otherwise.
- 2026-08-26 — NVIDIA Q2 FY2027 earnings. At 7.55% of SPY, this is functionally an SPY event on its own — a 10% single-day NVIDIA move is roughly 75 bps of the index. Comes right after a July in which the semiconductor complex fell double digits on GPU-oversupply fears.
- 2026-09-15/16 — FOMC meeting with a new Summary of Economic Projections. After the 2026-07-29 hawkish hold (9-3 vote, all three dissenters wanting a hike), markets price roughly 57% odds of a September rate hike per Reuters — the first genuine tightening surprise risk since 2022.
- 2026-09-18 — Triple witching + S&P 500 quarterly rebalance. SPX/SPY options expire, ES futures settle, and rebalance flows converge in one session.
- 2026-10-13 onward — Q3 2026 earnings season, kicked off by JPMorgan Chase's Q3 report, running through the mega-cap reports (Apple, Microsoft, Alphabet, Amazon, Meta) in late October — collectively a large chunk of SPY's weight reporting inside a roughly two-week window.
- 2026-10-27/28 — Second FOMC meeting, a further live hike opportunity if September holds steady.
- 2026-11-03 — US midterm elections. All 435 House seats and 35 Senate seats contested, landing just 17 days before expiry — forecasters see Democrats favored for the House (≈76%) with the Senate close to a coin flip, i.e. divided government as the modal (historically calm) outcome, but a contested or delayed result would be the worst-timed volatility event for this structure.
- ≈2026-11-18 (unconfirmed) — NVIDIA's Q3 FY2027 earnings, which would land just two days before expiry if it follows NVIDIA's historical November reporting pattern.
Everything below lands AFTER Nov 20 — outside this specific trade:
- 2026-12-08/09 FOMC (the year's final meeting)
- 2026-12-18 triple witching + December rebalance
- December CPI/PCE prints and year-end index reconstitution
The desk chose a window that captures two live FOMC hike decisions, the entire Q3 earnings season, a NVIDIA earnings print, and the midterms, while cleanly excluding the December FOMC. That's a deliberate calendar choice, whatever the underlying portfolio being hedged.
👥 Four Ways to Read This
🎰 YOLO Trader
The "≈71:1" number is real math, but it is the payout at one exact price on one exact date — not an expected value, and not a coin-flip bet you can just copy in size. If you buy this exact structure and SPY does anything except land close to $500 by November 20, you lose the whole premium. Trading a scaled-down version of this fly is a legitimate way to speculate on a sharp-but-contained pullback with capped risk, but do not mistake the headline ratio for realistic odds — most of the price paths between here and November lose money on this trade.
📊 Swing Trader
The interesting signal here isn't direction, it's structure discipline: a professional book adding the same shape at a new expiry every 30-45 days, always roughly 18%/34%/50% below spot. That's a hedging cadence, not a trading signal to fade or follow SPY itself. Worth tracking whether the September and October flies get closed or rolled as they approach expiry — that tells you more about institutional risk appetite than trying to trade the fly's strikes directly.
💰 Premium Collector
There's a mirror-image idea buried in here: this desk is comfortable selling $500-strike SPY puts (300,000 of them) because they consider a 33.7% one-quarter crash unlikely enough to finance the wings with. A retail trader running a much smaller cash-secured put or credit spread near strikes this far OTM is implicitly making the same bet the pros are making on the short leg — just without the expensive tail hedge wrapped around it. Size and margin requirements for anything near these strikes should be sized conservatively; a 33% SPY drawdown is rare but not impossible.
🌱 Beginner
This is a good real-world example of "insurance," not "prediction." Someone spent $25.35 million essentially buying a policy that only pays out if the market falls hard, lands in a specific zone, and does so by a specific date — and they expect to lose that $25.35M in most outcomes, the same way you expect to lose your car insurance premium most years. It is not a signal that a crash is coming; professional funds carry this kind of protection routinely, the same way homeowners carry fire insurance without expecting a fire.
⚠️ Risk Factors and Honest Limits
- We cannot see the portfolio this may be hedging. The tape shows the options trade and nothing else — no equity block was found nearby to explain the −564,000 share package delta. This could be protecting a large long-equity book, a structured product, or something else entirely; we don't know, and we're not claiming to.
- Our "long" call is an economic inference, not a tape fact. The feed's own BUY/SELL labels on the legs contradict a coherent butterfly reading; we resolved that using the economics (nobody rationally risks $1.77B to collect $25.35M), which is a strong argument but still an inference, not proof from the print itself.
- The payoff zone is narrow. As shown above, SPY needs to land close to $500 by November 20 for this to pay meaningfully — it does not profit from "any crash," only a crash of a particular size, and it profits nothing if SPY overshoots below $380.
- All three legs are proven opens, which removes the open/close ambiguity that complicates some other trades — but proven-open still doesn't tell us intent, and doesn't tell us whether this position gets closed early for a partial profit/loss well before expiry.
- Concentration risk in SPY itself matters here too: at 36.60% Information Technology weight and NVIDIA alone at 7.55%, a single sector shock (as happened in July) can move the underlying sharply — which is precisely the kind of event this structure is built to survive, or profit modestly from, depending on magnitude.
- Options trading, especially multi-leg structures at this size, involves substantial risk and is not suitable for most retail portfolios in anything resembling this notional. This analysis is for informational purposes only and is not financial advice.
About SPDR S&P 500 ETF Trust (SPY): the oldest and most liquid US-listed ETF, a unit investment trust tracking the S&P 500 Index, with ≈$795B in assets and a 0.0945% expense ratio.
Last updated: August 4, 2026 — next-day OPRA open-interest resolution added (✅ RESOLVED box above). Original analysis published August 3, 2026.