🎯 SPY $87.1M in Call Buying: The $71.2M Floor Package Was Part Short-Covering, Not All Fresh Length
📅 August 4, 2026 | 🔥 Unusual Activity Detected 🔄 Last updated: 2026-08-05 — the next-day OI snapshot inverted the read on the Aug-21 $775 leg. See the ✅ RESOLVED box below.
🎯 The Quick Take
At 14:00:35 ET, spot $771.35, nine prints hit the tape in one burst — all stock-plus-options floor packages, all expiring August 21, 2026. Six prints bought 55,272 contracts of the $775 call for a weighted $7.7969 ($43,094,914), and three prints bought 71,854 contracts of the $785 call for a weighted $3.9100 ($28,094,914). Combined: a $71,189,828 net debit carrying roughly +3,965,665 shares of delta-equivalent exposure — about $3.06 billion. Add this morning's $15,918,400 Aug-14 $775 call buy (still standing, unchanged, detailed below) and SPY's total flow for the day comes to $87,108,228 — by far the largest single-name commitment on the board today.
This is now the story. Below we correct three widely reported figures that the tape contradicts, lay out the honest gap in what the tape can prove, and walk through both trades in full. 👀
🔄 Updated 2026-08-05: the next-day OPRA open-interest snapshot has landed and it inverted the read on the Aug-21 $775 leg. Open interest at that strike fell 26,302 contracts, which means that $43.1M leg was a buy-to-close — a short call position being covered — not the fresh directional buying described below. The $785 leg and the morning's Aug-14 trade both confirmed as clean opens. Full numbers in the ✅ RESOLVED box.
🏢 Company Overview
SPY is the SPDR S&P 500 ETF Trust, the oldest and most heavily traded ETF in the world, tracking the S&P 500 index across 505 holdings. It runs on a razor-thin 0.09% expense ratio and pays a 0.98% dividend yield (Finviz SPY). Assets under management sit between $789.06B and $803.84B depending on the source (StockAnalysis, Finviz).
Its top five holdings — AAPL (7.64%), NVDA (7.37%), MSFT (5.23%), AMZN (3.60%), and GOOGL (3.05%) — make up ≈26.9% of the fund (StockAnalysis SPY). That concentration matters: a 10% move in NVDA alone is worth roughly 0.74% of SPY before any sympathy move in the rest of the AI trade. SPY's options market is the deepest listed equity-derivatives venue in the world, so liquidity is never the concern here — the mechanism of how these prints filled is.
💰 The Option Flow Breakdown
🥇 Trade 2 — The $71.2M Package (August 21 expiry) — THE LEAD STORY
🔨 Flow tag: STOCK-PLUS-OPTIONS FLOOR PACKAGE — negotiated on the exchange floor, not a lit sweep.
| Field | $775 CALL | $785 CALL |
|---|---|---|
| Time | 14:00:35 ET (burst) | 14:00:35 ET (burst) |
| Buy/Sell | BUY | BUY |
| Call/Put | CALL | CALL |
| Expiration | 2026-08-21 | 2026-08-21 |
| Strike | $775 | $785 |
| Weighted Option Price | $7.7969 | $3.9100 |
| Size | 55,272 contracts (6 prints) | 71,854 contracts (3 prints) |
| Premium | $43,094,914 | $28,094,914 |
| Prior Open Interest | 82,982 | 4,062 |
| Spot at print | $771.35 | $771.35 |
| Option Symbol | SPY20260821C775 | SPY20260821C785 |
| Delta | 0.4086 | 0.2376 |
| Strike vs spot | ≈+0.5% above spot | ≈+1.8% above spot |
| Breakeven | $782.80 | $788.91 |
| Status | 🔄 RESOLVED: CLOSE (BTC) — OI fell 26,302 | ✅ PROVEN OPEN (BTO) — OI rose 75,443 |
NET: $71,189,828 debit. Combined delta-equivalent shares ≈3,965,665 ≈ $3.06B of upside exposure. Days to expiry: 17.
🥈 Trade 1 — The Morning's $15.9M Opener (August 14 expiry) — unchanged from this morning
🔨 Flow tag: PRICE-IMPROVEMENT AUCTION — a worked block, not a block cross and not a lit sweep.
| Field | Detail |
|---|---|
| Time | 11:07:39 ET |
| Buy/Sell | BUY |
| Call/Put | CALL |
| Expiration | 2026-08-14 |
| Strike | $775 |
| Option Price | $3.20 |
| Size (this print) | 49,745 contracts |
| Premium | $15,918,400 |
| Day volume, this contract | 85,000 |
| Prior Open Interest | 2,721 |
| Spot at print | $766.73 |
| Option Symbol | SPY20260814C775 |
| Delta | 0.2945 |
| Delta-equivalent shares | ≈1,464,990 |
| Notional upside exposure | ≈$1.12B |
| Strike vs spot | +1.1% above spot |
| Days to expiry | 10 |
| Breakeven | $778.20 (+1.50% from print spot) |
SPY total, both trades: $87,108,228.
Worth noting, not over-claiming: Trade 1's Aug-14 $775 call and Trade 2's Aug-21 $775 call are the same strike, one week apart in expiry. That's a pattern worth flagging — repeated interest at $775 — but we cannot prove it's the same trader or desk, and we're not going to claim it is.
🚨 Three Reported Figures the Tape Contradicts on Trade 2 — corrected here, plainly
This is the honest core of today's piece. The figures circulating on this trade contained real errors, and they matter:
- The $775 call's prior open interest was reported as
5. The real figure, from the OPRA tape, is 82,982. That single error flips the entire read. At an OI of 5, the 55,272-contract print would be a slam-dunk new position. At the real OI of 82,982, the print sits below existing open interest — and open vs close genuinely cannot be proven from size alone. This is exactly why we never trust a quoted open-interest figure and always pull the tape directly. - Five prints were reported. The real tape shows nine — six prints totaling 55,272 contracts at $775, three prints totaling 71,854 contracts at $785, against the reported 46,296 and 64,669.
- The "ABOVE ASK" label does not mean aggression here. The prints landed 367%–600% across the bid-ask spread — a $7.80 print against a $7.60 lit ask on the $775, a $3.91 print against a $3.75 lit ask on the $785. On a normal lit trade that would scream urgency. But this is a stock-plus-options package — the option leg gets priced as part of the whole negotiated trade, not against the standalone lit market, so a per-leg aggressor reading is unreliable here. The real confirmation: implied volatility barely moved through the prints (+0.08% on the $775, −0.20% on the $785) — that is not what happens when someone actually consumes real displayed depth. Displayed size at the time was just 22 contracts (bid) and 149 contracts (offer) against prints of 26,618 and 50,298 contracts respectively. This was arranged, not chased.
🕳️ The Honest Gap — the hedge leg we could not find
These are stock-plus-options packages by definition — a non-option leg exists on the other side. We looked for it and could not find it. The equity tape in the surrounding minute shows zero qualified-contingent stock prints and only 362,008 total shares traded in SPY, against a delta-equivalent exposure of ≈3,965,665 shares from the options alone. That's a massive gap — roughly 11x more delta than the visible stock tape can account for.
So one of three things is true: the hedge was executed somewhere else entirely (index futures are the obvious candidate — they don't show up on the SPY equity tape), it was spread out over a longer window than we captured, or it is only a partial hedge. We do not know which, and we're not going to guess. This matters for how you read the trade: if the delta is fully hedged elsewhere, this reads as a volatility/convexity purchase, not a directional bet. If it isn't hedged, it's ≈$3.06 billion of naked upside exposure. Do not assert which one this is — the tape doesn't tell us.
🔄 ✅ RESOLVED — The $775 Leg Came In DOWN. This Was Partly Short-Covering.
Updated Wednesday, 2026-08-05, pre-market. The ≈06:30 ET OPRA open-interest snapshot (reflecting the August 4 close) has published. We said we'd flag it plainly either way — here it is.
| Leg | Baseline OI (Aug-4 snap) | Resolving OI (Aug-5 snap) | Δ | Print size | Day volume | Verdict |
|---|---|---|---|---|---|---|
| Aug-21-2026 $775 C (bought) | 82,982 | 56,680 | −26,302 | 55,272 | 76,709 | 🔄 CLOSE (BTC) — INVERSION |
| Aug-21-2026 $785 C (bought) | 4,062 | 79,505 | +75,443 | 71,854 | 80,463 | ✅ OPEN (BTO) — as published |
| Aug-14-2026 $775 C (bought) | 2,721 | 87,968 | +85,247 | 49,745 | 144,577 | ✅ OPEN (BTO) — as published |
The Aug-21 $775 leg inverted, and this is the outcome the article flagged as story-changing. Open interest at that strike fell by 26,302 contracts. Contracts are only destroyed when the buyer and the seller are both closing — so this $43.1M leg was a buy-to-close: someone covering an existing short call position, not opening fresh upside.
Be precise about magnitude. Day volume at the strike was 76,709 against a 55,272-contract print, which bounds the package's own contribution to somewhere between −4,865 and −47,739 contracts, with a central estimate around −26,302 (≈48% of the print). So roughly half the print provably destroyed open interest and the rest paired against opening counterparties. The sign is not in doubt — this leg was net closing.
What changes, and what doesn't:
- What changes: "$71.2M of fresh directional call buying" is wrong for the $775 leg. Only the $785 leg ($28.1M, 71,854 contracts, +75,443 OI) is genuinely new long-call exposure. The market did not gain ≈3.97M shares of new delta-equivalent length from this package — a large part of it was an existing short position being retired.
- What doesn't change: the direction of the desk's own repositioning is still bullish. Covering a short $775 call and opening a long $785 call both move the same way. Their book got materially longer; the market's aggregate open call exposure did not grow anything like the headline suggests.
- A partial answer to the missing-hedge puzzle. The article flagged that ≈3.97M shares of delta had no visible offsetting stock leg. If the $775 short being covered here was already hedged when it was established, no fresh hedge would need to print for that leg today. That is a plausible explanation, and it is inference, not proof — the equity/futures tape still does not show us the hedge either way.
The morning's Aug-14 $775 buy and the Aug-21 $785 buy both confirmed as clean opens — the $785 strike gained more open interest than the print itself, and the Aug-14 strike gained 85,247 against a 49,745-contract print.
🤓 What This Actually Means — Plain English
Start with what's proven. The $785 call leg (71,854 contracts, $28.1M) is a clean new position — prior OI was only 4,062, so this is real fresh buying, full stop. The $775 call leg (55,272 contracts, $43.1M) was the harder one on trade day: prior OI of 82,982 meant a large existing crowd already sat in that strike, and the print landed inside that crowd rather than dwarfing it. The next-day snapshot answered it: some of that existing crowd was closing out. Open interest fell 26,302, so this leg was a buy-to-close — a short being covered — not new money joining the strike. See the RESOLVED box above; the practical translation is that of the $71.2M package, only the $28.1M $785 leg is genuinely new upside exposure.
"Stock-plus-options floor package" is not a sweep and not a cross. It means the trade was negotiated on the exchange floor as a combined unit — options plus (in theory) an offsetting stock or futures position — rather than typed into the lit book contract by contract. Nobody was "slamming the offer" here; despite the ABOVE-ASK label, the flat implied volatility tells you nobody consumed real displayed liquidity to get this done. It was arranged.
The gap matters more than the premium number — and it got smaller. $71.2 million is real money, and the headline number behind it was ≈$3.06 billion of delta-equivalent exposure against only 362,008 shares of stock in the same window. The next-day OI print shrinks the puzzle considerably: the $775 leg was covering an existing short, so a large share of that delta was never new exposure needing a new hedge — it was old exposure being retired, most likely already hedged when it was put on. What remains genuinely new is the $785 leg's ≈1.71M shares of delta-equivalent length. Whether that is hedged through futures we can't see is still unknown, and we're not going to guess. But "≈$3.06 billion of naked upside exposure" is no longer a fair characterization of this package.
Why 17 days is the frame, and why the window matters. August 21 expiry gives this trade room to breathe compared to the morning's 10-day Aug-14 bet. Inside that window sit four confirmed catalysts: the August 7 jobs report, August 12 CPI, August 13 PPI, and the August 19 FOMC minutes. Outside the window: the September 15–16 FOMC meeting itself, NVIDIA's estimated August 26 earnings, and the November 3 midterms — none of those can move this position before it expires.
📈 Technical Setup / Chart Check-Up
YTD Chart
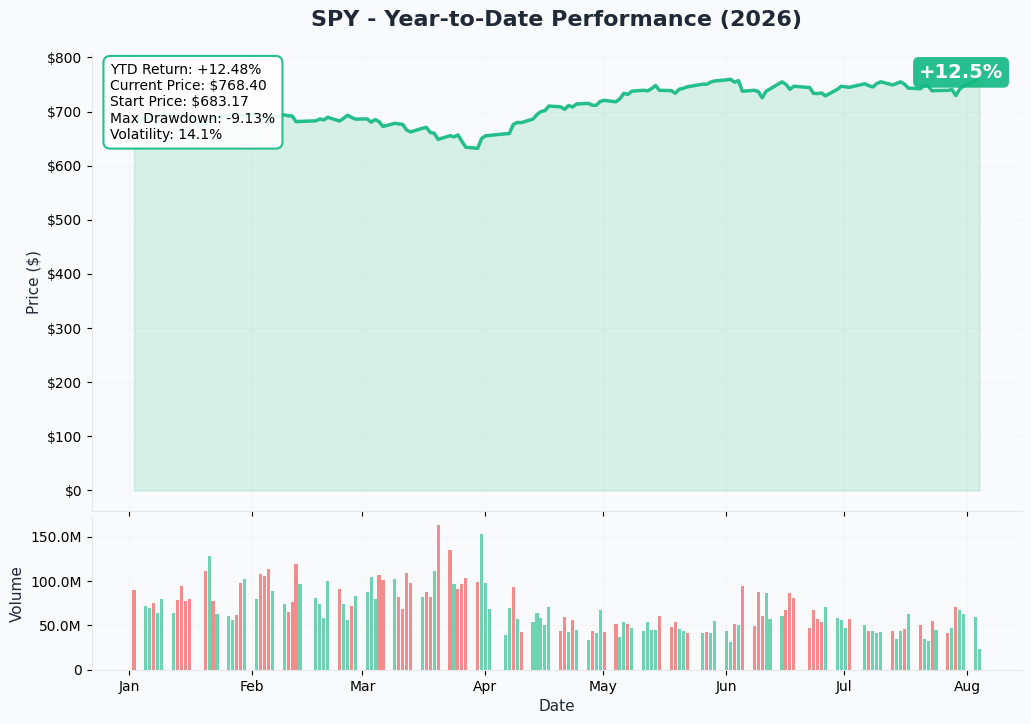
SPY's 1-year chart shows a +12.5% climb, and by the afternoon of August 4 the ETF traded at $768.57, up 1.44% on the day and sitting at or fractionally above its 52-week high (Finviz SPY). Year-to-date the fund is up +12.71% on price (Finviz SPY). The rally accelerated on Treasury Secretary Bessent's comment that a Strait of Hormuz deal is near, layered on top of strong mega-cap earnings from GOOGL, MSFT, AAPL and AMZN (Finviz news). By the time Trade 2 printed at 14:00:35 ET, spot had continued higher to $771.35.
🌈 Gamma-Based Support & Resistance Analysis
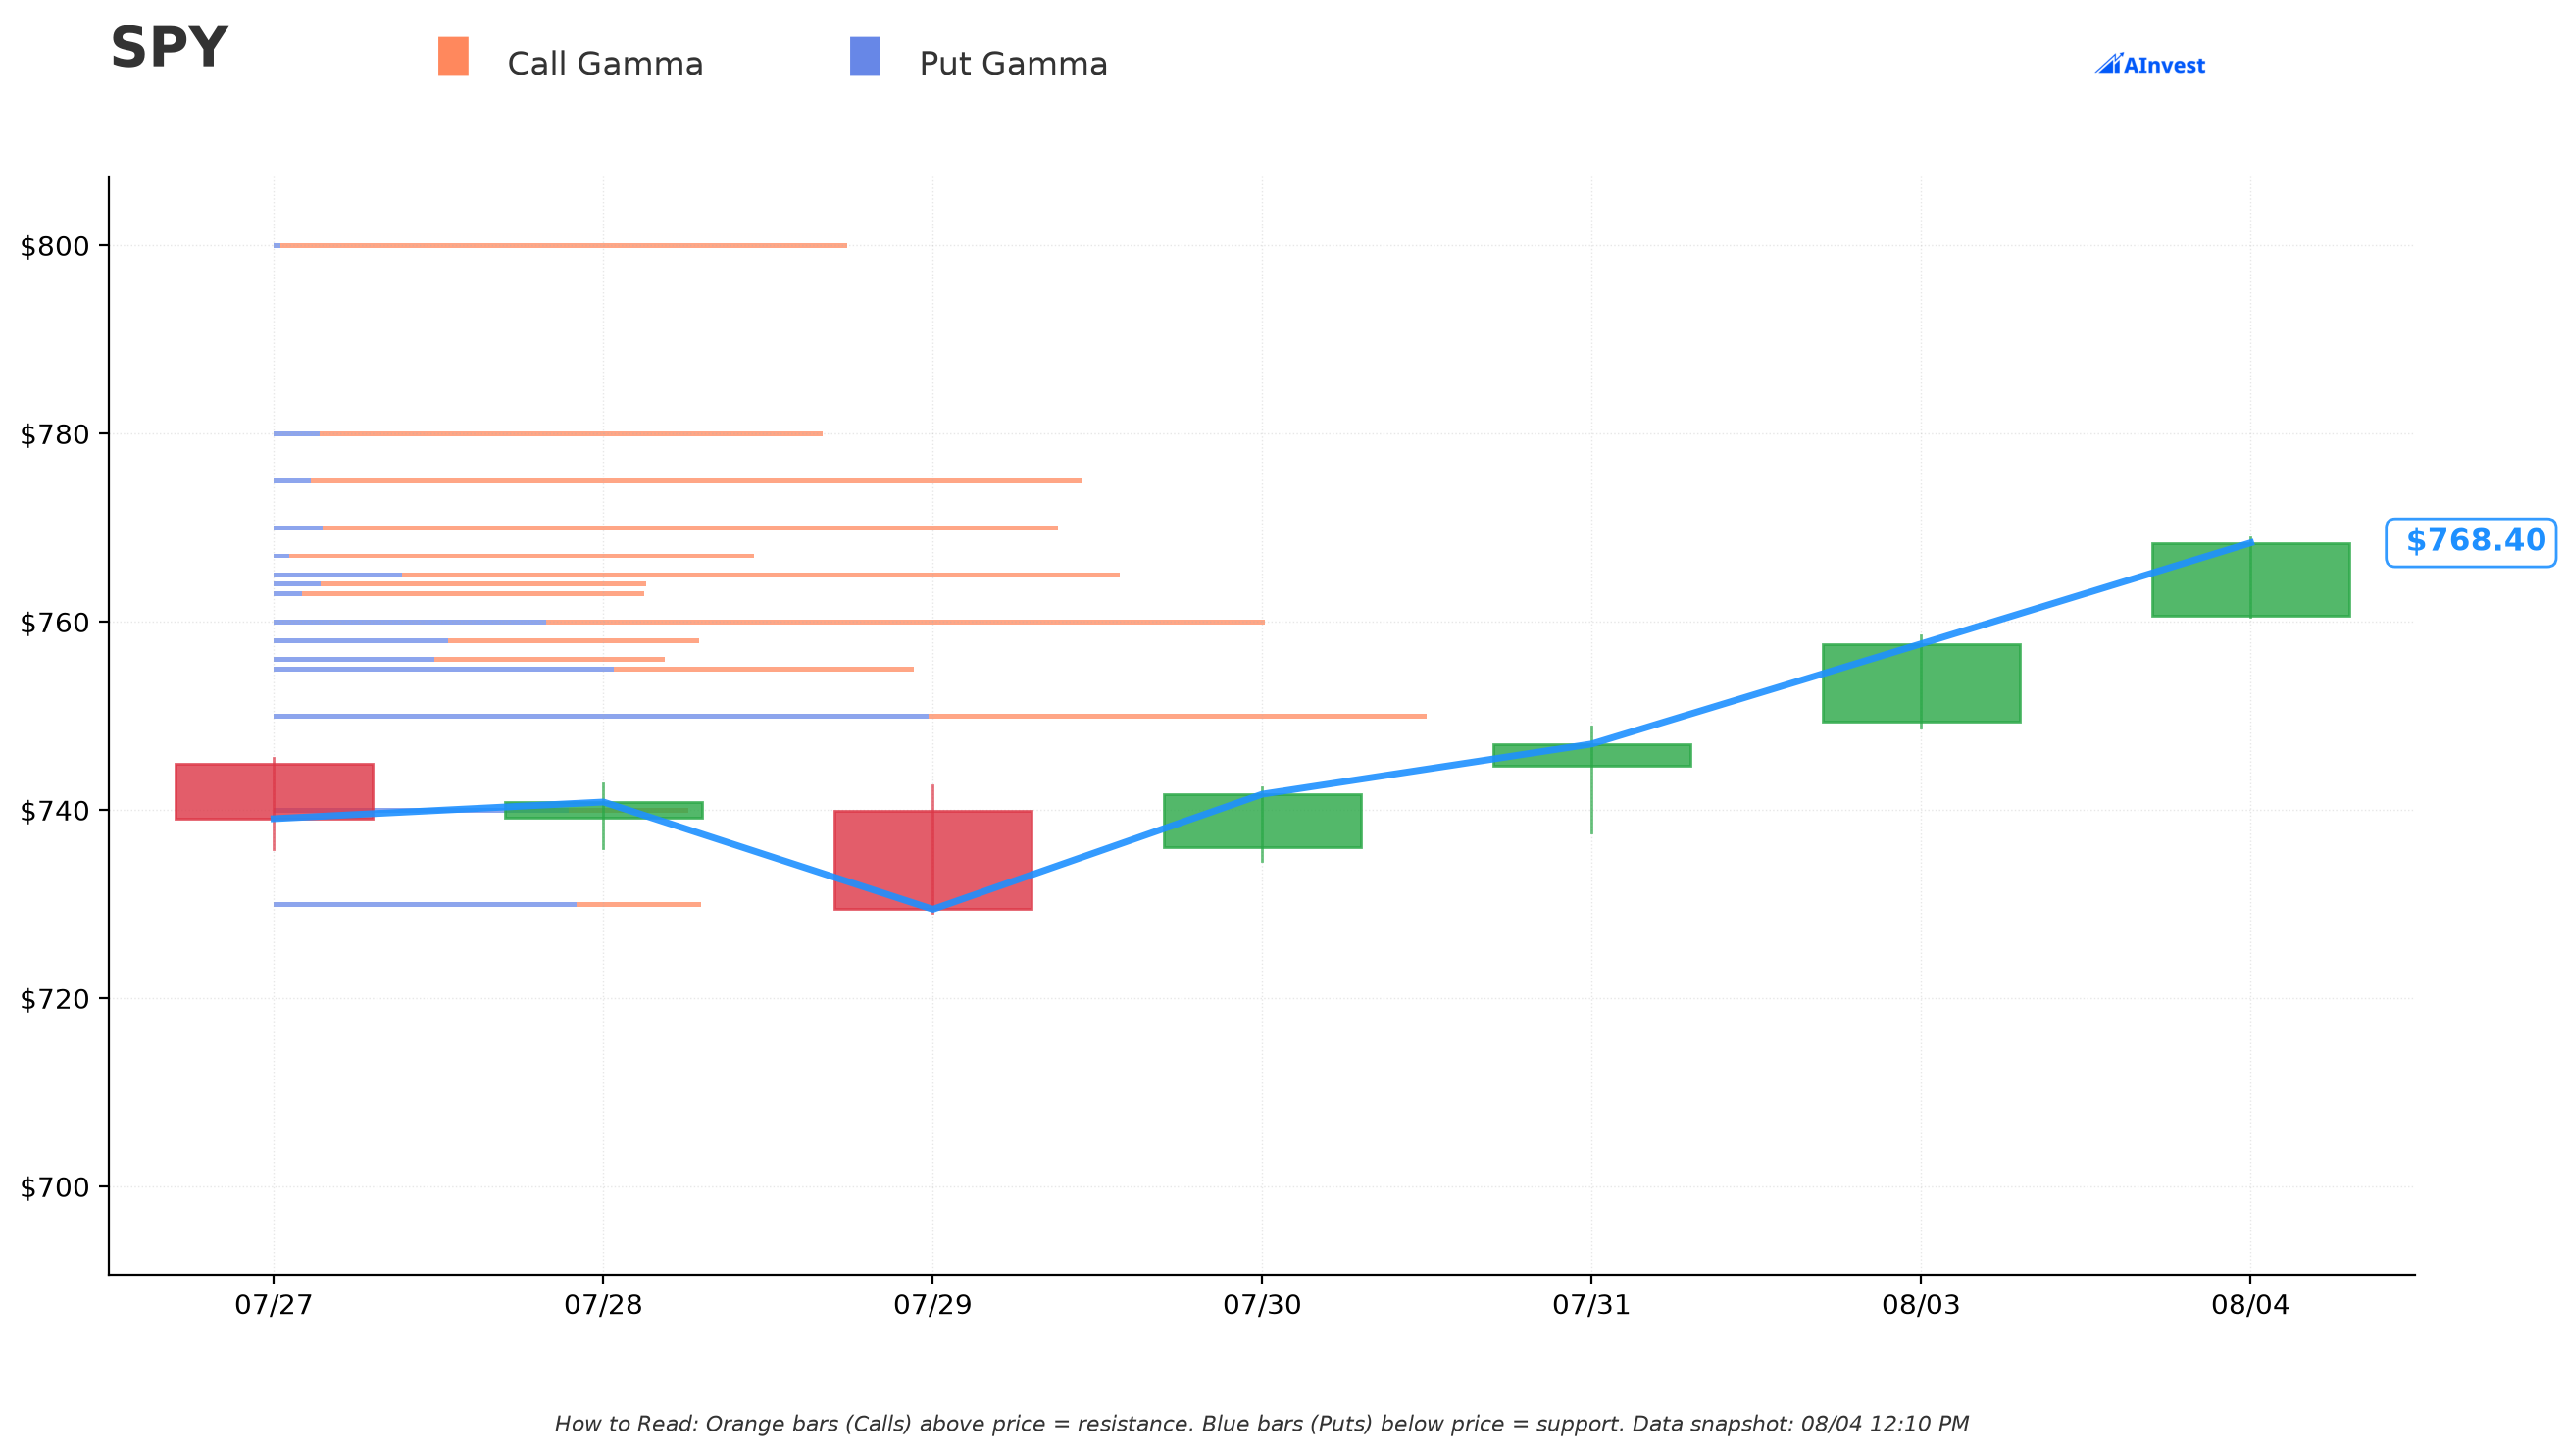
Reading the actual dealer gamma positioning from gex.json (snapshot spot $768.47):
- 🔵 Support: $765 (very strong, ≈0.45% below spot), $760 (strong, ≈1.10% below), $750 (very strong, ≈2.40% below).
- 🟠 Resistance: $770 (right overhead, ≈0.20% away), $775 (very strong — the exact strike both today's biggest trades bought, ≈0.85% above spot), $780 (≈1.50% above), $800 (≈4.10% away), with bigger, farther walls at $810 and $825.
The $775 level is the single strongest resistance wall in range, dominated almost entirely by call gamma (call gamma there outweighs put gamma by more than 20-to-1). That means dealers already carry heavy short-call exposure at $775 — both today's biggest trades bought right into (Trade 2's $775 leg) or just past (Trade 2's $785 leg) the level where market makers have to do the most hedging if price actually gets there.
📏 Implied Move — What the Option Chain Itself Expects
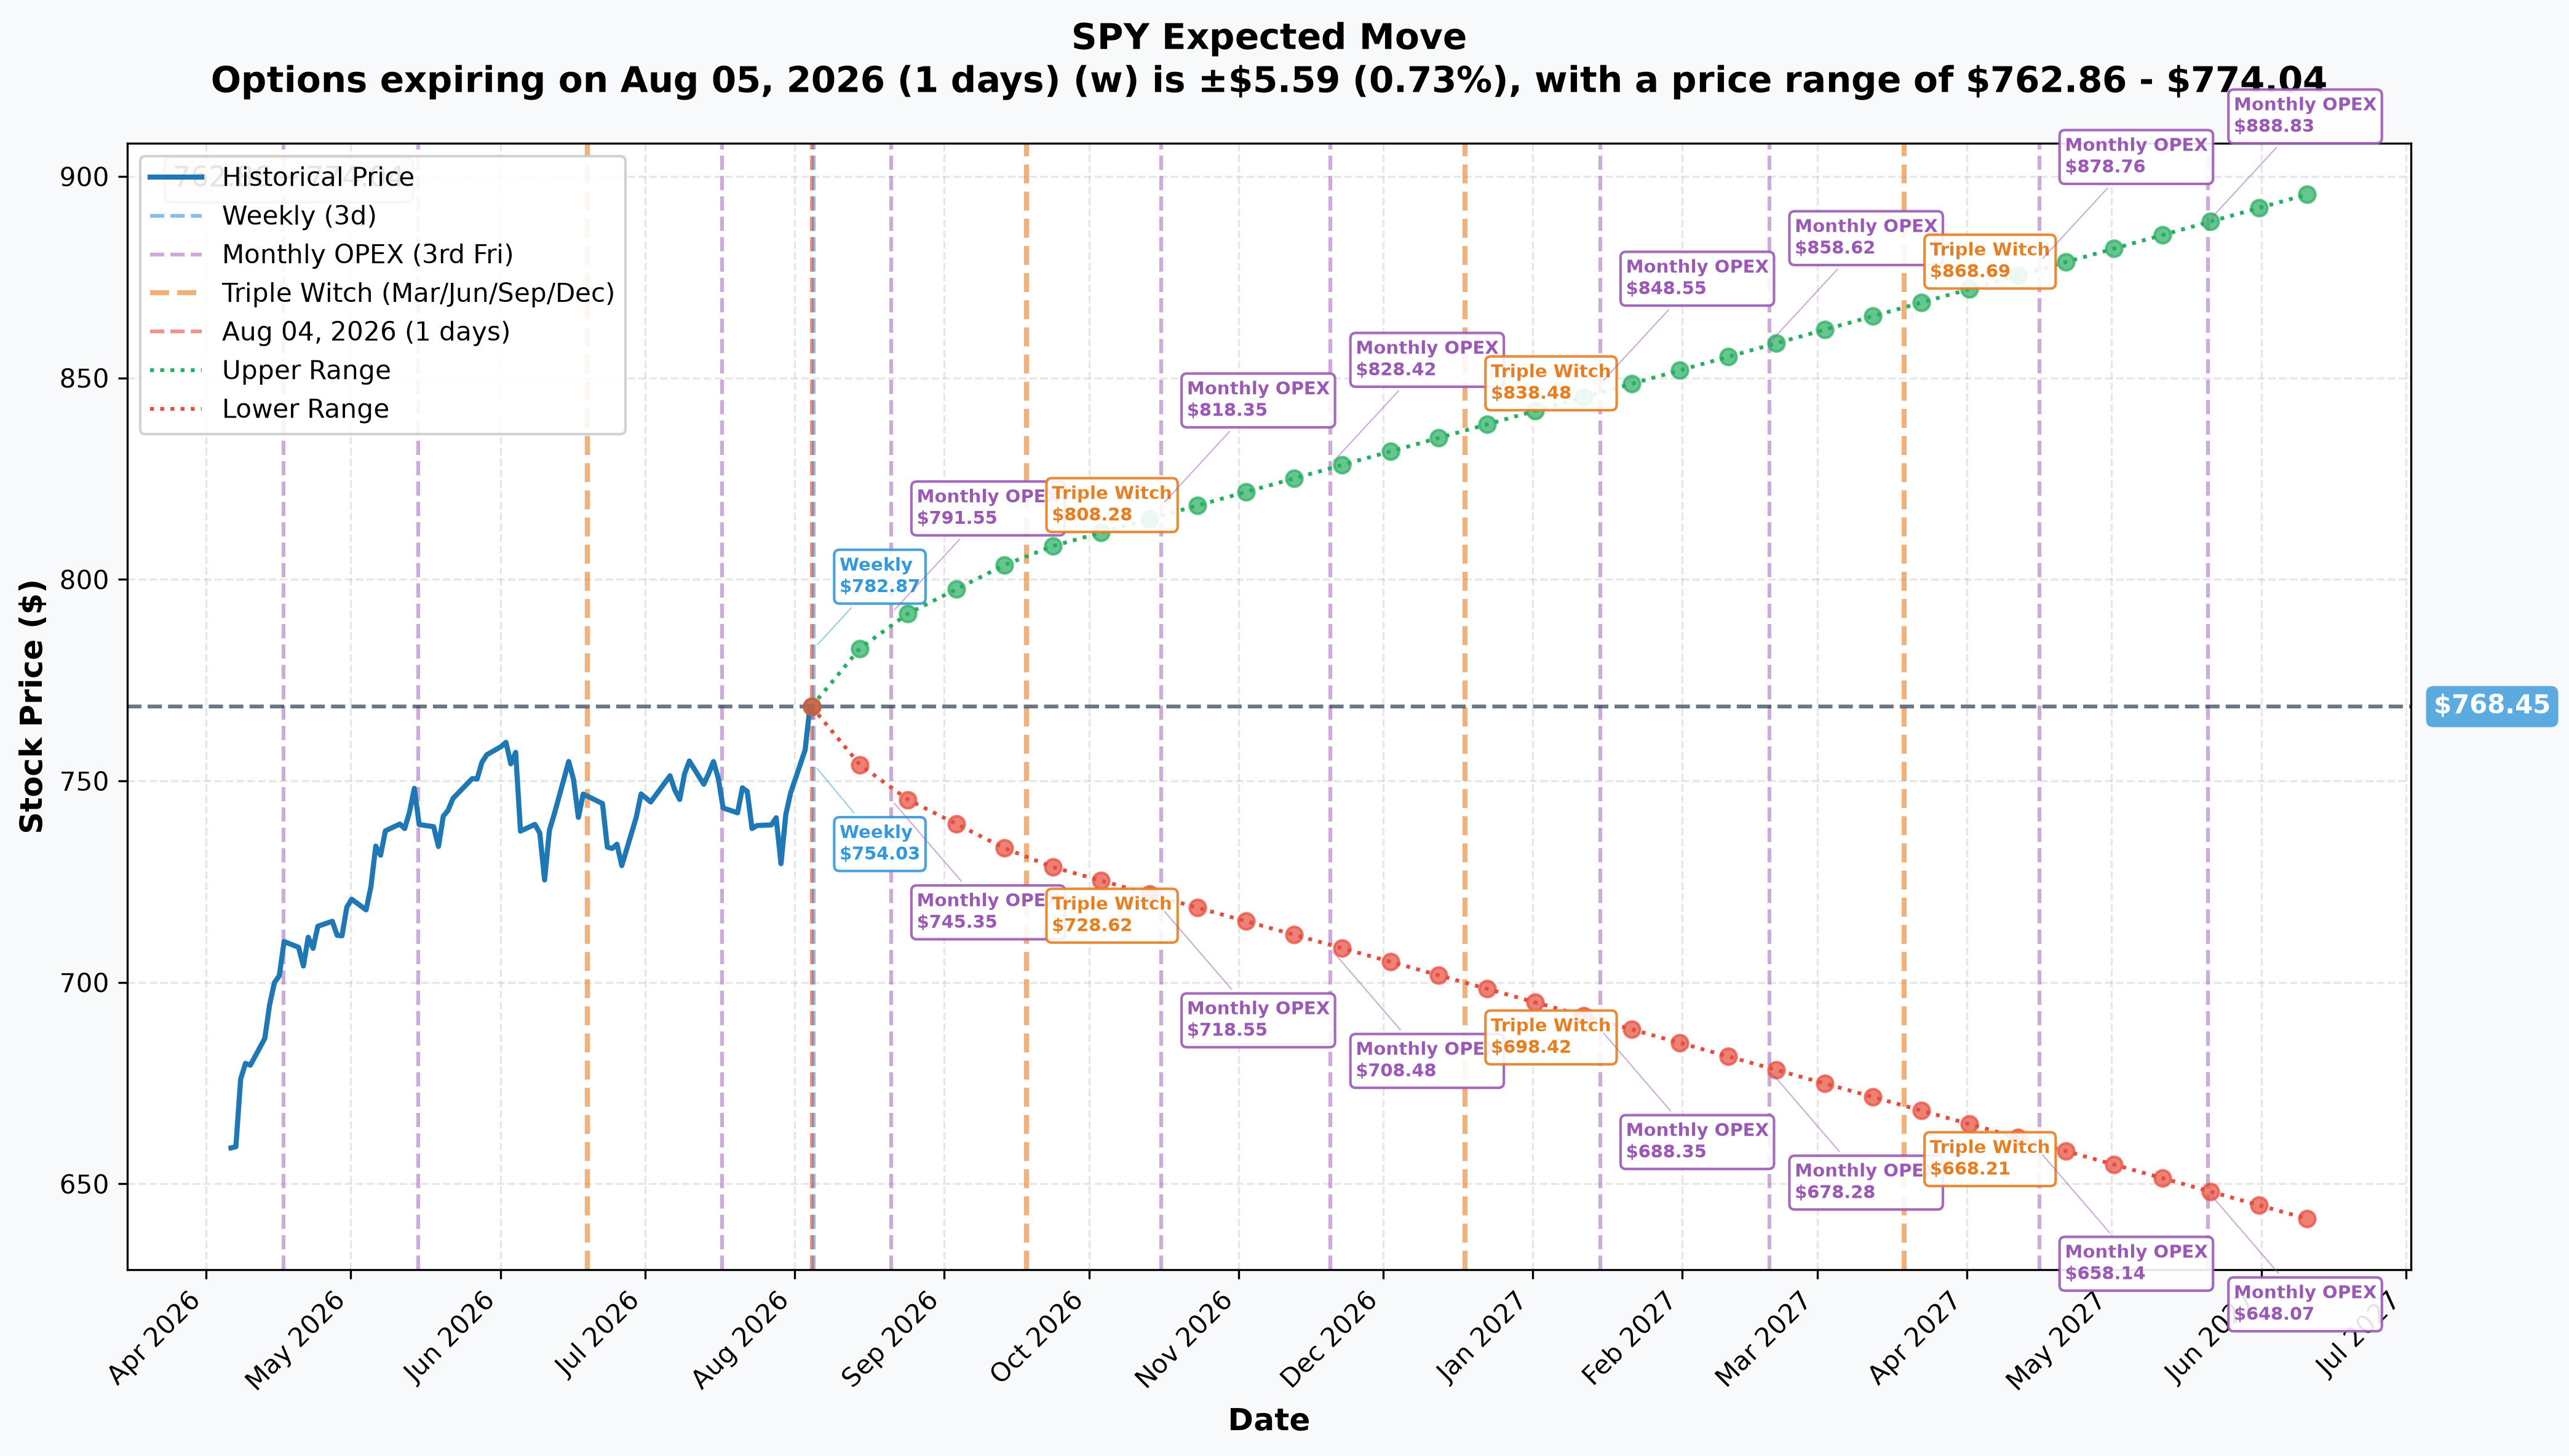
From SPY_implied_move.json (spot $768.45), the option chain prices these ranges:
| Expiry | Days | Implied Move | Range |
|---|---|---|---|
| Weekly (Aug 5) | 1 | ±0.73% | $762.86 – $774.04 |
| Monthly OPEX (Aug 21) | 17 | ±2.77% | $747.16 – $789.74 |
| Triple Witch (Sep 18) | 45 | ±4.96% | $730.30 – $806.60 |
This is the exact expiry Trade 2 uses. The option chain's own ±2.77% implied move puts the market's expected 17-day range at $747.16 to $789.74 — and Trade 2's two breakevens, $782.80 and $788.91, both sit inside that range, with the $785 call's breakeven landing almost exactly at the top edge of what the market itself already expects. That's a real ask on the $785 leg, but not an outlier bet; the $775 leg's breakeven is comfortably inside the expected range.
For the Aug-14 trade (interpolating between the 1-day and 17-day numbers, since implied moves scale with the square root of time), the market prices roughly a ±2.2% move (≈$17) over that 10-day window — a range of roughly $750 to $784. Trade 1's breakeven of $778.20 needs about 68% of that implied range.
🎪 Catalysts
What already happened
- FOMC held rates at 3.50%–3.75% on July 29 — the fifth straight hold, but with three members dissenting in favor of a 25bp hike (TradingEconomics).
- June CPI fell to 3.5% YoY (from 4.2%), but that drop was entirely an energy story — energy prices fell 5.7%, gasoline fell 9.7%, tied to the US–Iran ceasefire. Core CPI ran 2.6% YoY (TradingEconomics CPI).
- Core PPI (ex food/energy/trade) is still 5.1% YoY (TradingEconomics PPI) — a margin-squeeze setup where producers either pass the cost through (reviving CPI) or eat it (compressing earnings).
- June payrolls printed +57K against a 110K forecast, and the trailing 12-month average sits at just +36K/month (TradingEconomics NFP).
- MSFT, AAPL, GOOGL and AMZN all beat on revenue in their late-July earnings (Finviz news).
What's coming — and here's the part that matters for these specific trades
- 🟢 August 7 (Friday): July jobs report — CONFIRMED, inside both contracts' windows (TradingEconomics calendar).
- 🟢 August 12 (Wednesday): July CPI — CONFIRMED, inside both windows (Investing.com CPI calendar).
- 🟢 August 13: July PPI — CONFIRMED. Lands the day after the Aug-14 contract expires, but inside the Aug-21 contract's window (Investing.com PPI).
- 🟢 August 19: FOMC minutes — CONFIRMED, inside the Aug-21 contract's window only; the Aug-14 contract has already expired by then.
- 🔴 September 15–16 FOMC, NVIDIA's estimated August 26 report, August 26 PCE/GDP, and the November 3, 2026 midterm elections (FEC) — all fall after even the Aug-21 expiry.
The rate story readers need to have straight: the market is pricing hikes, not cuts. Odds sit at roughly 54.4% for a hike at the September 16 meeting and ≈81% cumulative odds of at least one hike by the December 9 meeting, per Investing.com's Fed Rate Monitor (Investing.com). TradingEconomics separately cited a higher ≈77% probability for September (TradingEconomics) — the two sources disagree on the exact number, but both point the same direction: hike-leaning, not cut-leaning. The Aug-21 contract sits through jobs, CPI, PPI, and the FOMC minutes — the fullest catalyst stack of anything discussed here.
🎲 Price Targets & Probabilities
Using the gamma walls and implied-move ranges above together:
- Bear case / floor: $760–$765 — strong dealer support, roughly 1.1%–1.4% below spot at the time of the gamma snapshot. A weak jobs report or hot inflation surprise pressuring rate-hike odds higher could pull SPY back to this zone; both trades would be underwater but losses are capped at premium paid ($43.1M and $28.1M respectively for Trade 2's legs).
- Base case: SPY drifts inside the option chain's own ±2.77% 17-day implied range ($747.16–$789.74), gravitating toward the nearby gamma walls at $770/$775.
- Bull case / target: $775–$789 — Trade 2's own strikes and breakevens. A soft jobs number or in-line CPI, extending current momentum, gets SPY through $775 and toward the $785 breakeven zone by the Aug-19 FOMC minutes.
👥 Four Ways to Read This
🎰 YOLO Trader
The $785 call is the cleaner mirror trade — proven fresh open, defined risk, liquid strike, 17 days to work with four catalysts inside the window. The $775 leg is murkier; if you're chasing the same idea, the $785 strike is the one with a confirmed clean read behind it. Size any of this like a lottery ticket regardless — max loss is 100% of premium either way.
📊 Swing Trader
$775 remains the strongest gamma wall on the board, and now two separate expiries (Aug-14 and Aug-21) have real size stacked at that exact strike. A call debit spread around $775/$785 into the Aug-21 monthly captures the same levels these trades are using, with defined risk and without betting on which side of the open/close ambiguity the $775 leg resolves to.
💰 Premium Collector
Realized daily volatility is running at 1.34% (≈21% annualized) against a VIX of just 16.25 (Finviz SPY, Investing.com VIX) — IV here still isn't expensive relative to what SPY has actually delivered. Selling premium into a stack of four confirmed catalysts (jobs, CPI, PPI, FOMC minutes) inside 17 days, when realized vol already exceeds implied, is not a free lunch — respect $775 and $785 as gamma-heavy neighborhoods for your short strikes, not casual placements.
🌱 Beginner
Two things happened today: a proven $28.1M bet that SPY tops $788.91 by August 21, and a murkier $43.1M trade at $775 that might have been new money or might have been existing holders shuffling their position. That question is now settled, and it went the less exciting way — open interest at the $775 strike fell 82,982 → 56,680, so that $43.1M was a short being bought back, not fresh upside. Only the $28.1M at $785 was genuinely new. That uncertainty, and the fact that it resolved against the headline, is normal and important: even professional trade-flow analysis sometimes has to say "we don't know yet" — and then live with the answer. If you're new to options, that honest uncertainty is a good reason to start with owning shares outright rather than short-dated calls, where the clock never gives you the luxury of waiting for clarity.
⚠️ Risk Factors — What the Tape Can and Cannot Prove
- The $775 (Aug-21) leg's open/close status is genuinely unknown. Prior OI of 82,982 versus a 55,272-contract print means this cannot be proven from today's tape. Treat any "bullish new position" framing on this specific leg as provisional until Wednesday's OI print.
- The hedge leg on the stock-plus-options package could not be located. Only 362,008 shares traded against ≈3,965,665 shares of delta-equivalent exposure — an 11x gap. We do not know if the rest is hedged via futures, spread over time, or genuinely naked. This is a real, stated limitation, not an oversight.
- Trade 1's direction is a lean, not a fact. 67% across NBBO points toward a buyer, but the IV-through-print check disagreed on that trade, and an auction doesn't take liquidity the way a lit sweep does — so that check doesn't cleanly apply. Treat Trade 1 as probably-a-buyer, not certainly-a-buyer.
- Time is unforgiving on both trades. Trade 1 needs +1.50% by August 14. Trade 2's legs need +1.5% ($775, on top of whatever intrinsic already exists) and +2.28% ($785) by August 21. No room for a late move.
- What OPRA cannot tell us: the actual broker or firm behind either order, the trader's true identity, whether they hold offsetting hedges elsewhere (futures, other expiries, ETF shares) that don't appear on this tape, or their exit plan. We only see the print, the size, and the resulting math — not the motive.
- The macro backdrop cuts both ways. The market is priced for a hike, not a cut, while SPY sits at a record high — a genuinely tense combination. A hot CPI or PPI print could hurt these trades even if the stock story stays fine, because rate-hike repricing can pressure the whole index regardless of earnings quality.
- Realized vol already running above implied (1.34% daily / ≈21% annualized vs. VIX 16.25) means none of these options were dirt cheap even before any auction or floor-package premium (Investing.com VIX, Finviz SPY).
🎯 The Bottom Line
Real talk: $87.1 million of real money moved into SPY calls today. The bigger piece by far — $71.2 million across a $775/$785 stock-plus-options floor package — carries roughly $3.06 billion of delta-equivalent exposure, and we could not find the hedge leg that's supposed to come with a package like this. That's not us being evasive; that's the honest limit of what the tape shows, and it's a bigger deal than the premium number itself. Layer on top of that: one of the two legs (the $775 call) sits at an open-interest level where we genuinely cannot tell you if this is new buying or existing holders repositioning.
- What's proven: the $785 call is fresh money — $28.1M, clean new position, breakeven $788.91.
- What's not proven: whether the $775 call ($43.1M) is fresh money or partly a close, and whether the ≈$3.06B of delta sitting behind both legs is hedged elsewhere or genuinely naked.
- If you're watching: mark August 7, 12, 13, and 19 on your calendar — every confirmed catalyst inside the Aug-21 window — and come back August 5, ≈06:30 ET for the OI confirmation on all three legs discussed here.
- If you're skeptical: that's the right instinct on the $775 (Aug-21) leg specifically. The $785 leg and Trade 1 both have cleaner reads.
The lesson worth keeping: a reported open-interest figure was wrong by a factor of over 16,000x (5 vs. 82,982), and that single number was enough to flip the entire story from "obviously new buying" to "genuinely unresolved." Pull the real tape. Every time.
This is not financial advice. Options trading involves substantial risk, including the potential loss of the entire premium paid, and is not suitable for all investors. Do your own research and consider your risk tolerance before trading.