🛡️ SPY Resolved: the $32.2M "Collar" Created Zero New Open Interest — an Existing Hedge Changed Hands; the $53M Call Buy Is Real
📅 August 5, 2026 | 🔥 Unusual Activity Detected
🔄 Updated 2026-08-06 pre-market — the collar resolved as neither of the two outcomes we published. We said open interest would either roughly double (opened) or collapse toward zero (closed). It did neither: the $707 put moved 20,593 → 20,579 and the $783 call moved 20,647 → 20,752 — flat on a 20,500-lot print. That is the signature of a pure transfer: the collar was not created on August 5 and was not taken off; it changed hands between two parties who each already had a side of it. The open-interest history shows the position itself dates from the July 31 close. Trade 2, the deep-in-the-money call buy, confirmed as a genuine fresh open. See the ✅ RESOLVED box below.
🎯 The Quick Take
Two completely separate institutional trades hit the tape on SPY on the morning of August 5, and the next-day open-interest print showed they were not just different trades — they were different kinds of event.
Trade 1, the $32.2M collar, turned out not to be a new hedge at all. At 09:39:40 ET with SPY at $775.84, 20,500 October $707 puts and 20,500 October $783 calls crossed together, capping upside less than 1% above spot against downside protection at $707. It looked like a large holder putting on protection. But open interest at both strikes barely moved, which means no contracts were created and none were destroyed — an already-existing collar simply moved from one owner to another. The open-interest record shows that collar was established at the July 31 close, five sessions earlier. So there is no new hedging demand here to read a signal from; there is a position being reassigned.
Trade 2 is the real new position. About 20 minutes later, another trader spent $53.0M buying 3,000 deep-in-the-money August 14 $600 calls that behave almost exactly like owning the shares outright, against just 26 contracts of prior open interest. That one opened, as predicted.
The two trades net to a $20.77M debit on paper, but that combined number was always misleading since they aren't linked — and it is more misleading now, since only one of them established anything.
💰 The Option Flow Breakdown
📊 What Just Happened — Trade 1: The Collar
| Time | Buy/Sell | Call/Put | Expiration | Premium | Strike | Volume | OI | Size | Spot | Option Price | Option Symbol |
|---|---|---|---|---|---|---|---|---|---|---|---|
| 09:39:40 | BUY | PUT | 2026-10-30 | $13,407,000 | $707 | 21,000 | 20,593 | 20,500 | $775.84 | $6.54 | SPY20261030P707 |
| 09:39:40 | SELL | CALL | 2026-10-30 | $45,592,000 | $783 | 21,000 | 20,647 | 20,500 | $775.84 | $22.24 | SPY20261030C783 |
🤝 BLOCK CROSS — both legs printed as a multi-leg cross, meaning a broker matched a known buyer and seller off the open order book. This is negotiated position management, not a sweep lifting offers in the lit market.
Net on the package: $32,185,000 CREDIT collected ($45.59M collected on the short calls minus $13.41M paid for the puts).
📊 What Just Happened — Trade 2: The Deep-ITM Call Buy
| Time | Buy/Sell | Call/Put | Expiration | Premium | Strike | Volume | OI | Size | Spot | Option Price | Option Symbol |
|---|---|---|---|---|---|---|---|---|---|---|---|
| 10:01:39 | BUY | CALL | 2026-08-14 | $35,306,000 | $600 | 2,000 | 26 | 2,000 | $775.47 | $176.53 | SPY20260814C600 |
| 10:02:19 | BUY | CALL | 2026-08-14 | $17,653,000 | $600 | 3,000 | 26 | 1,000 | $775.12 | $176.53 | SPY20260814C600 |
Stock-plus-options floor package — both prints executed at 26 prior open interest against a combined 3,000-contract size, so the size alone told us most of this was freshly opened, and the next-day OI confirmed it (26 → 3,009). Combined debit: $52,959,000.
✅ RESOLVED — and the collar took a third path we had not put on the ballot
Updated 2026-08-06 pre-market. The ≈06:30 ET OPRA open-interest snapshot (reflecting the August 5 close) has published.
| Leg | Baseline OI (Aug-5 snap) | Resolving OI (Aug-6 snap) | Δ | Print size | Δ as % of print | Day vol | Verdict |
|---|---|---|---|---|---|---|---|
| Oct-30 $707 P (bought 20,500) | 20,593 | 20,579 | −14 | 20,500 | ≈−0.07% | 20,506 | ↔️ FLAT — pure transfer |
| Oct-30 $783 C (sold 20,500) | 20,647 | 20,752 | +105 | 20,500 | ≈+0.5% | 20,525 | ↔️ FLAT — pure transfer |
| Aug-14 $600 C (bought 3,000) | 26 | 3,009 | +2,983 | 3,000 | ≈+99.4% | 3,248 | ✅ OPEN (BTO) — as predicted |
Trade 1: we published two branches and reality picked a third. The article said the $707 put would rise toward ≈41,093 if opening or fall toward ≈93 if closing. It printed 20,579 — it did not move. Same on the call: predicted ≈41,147 or ≈147, printed 20,752.
When a 20,500-lot trade produces essentially zero change in open interest, the arithmetic only permits one explanation: one side opened and the other side closed, in equal measure. No contracts were created; none were retired. The position moved between owners. This is why a large cross can be economically enormous and still tell you nothing about net positioning — $32.2M of premium changed hands and the market's aggregate hedge was exactly as big at the end of the day as at the start.
Where the collar actually came from. The open-interest series makes this unusually clear. Both strikes sat near zero for weeks — the $707 put at 376–386 contracts, the $783 call at 0–369 — and then jumped to ≈20,590 and ≈20,569 in the snapshot reflecting the July 31 close. The collar was built that day. It then sat untouched through August 3 and 4, and on August 5 it was crossed to a new holder. So the correct framing of this print is "an existing hedge changed hands," not "someone is capping a big long position ahead of the fall FOMC calendar."
Trade 2 confirmed cleanly. We predicted ≈3,026 and it printed 3,009 — a genuine fresh open, only ≈17 contracts short of a perfect one-for-one creation.
One limit worth stating. Open interest proves the aggregate did not change. It cannot tell us who handed the collar to whom, or why — a fund reassigning a hedge between internal books, a dealer unwinding a facilitation, and one institution selling its hedge to another all produce this identical flat-OI signature.
🤓 What This Actually Means — Plain English
Trade 1 — a collar, and a tight one. Buying a put and selling a call at the same time, same size, same expiration, is a classic collar: it caps how much you can make (the call strike) in exchange for a floor on how much you can lose (the put strike), and here the trader got paid $32.2M to do it, since the call they sold ($45.59M) was worth a lot more than the put they bought ($13.41M). The floor sits at $707, about 8.9% below the $775.84 spot price at the time. The cap sits at $783, only 0.9% above spot — a genuinely tight ceiling. If this position is protecting a large existing long stock or index position (SPY, futures, or a basket), it's telling you the owner is willing to give up almost all upside between now and October 30 in order to lock in a cushion against an 8.9% drawdown. The package's net option delta works out to roughly −1.30 million shares of equivalent exposure (the short call's negative delta contribution outweighs the long put's), which is consistent with a large holder dialing risk down, not adding a new bearish bet.
The crucial correction, now that the OI is in: all of that describes the collar as a structure, and it remains accurate — but the collar was not put on August 5. It was built at the July 31 close and merely changed owners on August 5. So while the economics above tell you what the position does, they do not tell you that someone newly decided to cap their upside that morning. If you were reading this print as a fresh risk-off signal from a big holder, that reading does not survive the open-interest check. The signal, such as it is, belongs to July 31.
Trade 2 — this is not really a directional call bet. A call struck at $600 when SPY trades near $775 is deep, deep in the money — it has almost no "optionality" left. Each contract carries a delta of about 0.9954, meaning it moves almost dollar-for-dollar with the shares (3,000 contracts ≈ 298,620 shares of equivalent exposure). The intrinsic value alone (spot minus strike) accounts for nearly all of the $176.53 price paid — there's roughly $1 to $1.40 of time value baked in on top of that. Traders use structures like this as a way to get stock-like exposure while tying up less cash than buying the shares outright, or as part of a financing/delta-one package rather than a pure "I think SPY is going up" wager. Read it as a capital-efficient way to hold long exposure, not a fresh bullish signal about where SPY is headed from here.
🚦 Mechanism Notes
Both legs of the collar (Trade 1) executed as a multi-leg block cross — a facilitated, negotiated print with a known counterparty on the other side, not aggressive buying that swept the lit order book. That matters for how much conviction to read into the size: a $32.2M credit collected via a cross tells us position sizing, not urgency. Trade 2 executed as a stock-plus-options floor package, consistent with financing-style, delta-one positioning rather than a lit sweep chasing the offer.
📈 Technical Setup / Chart Check-Up
YTD Chart
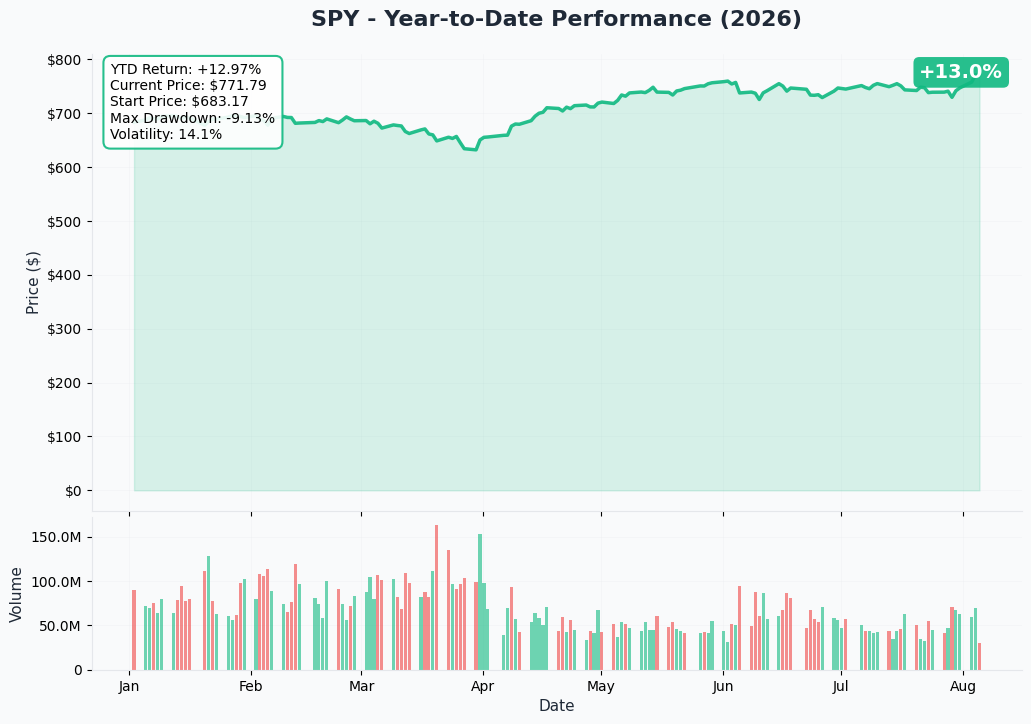
SPY closed near $771.77–$775.84 through the session, sitting about 0.7% below its 52-week high of $776.85, per the StockAnalysis SPY profile. The one-year total return sits at +23.58% including dividends, running roughly double the fund's own long-run 10.89% since-1993 average — a stretched tape by its own history.
Gamma-Based Support & Resistance Analysis
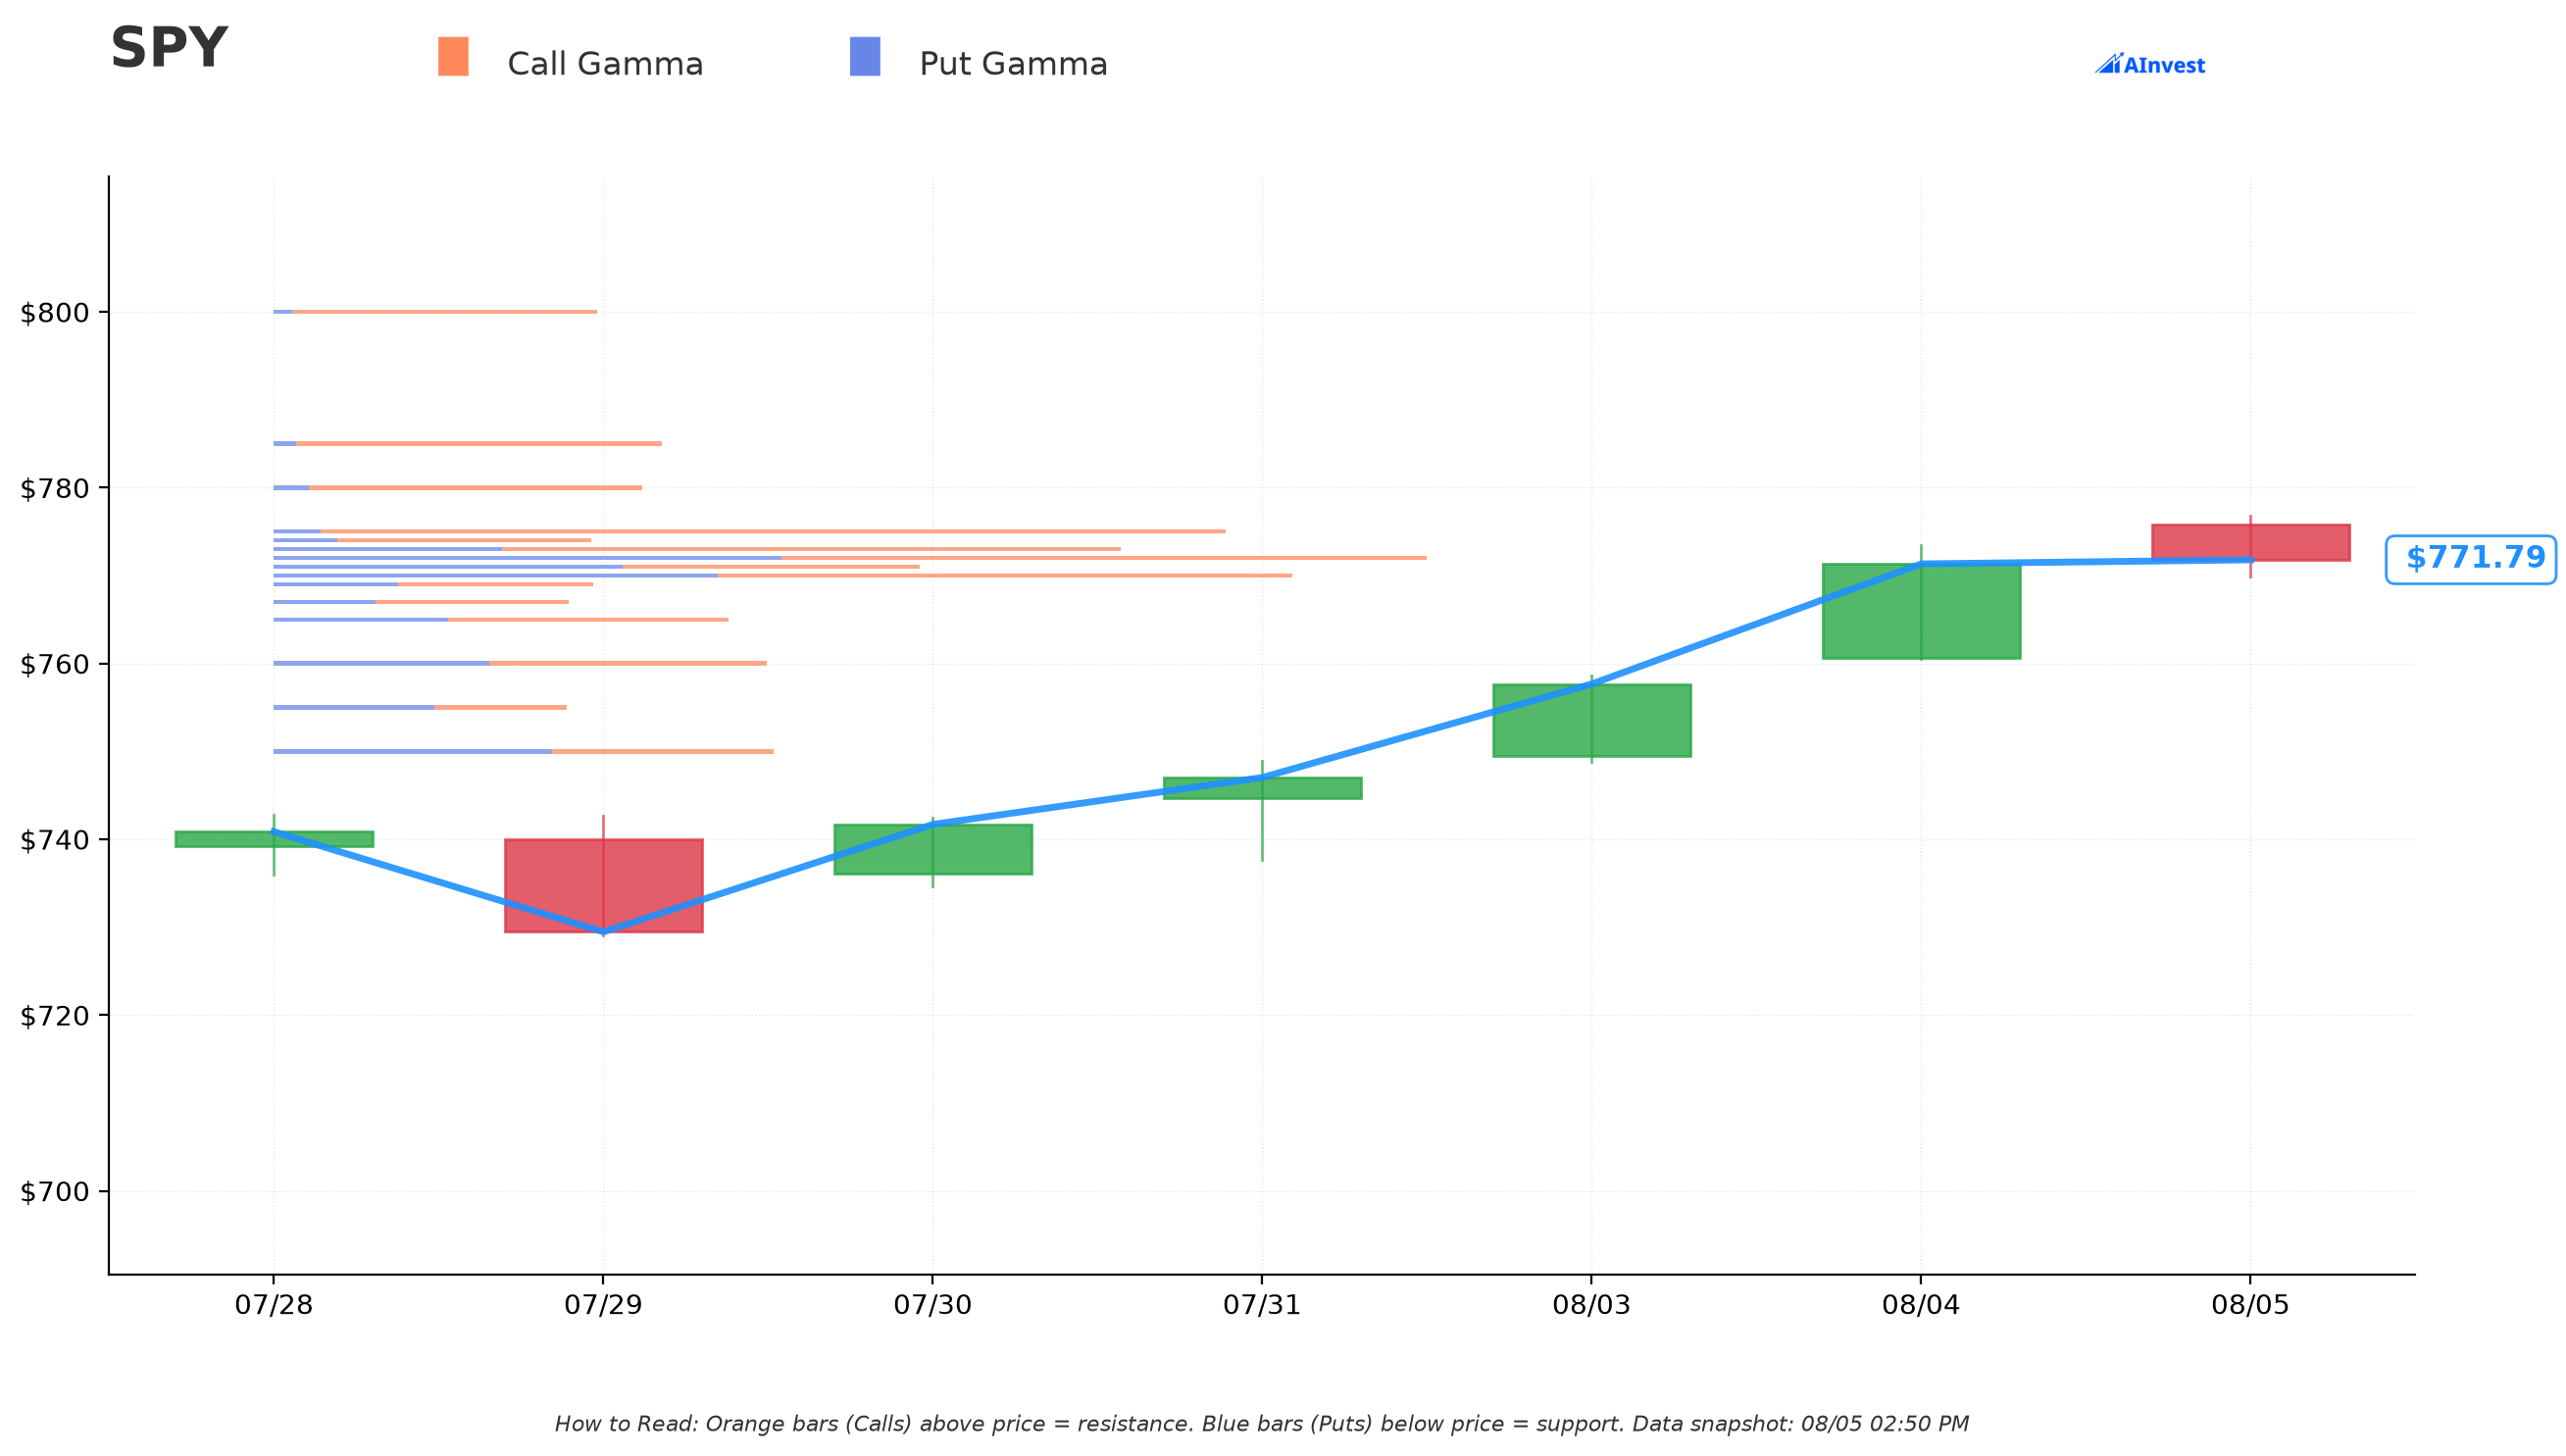
Reading the actual gamma exposure (GEX) data with spot at $771.77:
- 🟠 Call Wall (resistance): $775 — the single strike with the most call-side gamma above spot ($438.3 of call gamma vs. $22.4 of put gamma there). This is the level dealers are most likely to defend on the way up, only about 0.4% above spot.
- 🔵 Put Wall (support): $770 — the strike with the heaviest put-side gamma below spot ($214.9 of put gamma), sitting just 0.2% under spot.
- ⚖️ Key gamma / pin zone: $772 — the single strike carrying the most total gamma in the whole chain, essentially right on top of spot. That's a classic sign gamma is bunched in a very tight band around the current price (a lot of near-dated, 0DTE-style positioning), which tends to compress intraday ranges near this level.
- Farther out, secondary call-side resistance shows up at $780, $785, $800, $820, and $825 — all flagged "Very Strong," meaning if SPY breaks above the immediate $772–$775 zone, those become the next levels where dealer hedging could slow the advance. Notably, $783 — the exact strike the collar sold calls against — sits just past the first band of resistance, reinforcing that the collar seller picked a strike that's already a mechanically defended zone.
These levels shift daily as new options print and existing ones expire — treat them as a current snapshot, not a fixed line in the sand.
Implied Move
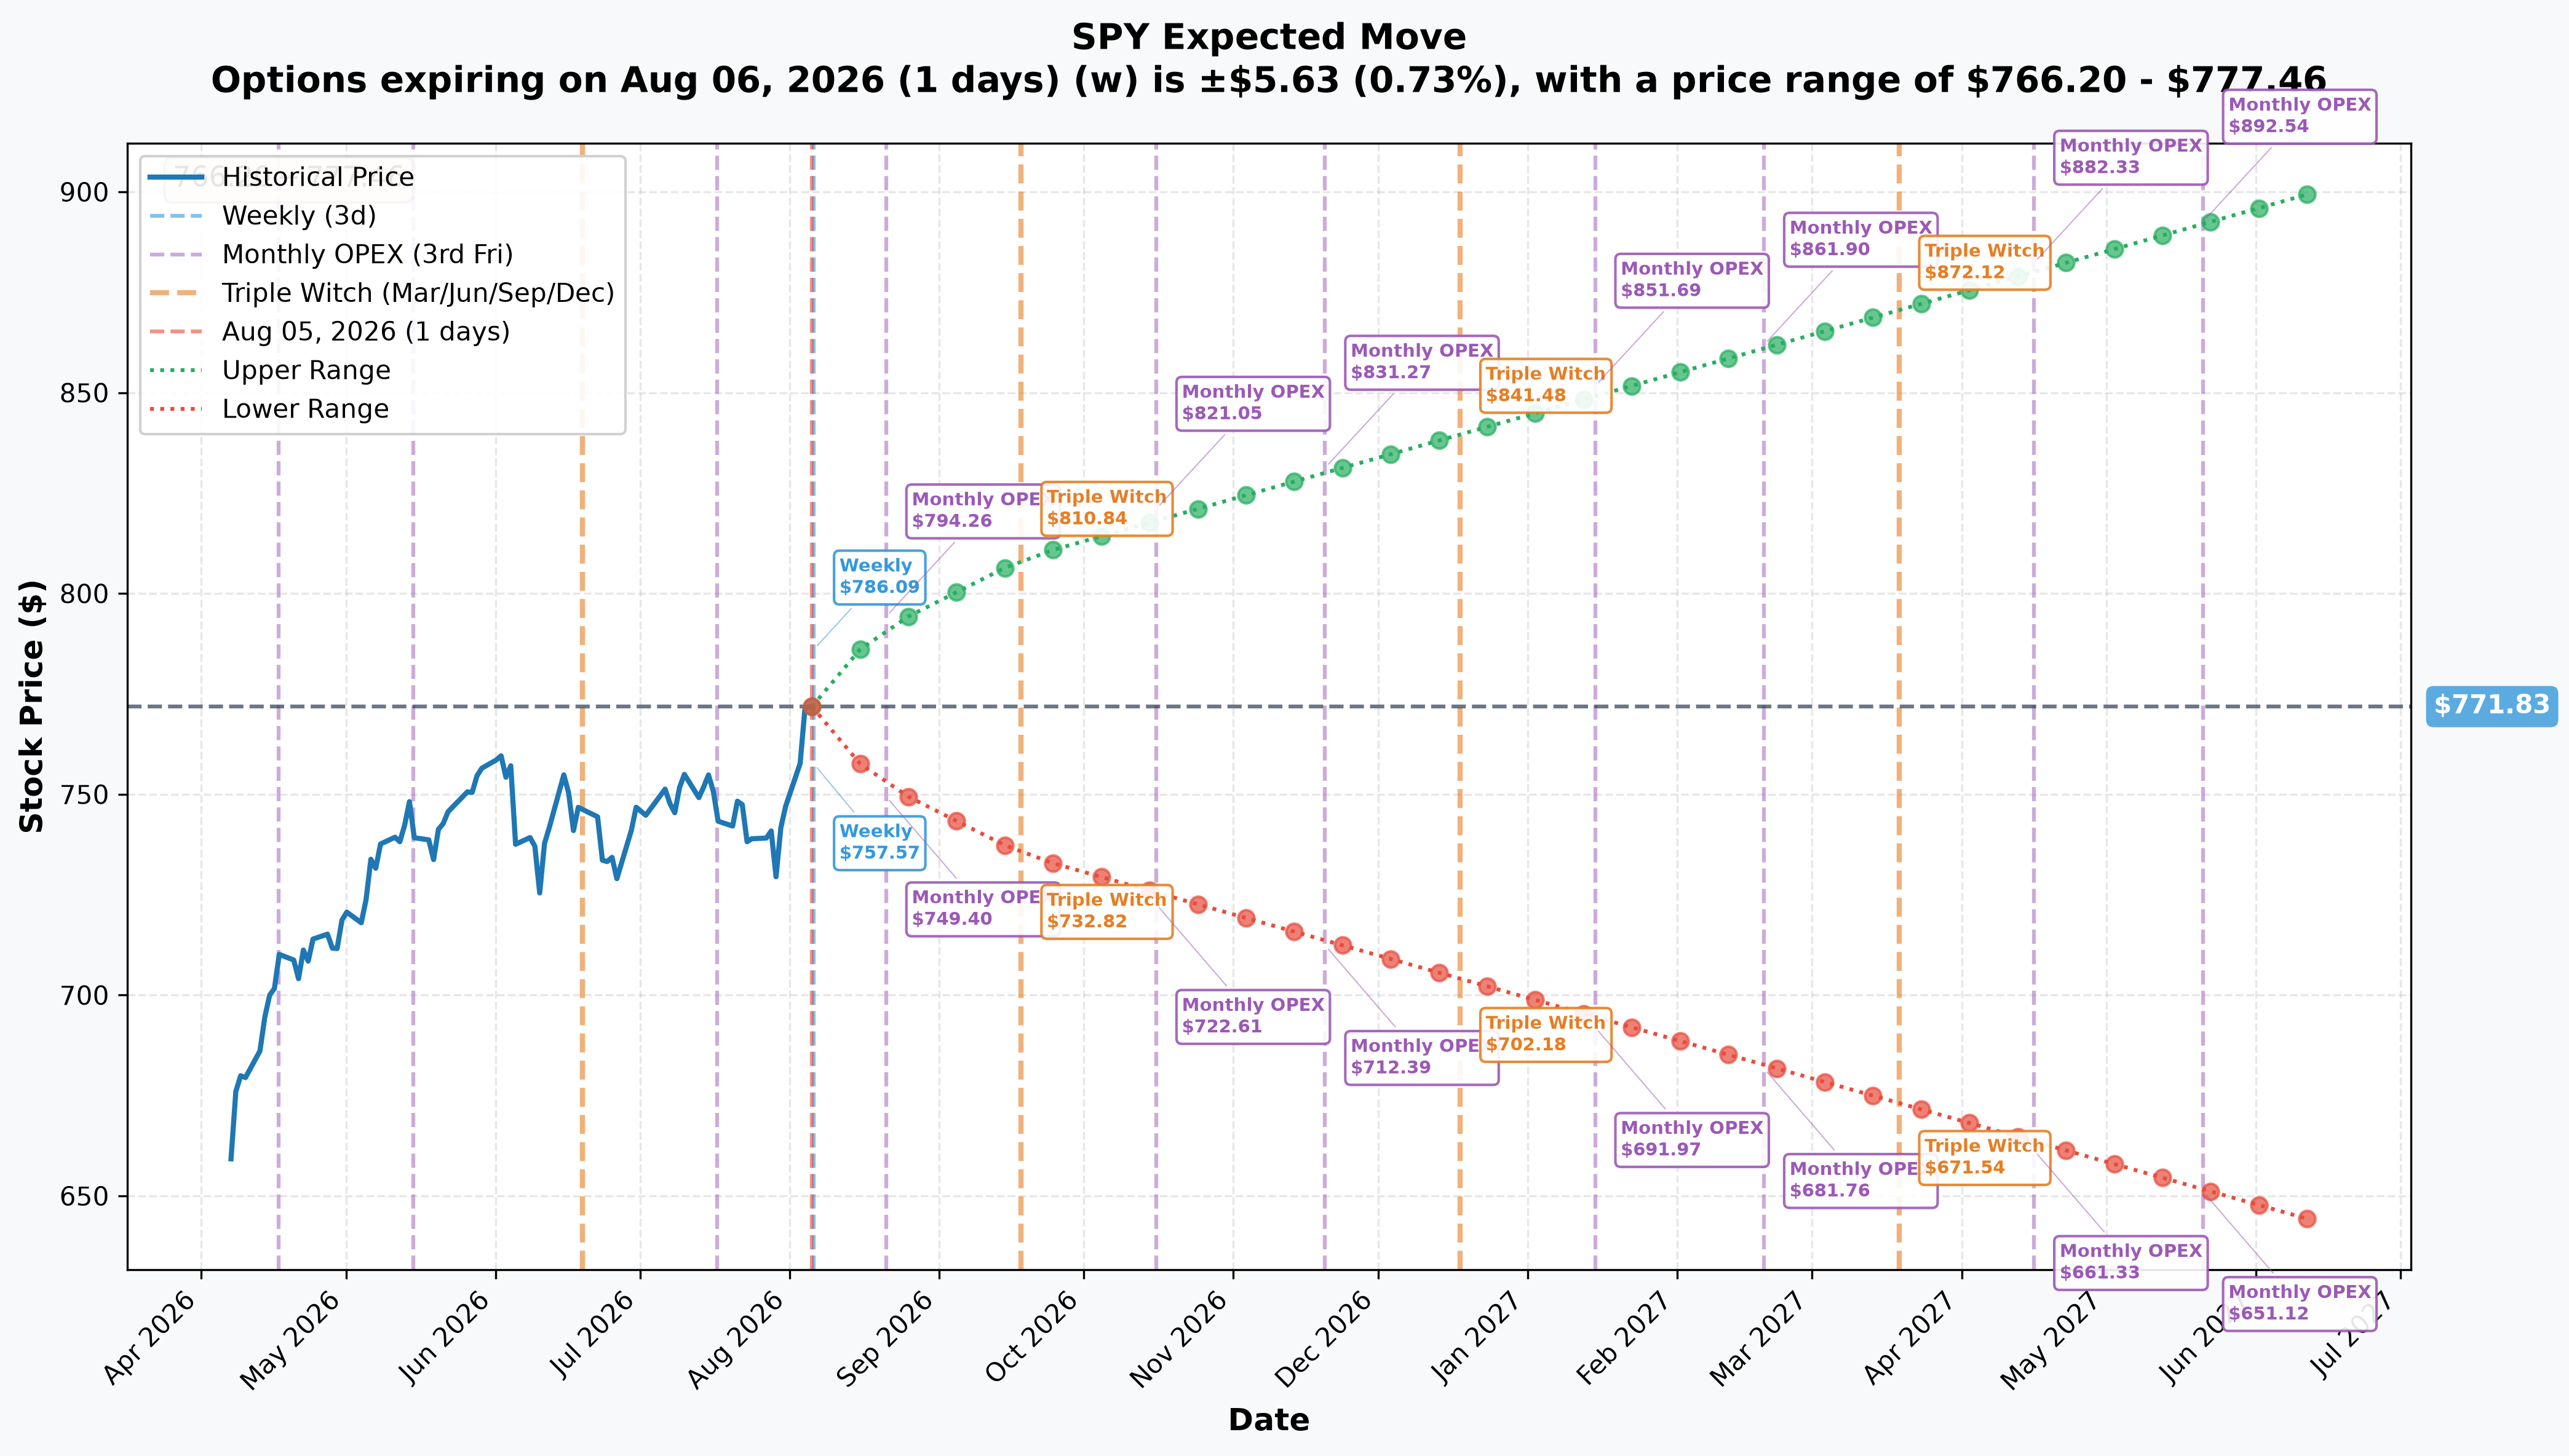
Pulling the real numbers from the options chain (quote-midpoint implied volatility, spot $771.83):
| Expiry | Days | Implied Move | Range |
|---|---|---|---|
| Weekly (Aug 6) | 1 | ±0.73% (±$5.63) | $766.20 – $777.46 |
| Monthly OPEX (Aug 21) | 16 | ±2.59% (±$20.01) | $751.82 – $791.84 |
| Triple Witch (Sep 18) | 44 | ±4.79% (±$36.97) | $734.86 – $808.80 |
| LEAPS (Jun 17, 2027) | 316 | ±16.79% (±$129.56) | $642.27 – $901.39 |
Comparing the implied move to the collar's band: the collar's $707–$783 range (a $76-wide band, roughly −8.9%/+0.9% from the $775.84 spot at execution) is dramatically wider on the downside and dramatically tighter on the upside than what the options market is currently pricing even out to the Triple Witch expiry (±4.79%, or $734.86–$808.80) — and the collar runs all the way to October 30, well past Triple Witch. In other words, the $707 floor sits outside anything the market is pricing as a "normal" move even 44 days out, while the $783 cap sits inside the market's own one-standard-deviation weekly range. That asymmetry is exactly what you'd expect from someone protecting a large position against a genuine tail move (a hawkish surprise, an election shock) while accepting that near-term upside is capped cheaply because the market doesn't expect SPY to get there fast anyway.
🎪 Catalysts
Already Happened
- The Fed held on July 29, 2026, keeping the target range at 3.50–3.75% on a 9–3 vote — but all three dissents wanted to hike 25bp, not cut, according to the Federal Reserve's July 29 press release. That's a hike-risk tape, not a cut tape, and it directly informs why someone would pay to protect a long position between now and October.
- NVIDIA rose 4.64% to $221.78 on August 5 on a report that SpaceX will exclusively use NVIDIA hardware for AI infrastructure, per StockAnalysis. At NVIDIA's 7.37% SPY weight, that move alone contributed roughly +0.34% to the index mechanically.
- July ADP private payrolls printed +44K versus +68K expected, a downside labor miss reported August 5 via the Investing.com economic calendar — a data point that cuts against the Fed's three hawkish dissenters.
Upcoming — Inside the Collar's October 30 Window
- September 15–16, 2026 FOMC, with a fresh Summary of Economic Projections and press conference — the Federal Reserve's FOMC calendar flags this as the highest-impact meeting in the window, given the live hold-vs-hike debate.
- October 27–28, 2026 FOMC, per the same Federal Reserve calendar — lands just two trading days before the collar's October 30 expiration.
- NVIDIA's estimated Q2 FY2027 earnings, August 26, 2026 (company has not confirmed the date) — consensus EPS $1.65, consensus revenue $86.4B, but company guidance of $89.2B–$92.8B sits well above that consensus, per MarketBeat. That date collides with the July PCE release, also August 26, per the BEA release schedule.
- August 26 and September 30, 2026 PCE inflation releases, both before the October 30 collar expiry, per the BEA schedule.
Upcoming — Just Outside the Collar's Window
- November 3, 2026 U.S. midterm elections — this lands four days after the collar expires, meaning the collar owner is not hedging the election itself, only the run-up to it.
- October 27–28 FOMC → October 29 GDP/PCE double-header → November 3 election is a seven-day stretch of independent macro shocks that starts before the collar expires and finishes just after — worth watching for anyone rolling this structure forward.
The August 14 deep-ITM call trade, by contrast, is a 9-day position: it sits entirely inside the run-up to the August 7 jobs report and the August 12 CPI print (conventional mid-month CPI timing; exact BLS date not independently confirmed in the sourced catalyst research), both of which land before expiration.
🎲 Price Targets & Probabilities
Using the gamma levels and implied move together:
- Bull case: a break and hold above the $775 call wall opens a path toward the $780–$785 secondary resistance band, with $800 the next meaningfully "Very Strong" gamma level — that's roughly in line with (slightly beyond) the monthly OPEX implied move upper bound of $791.84.
- Base case: price gravitates back toward the $772 pin zone, where the single largest concentration of total gamma sits almost exactly on top of spot — a classic magnet for a market this close to expiration-heavy positioning.
- Bear case: a break of the $770 put wall opens room toward $765 and then $760, both flagged "Very Strong" support; the weekly implied move's lower bound of $766.20 sits just above that zone, meaning a one-standard-deviation weekly down move alone gets price close to testing the put wall.
None of these targets say anything about the collar's $707 floor — that level sits well outside even the 44-day Triple Witch implied range, underscoring that it's tail insurance, not a base-case price target.
💡 Trading Ideas
🛡️ Conservative — "Watch, Don't Chase"
Neither trade here is a clean, easy-to-copy directional signal — and the OI resolution made that more true, not less. Trade 1 turned out to be an existing hedge changing hands, which carries no new information about anyone's fresh intent, and Trade 2 is a financing-style structure, not a pure bet. The conservative move is to draw no directional conclusion from either, and to respect the $770–$775 gamma band as the range likely to contain price short-term.
⚖️ Balanced — "Trade the Gamma Band"
With gamma this concentrated between $770 and $775, a balanced approach is a small iron condor or credit spread using the monthly OPEX ($20.01 implied move, range $751.82–$791.84) as the outer boundary — collecting premium on the assumption the index stays inside its own priced range through August 21, while respecting that a September FOMC surprise could blow through either side.
🚀 Aggressive — "Fade the Cap, or Buy the Floor"
If you have a strong view that SPY breaks the $783 collar cap before October 30 — for example, on a dovish surprise at the September FOMC or a blowout NVIDIA print — a call spread targeting $783–$800 costs less than buying calls outright and rides the same gamma resistance zone the institutional collar seller is betting against. On the other side, anyone who thinks the hawkish-dissent risk is underpriced (VIX at 15.59 is in the bottom ≈10% of its 52-week range per Investing.com) could look at buying cheap downside protection well before October, since implied vol this low means insurance is currently inexpensive relative to the event calendar ahead.
⚠️ Risk Factors
- The collar neither opened nor closed — it transferred, and that was not one of the two outcomes we offered. Both legs printed flat against a 20,500-lot size ($707 put −14, $783 call +105). This is a real lesson about how we frame these tests: presenting "OI up = open, OI down = close" as an exhaustive pair was itself an error, because a large cross can just as easily leave OI untouched. Flat is a third, common answer.
- What a flat-OI transfer still cannot tell us. We know the aggregate position did not change size. We cannot see who transferred it to whom, whether it was an internal book move, a dealer unwinding a facilitation, or one institution buying another's hedge — all identical on the tape.
- A cross has a known counterparty, but we don't know who, or why. OPRA data cannot tell us the broker, the customer, the order ID, or whether there's an invisible stock/futures hedge sitting behind either trade. We can describe the structure; we cannot read minds.
- Deep-ITM call buys can mask a variety of intents — financing, tax-lot management, replacing stock exposure, or a genuine directional bet — and the tape alone cannot fully distinguish between them.
- Valuation and volatility are both stretched in opposite directions. SPY trades at a 26.82 trailing P/E against a VIX near 15.59, per StockAnalysis and Investing.com — cheap insurance combined with an expensive index, into a Fed that just had three hawkish dissents, is a genuine asymmetric risk for anyone unhedged.
- The BLS release calendar for CPI/PPI/jobs could not be independently confirmed in the sourced catalyst research (bls.gov blocked automated access); treat the August 7 jobs / August 12 CPI dates referenced above as based on conventional monthly timing, not a confirmed BLS calendar entry.
- Options involve substantial risk of loss and are not suitable for all investors. Nothing here is a recommendation to buy or sell any specific option.
🎯 The Bottom Line
Real talk: these are two unrelated trades that happened to land on SPY the same morning, and the open-interest resolution separated them sharply.
Trade 1 was not an event. A $32.2M-credit collar capping upside at $783 (0.9% above spot) against a floor at $707 (8.9% below) is a striking structure — but it was built on July 31, and what happened on August 5 was that it changed hands, leaving open interest flat at both strikes. No new protection was bought. No old protection was lifted. For a reader trying to infer what institutions are doing now, this print is close to information-free, however large the premium attached to it.
Trade 2 was an event, if a quiet one. A $53M deep-in-the-money call buy that behaves almost exactly like owning ≈298,620 shares of stock, confirmed opening (26 → 3,009). It is a capital-efficiency play rather than a directional bet, but it is genuinely new.
The takeaway worth keeping: headline premium and market impact are different things. The bigger of these two trades by premium is the one that changed nothing. Watch the September 15–16 FOMC and the estimated August 26 NVIDIA print as the two events most likely to test the $770–$785 gamma band.
This article is for informational purposes only and does not constitute investment advice. Options trading involves substantial risk of loss and is not suitable for all investors. Always do your own research and consult a licensed financial advisor before trading.
Last updated: 2026-08-06 (pre-market) — next-day OPRA open interest resolved all three legs. The Oct-30 collar resolved as a pure transfer (both legs flat on a 20,500-lot print; the position dates from the July 31 close), not the open-or-close pair we published; the Aug-14 $600 call buy confirmed opening (26 → 3,009). Title, lead, plain-English section, trading ideas, risk factors and bottom line were corrected.