🔄 SPY's "$22M Call Buy," Resolved — Not a Bullish Bet, But the Short-Cover Story Didn't Hold Up Either
📅 2026-08-10 | 🔥 Unusual Activity Detected
🔄 Updated 2026-08-11 pre-market — the next-day OPRA open interest resolved all three legs, and it corrected this article's own headline. The hedged Nov-20 $700 call sale opened as predicted (1,387 → 3,356). The Aug-14 $775 calls were not a fresh bullish bet — open interest fell 90,973 → 82,935, where an opening would have printed near ≈120,973. And the Aug-14 $780 calls, which we called a high-confidence buy-to-close, did not shrink the position: open interest rose 145,531 → 147,806 against a predicted fall toward ≈85,531. The strike-level short position did not come down, so the "mostly someone covering a short" framing is retracted as a stated fact — the defensible verdict is a transfer between holders. See the ✅ RESOLVED box.
🎯 The Quick Take
The headline number looks bullish: $22.41M spent buying SPY calls in a single minute this morning. It was not a bullish bet — but the open-interest record has since shown it was not a clean short-cover either. Neither August leg added long exposure, and neither reduced the strike's outstanding position: the $775 call's open interest fell 8,038 and the $780 call's rose 2,275, so both prints resolved as transfers between holders rather than new conviction or a genuine unwind (see the ✅ RESOLVED box). Separately, an unrelated trade saw 2,000 deep-in-the-money $700 calls sold for $17.42M against a paired stock position — that one confirmed as a genuine new opening. Both structures expire or matter on wildly different timelines (four days vs. 102 days), and neither one is the simple "whale goes long SPY" story the raw dollar figure suggests.
📊 Fund Overview
SPY (SPDR S&P 500 ETF Trust) is the oldest US-listed ETF, launched January 22, 1993, and tracks the S&P 500 Index, per State Street Global Advisors.
- 💰 Net assets (AUM): ≈$808.3B (SSGA, as of Aug 7) to ≈$812.05B (Stock Analysis, as of Aug 10) — comfortably above $800B either way
- 📈 NAV / share price: $773.36 NAV (Aug 7) vs. $773.68 traded (Aug 10, 12:24pm ET), per SSGA and Stock Analysis
- 💸 Gross expense ratio: 0.0945%
- 📊 Holdings: 505 | Dividend yield: 0.97% | 52-week range: $629.28–$776.85
Top 10 holdings (38.13% of the fund combined), per SSGA: NVIDIA 8.13%, Apple 6.89%, Microsoft 5.57%, Amazon 4.03%, Alphabet Class A 3.11%, Broadcom 3.03%, Alphabet Class C 2.50%, Meta Platforms 1.95%, Micron 1.48%, JPMorgan Chase 1.44%.
Sector weights: Information Technology 37.88%, Financials 12.19%, Communication Services 9.62%, Consumer Discretionary 9.33%, Health Care 8.95%, Industrials 8.72%, Consumer Staples 4.50%, Energy 3.13%, Utilities 2.04%, Real Estate 1.82%, Materials 1.81%.
Why that matters for options traders: SPY is roughly 40% tech, and NVIDIA alone is over 8% of the fund — a single earnings report (Aug 26) can move this "index" ETF like a semiconductor stock.
💰 The Option Flow — Two Separate Trades
Trade A — 11:12:39 ET — A hedged short call, three months out
Someone sold 2,000 SPY Nov-20 $700 calls for $17.42M in premium. This printed as a 🤝 floor block that also carries a paired stock leg on the equity tape — meaning shares moved alongside the options, not a naked call sale. That pairing delta-hedges the package: by itself, the option leg does not tell us whether the person behind it is bullish or bearish on SPY. Size (2,000) vs. prior open interest (1,387) means at least ≈613 contracts are newly opened — that piece is provable regardless of how the rest resolves.
Trade B — 10:13:00 ET — The interesting one: a "1×2" that's really two different decisions
At the same timestamp, two blocks of Aug-14 (four days out) calls printed:
- BUY 30,000 $775 calls for $11.43M
- BUY 60,000 $780 calls for $10.98M
On the surface this looks like a 1×2 ratio call buy. It isn't, once you check open interest history. The $780 strike's open interest jumped from 5,775 to 145,531 contracts reflecting Friday's session — roughly 139,756 new contracts opened Friday. On the trade day we read the 60,000-lot buy as the archive-verified buy-to-close of a chunk of that. The next-day open interest did not support the market-level version of that claim — the $780 strike's open interest rose 2,275 rather than falling, so the outstanding position did not shrink (an individual buyer can still have been covering while a different seller opened against them; see the ✅ RESOLVED box). And the $775 leg, the only piece that could plausibly have been new money, resolved with open interest down 8,038 — so it was not new money either.
Spot traded at $774.11 during Trade B — both strikes sit essentially at the money with four days left, which matters a lot for how fast these decay (see below).
Full trade-details table
| Time (ET) | Buy/Sell | Call/Put | Expiration | Premium | Strike | Volume | Prior OI | Size | Spot | Option Price | Option Symbol | Order Type | Strategy |
|---|---|---|---|---|---|---|---|---|---|---|---|---|---|
| 11:12:39 | SELL 🤝 | CALL | 2026-11-20 | $17.42M | $700 | 2,000 | 1,387 | 2,000 | $773.55 | $87.09 | SPY20261120C700 | STO (hedged, ≥613 confirmed open) | Short ITM Call + Stock (delta-hedged) |
| 10:13:00 | BUY 🤝 | CALL | 2026-08-14 | $11.43M | $775 | 33,000 | 90,973 | 30,000 | $774.11 | $3.81 | SPY20260814C775 | 🔄 not an open (resolved — was BTO ⏳) | Long Call — OI fell, no new exposure |
| 10:13:00 | BUY 🤝 | CALL | 2026-08-14 | $10.98M | $780 | 62,000 | 145,531* | 60,000 | $774.11 | $1.83 | SPY20260814C780 | 🔄 transfer (resolved — was BTC ⏳) | OI rose +2,275; strike position did not shrink |
*145,531 is the $780C open interest as of Friday's (08-07) close, after a +139,756 one-day jump — the baseline this trade is covering into, not today's stale start-of-day OI.
All three legs printed as negotiated floor blocks, not lit sweeps — no urgency verbs apply here; think "a desk positioned" or "a package was worked," not "slammed" or "piled in."
✅ RESOLVED — The Hedged Sale Confirmed; Neither August Leg Did What We Predicted
Updated 2026-08-11 pre-market. Resolving OPRA snapshot timestamped August 11 (reflects the August 10 close); baseline is the August 10 snapshot (reflects August 7 — before these prints).
| Leg | Baseline (Aug-10) | Resolving (Aug-11) | Δ | Print size | Δ as % | Day vol | Our published prediction | Verdict |
|---|---|---|---|---|---|---|---|---|
| Nov-20 $700 call (sold) | 1,387 | 3,356 | +1,969 | 2,000 | +98.5% | 2,006 | "+613 minimum, up to +2,000" | ✅ OPEN (STO) — top of range |
| Aug-14 $775 call (bought) | 90,973 | 82,935 | −8,038 | 30,000 | −26.8% | 64,657 | ≈120,973 if opening; flat/lower if closing | 🔄 NOT AN OPEN — was BTO ⏳ |
| Aug-14 $780 call (bought) | 145,531 | 147,806 | +2,275 | 60,000 | +3.8% | 120,403 | fall toward ≈85,531 if a clean cover | 🔄 NET FLAT — cover not confirmed |
The $700 call sale confirmed at the top of our range. Open interest rose 1,969 against a 2,000-lot print, meaning essentially the entire block was new. The delta-hedged short-call read on that leg stands as written.
The $775 call was not a fresh bullish bet. We said an opening trade would push open interest toward ≈120,973 and explicitly asked readers to treat any bullish framing as conditional. Open interest fell 8,038 instead. On net, this print did not add long call exposure at the $775 strike — the conditional bullish reading is now withdrawn, not merely unconfirmed.
The $780 call is the one that went against our own headline, and we are correcting it plainly. We called it a high-confidence buy-to-close and predicted open interest would fall toward ≈85,531. It did the opposite — it rose 2,275, on 120,403 contracts of day volume. Here is what that does and does not prove:
- It disproves the market-level claim. The outstanding position at the $780 strike did not shrink. Whatever happened on August 10, the aggregate short interest at that strike was still there the next morning. Our headline framing — that Friday's position was being unwound — is not supported by the open-interest record, and we are retracting it as a stated fact.
- It does not disprove that this specific buyer was covering. If one party bought to close while another sold to open in equal size, open interest stays flat and both descriptions are simultaneously true. That is the most likely explanation for a 60,000-lot print landing inside 120,403 contracts of two-way volume.
- The honest verdict is "transfer." The position moved between holders rather than being created or retired. Read the $780 line as churn at a heavily-traded near-the-money strike into expiration week, not as evidence of anyone's conviction in either direction.
The runway is now gone. These Aug-14 contracts expire Friday; the August 11 snapshot above is the cleanest read we will get, with only the 08-12 and 08-13 pre-market prints left before the strikes disappear.
🤓 What This Actually Means — Plain English
Buy-to-open vs. buy-to-close is the whole ballgame here. A "BUY" on the tape just means someone paid money and now owns more calls than they had a second ago — it does not by itself tell you whether that's a brand-new bullish position (buy-to-open) or simply closing out an existing short position they'd sold earlier (buy-to-close, i.e., covering). Both print identically as "BUY" on the tape. The only way to tell them apart is comparing today's size against how open interest actually moves — and this trade is a good lesson in how that test can come back inconclusive. $780C open interest exploded from 5,775 to 145,531 on Friday alone, and Monday's 60,000-lot buy looked like someone unwinding part of that Friday position. But the next-morning snapshot showed open interest up 2,275, not down. When a buy-to-close is matched by someone else's sell-to-open, open interest doesn't move and the test cannot separate the two. The correct conclusion is neither "conviction" nor "short-covering" — it is that the position changed hands.
Why the "1×2 ratio" framing is misleading. A real ratio call spread means one trader opens both legs together as a single bet (e.g., buy 1 call, sell 2 calls, same intent). Here, the two legs at 10:13:00 are two different decisions happening to print at the same moment: one side (the $775 calls) may be a fresh opening bet, and the other (the $780 calls) is very likely someone closing out risk from Friday. Don't read this as one coordinated ratio strategy — read it as two separate stories that happened to trade in the same minute.
Four days to expiration on an at-the-money strike is the fastest-decaying trade on the board. Spot is $774.11; the strikes are $775 and $780 — both within 1% of the money. Options this close to the strike with this little time left have almost no room for error: time decay (theta) accelerates hard into expiration week, and a 1% move in either direction can double or wipe out these contracts' value. This is not a "set it and forget it" instrument — it's built to be actively managed hour to hour, and it's easy for retail accounts to get hurt trying to copy a print like this without understanding the clock they're up against.
The $700C sale is hedged, not a market call. Because it printed with a paired stock leg on the equity tape, whoever sold these deep-in-the-money calls didn't take on a simple naked short position — the stock leg offsets much of the option's delta. We can't tell from the options tape alone whether the paired stock trade was a purchase or a short sale, but either way, this package reads as financing or portfolio-management activity, not a directional signal on where SPY goes next. Treat the $17.42M premium as real money changing hands, not as "someone thinks SPY is capped at $700."
📈 Chart Check-Up
YTD Performance
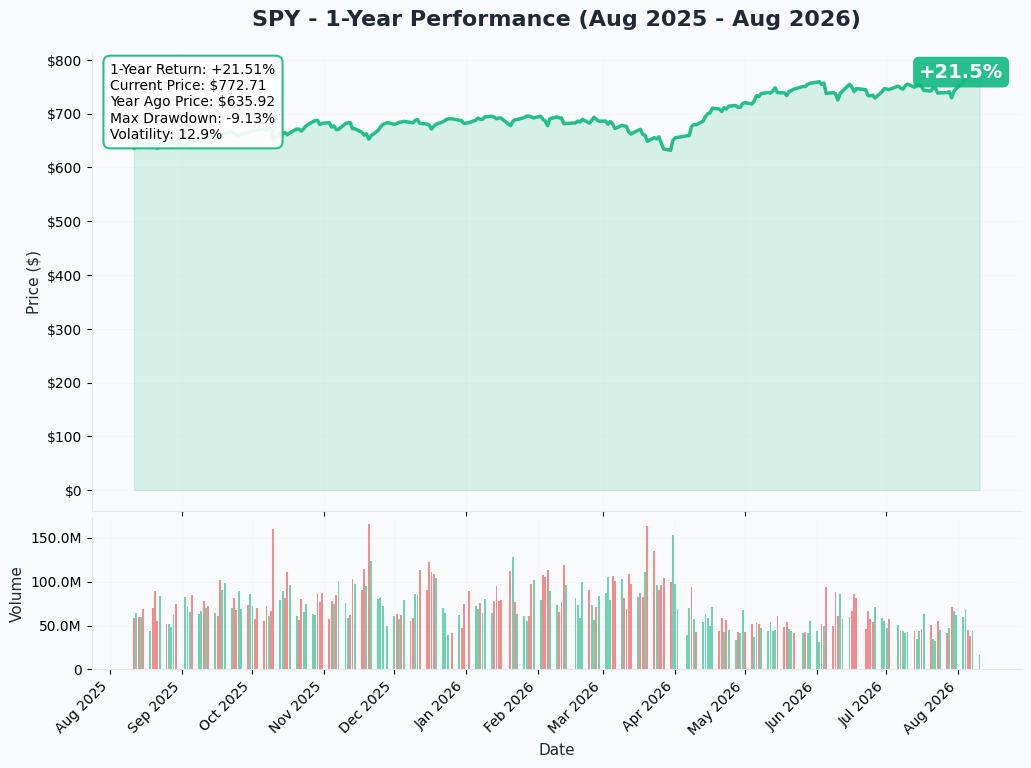
SPY sits within ≈0.4% of its all-time high, with the S&P 500 posting a 13.7% year-to-date total return through August 7 and 25 record closes this year, per 24/7 Wall St..
Gamma Support & Resistance
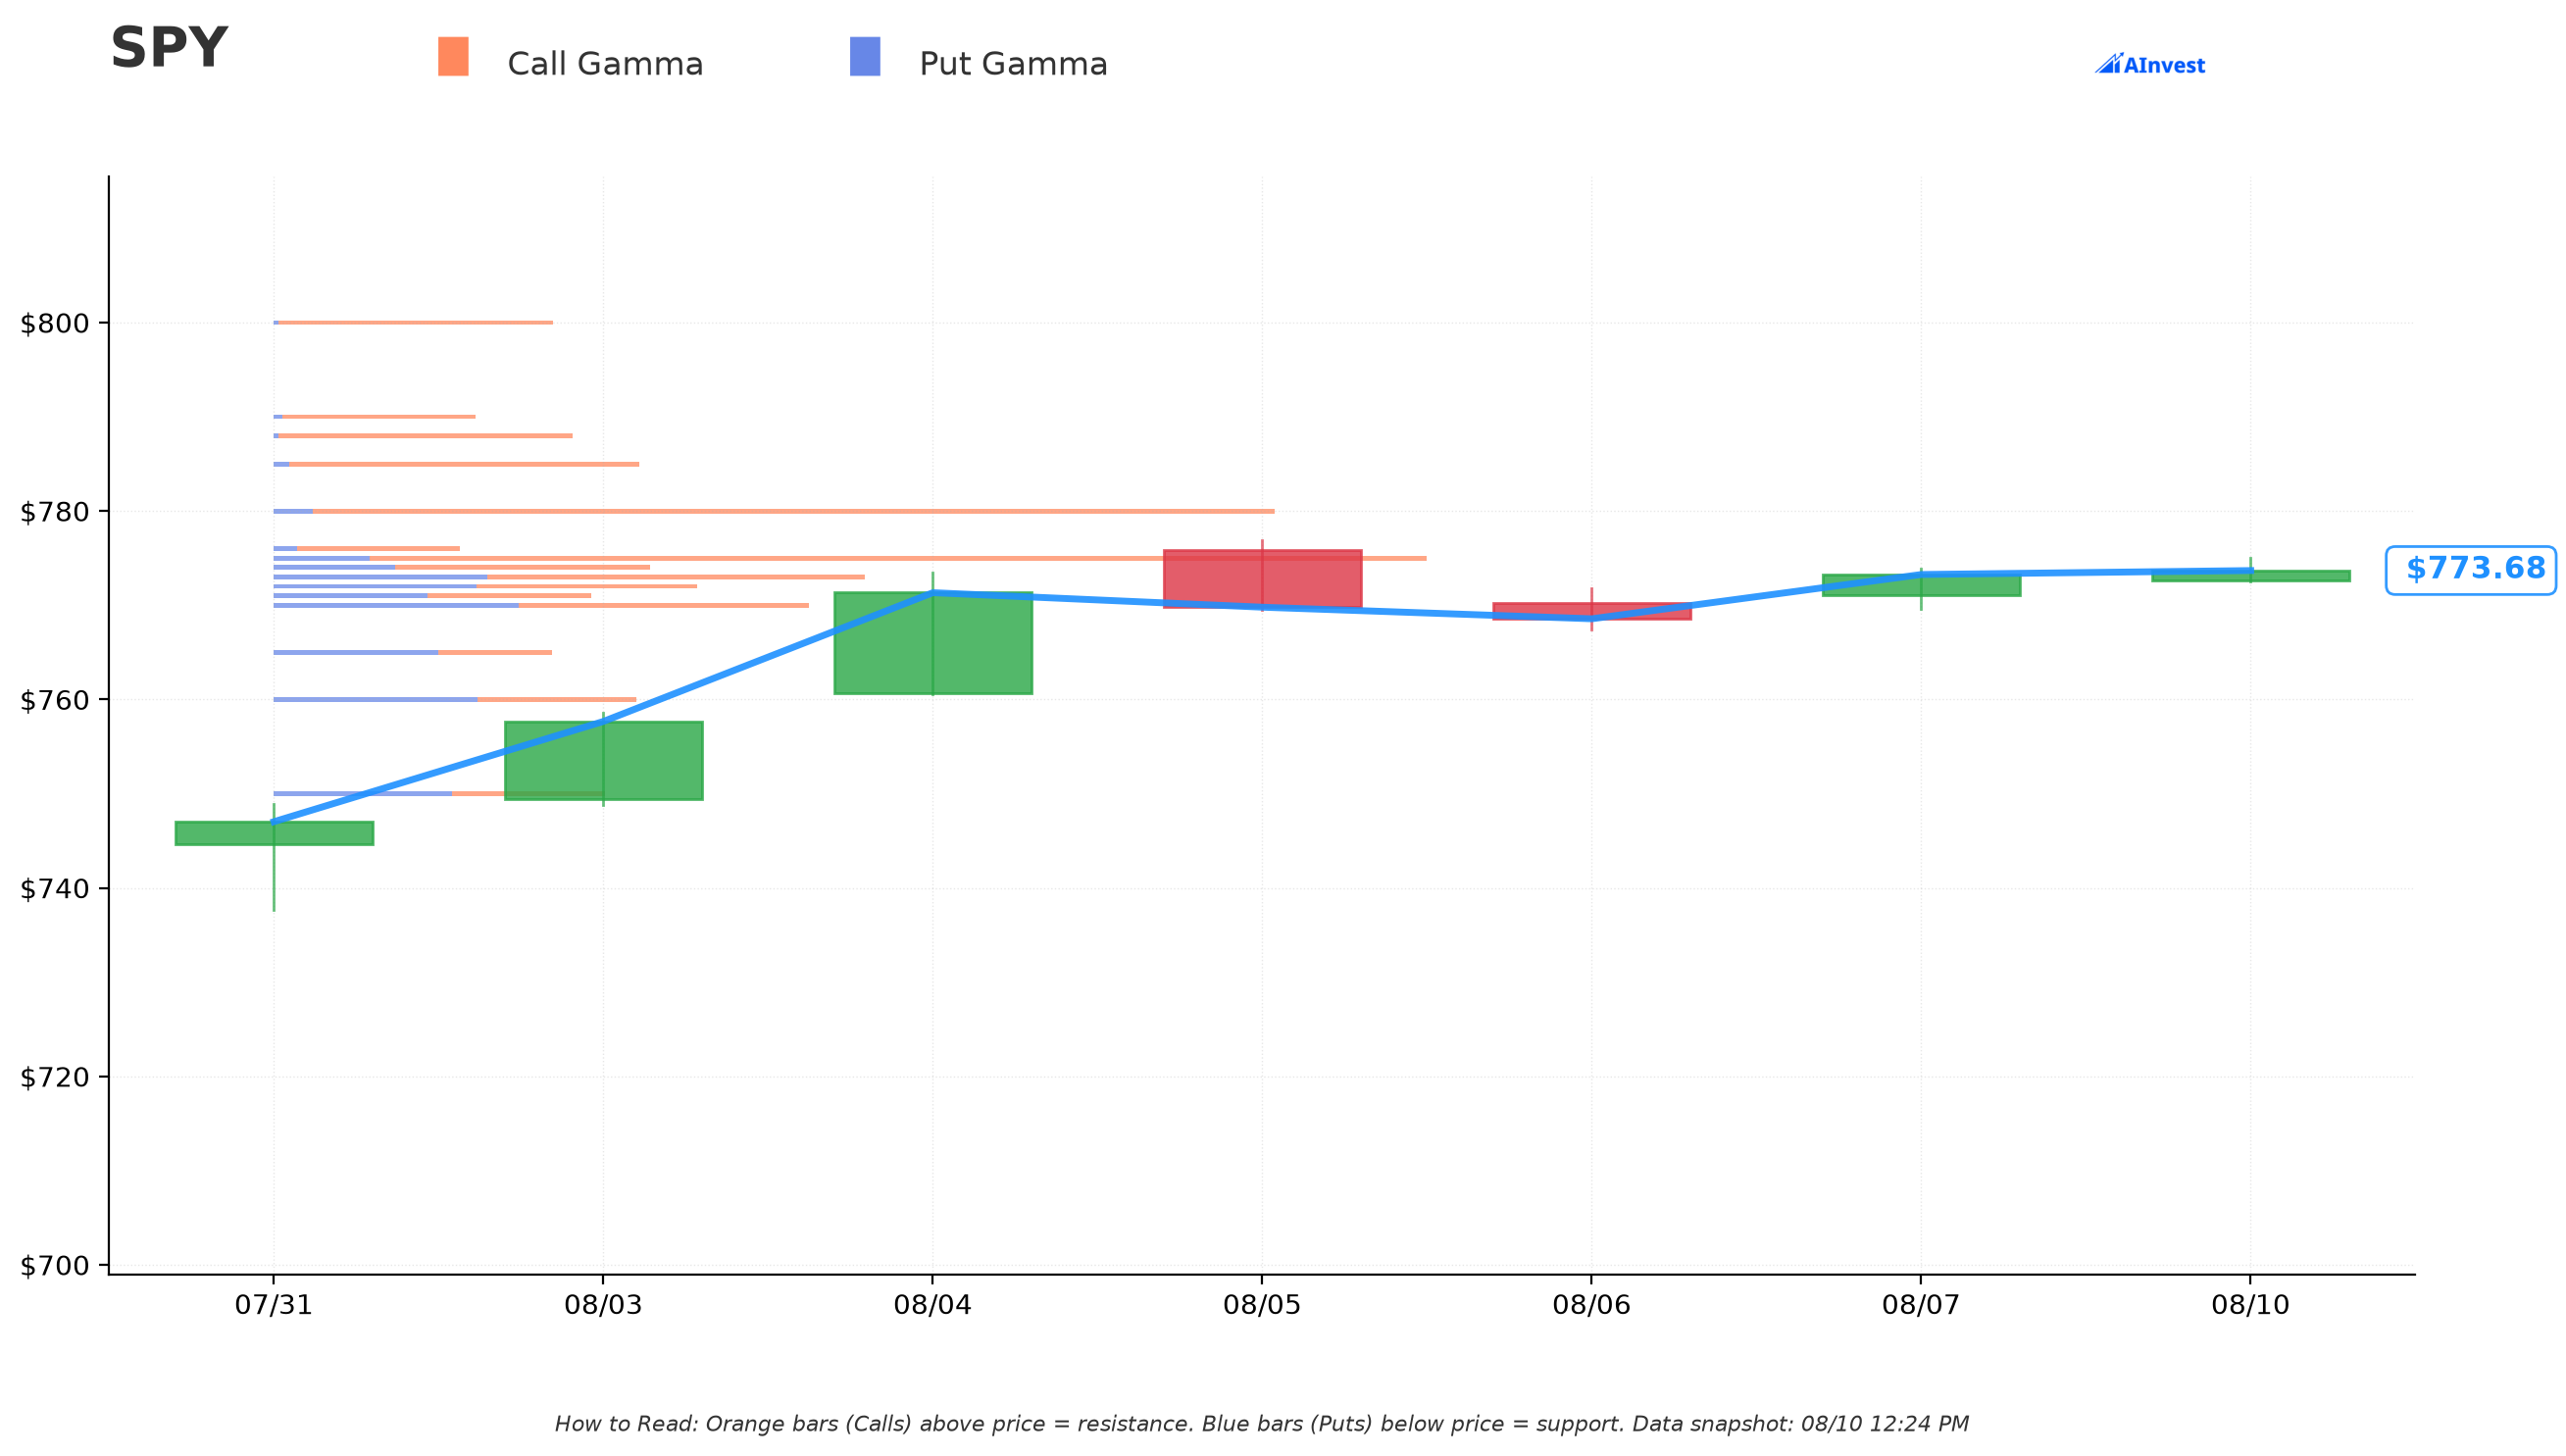
Current price (per the gamma snapshot): $773.70.
🟠 Resistance walls above spot: $775 (Very Strong — total gamma exposure ≈$672.2M, call gamma ≈$616.2M) and $780 (total gamma ≈$581.8M, call gamma ≈$559.2M). These are exactly the two strikes in today's Aug-14 trade. Whoever built or is closing this position is operating right at the market's two heaviest nearby dealer-hedging walls — not a coincidence for a four-day trade.
🔵 Support walls below spot: $773 (Very Strong — total gamma ≈$345.0M, call gamma ≈$221.2M, put gamma ≈$123.8M) and $770 (total gamma ≈$310.1M).
Net GEX bias: Bullish — call gamma (≈$4.36B) outweighs put gamma (≈$2.37B) across the full chain, meaning dealer hedging flows are more likely to dampen downside moves and lean into rallies right now, all else equal.
What this means for the four-day trade: a move through $775 and especially $780 would force dealers who are short those calls to keep buying stock to stay hedged — a mechanical tailwind if SPY pushes higher into Friday. A pullback toward $773–$770 has real dealer support underneath it too. Either way, this is a tight, well-defended range for an at-the-money four-day option to be sitting in.
Implied Move
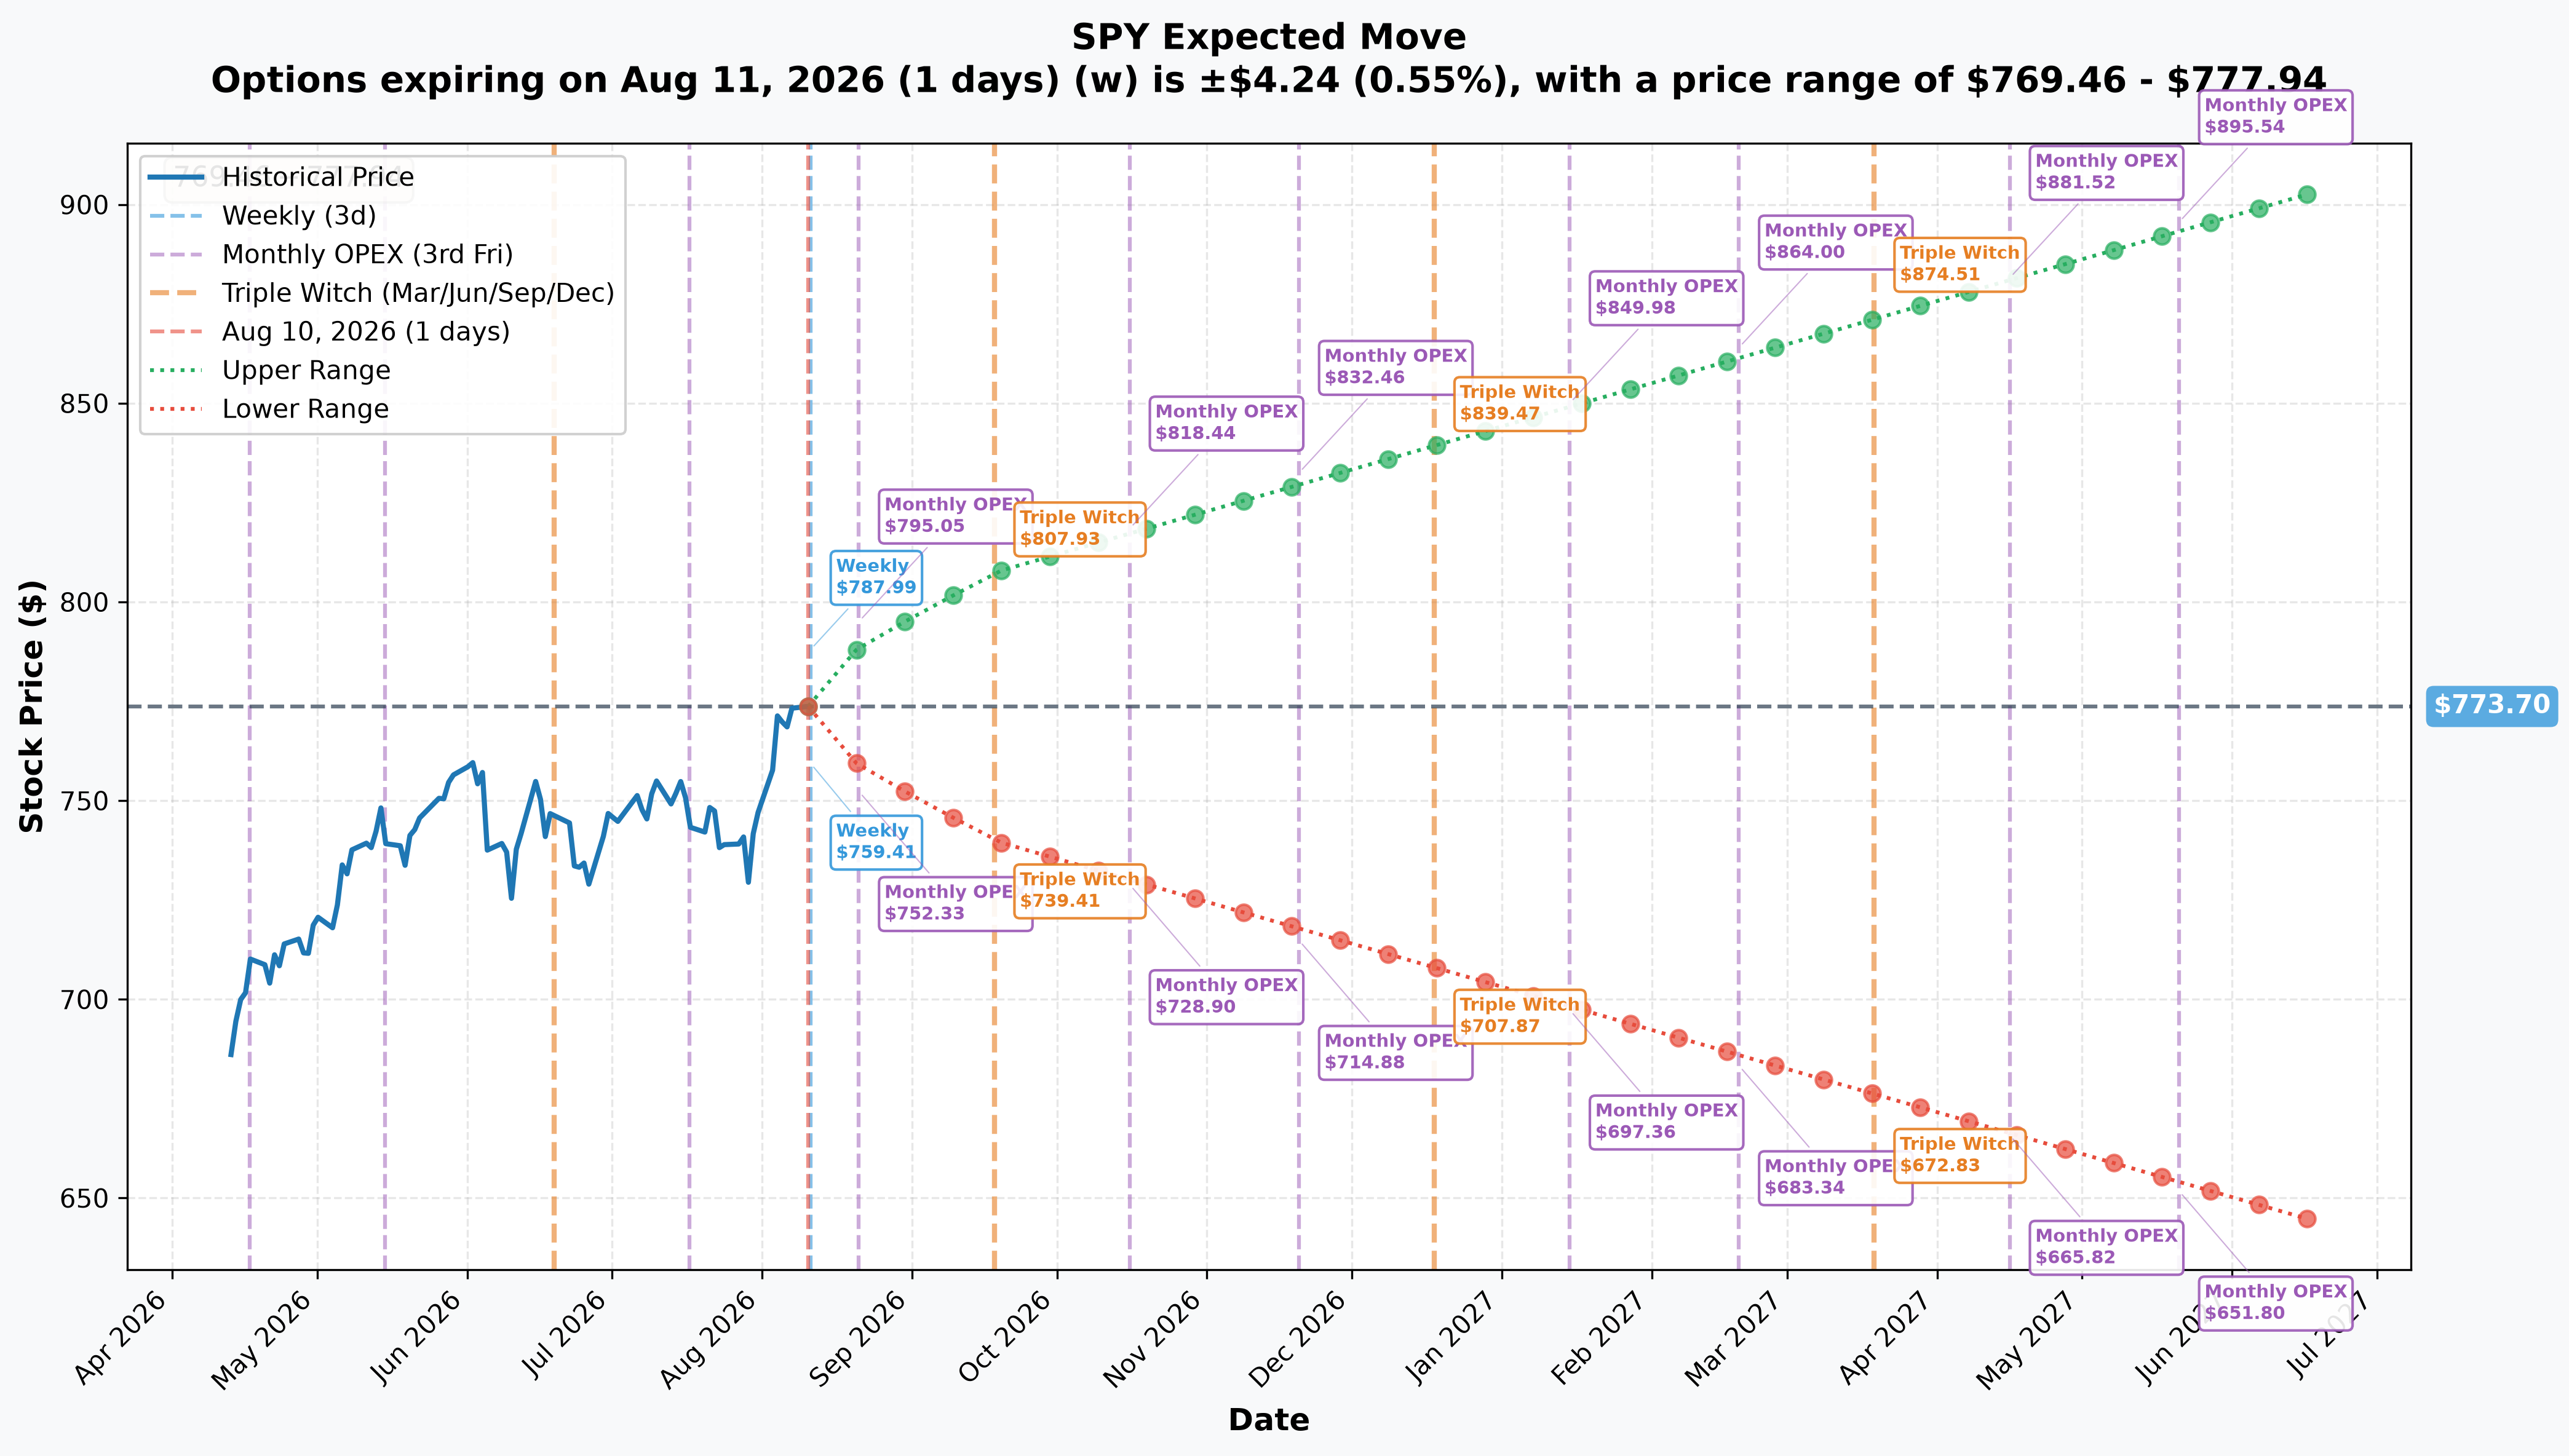
The implied-move data doesn't isolate Aug-14 exactly, but it brackets it cleanly:
- Weekly (Aug-11, 1 day out): ±0.55% / ±$4.24 → range $769.46–$777.94
- Monthly OPEX (Aug-21, 11 days out): ±1.99% / ±$15.41 → range $758.29–$789.11
- Quarterly triple witch (Sep-18, 39 days out): ±4.38% / ±$33.91 → range $739.76–$807.58
Interpolating between the two nearest brackets puts the market's implied move for Friday's Aug-14 expiration at roughly ±1.0–1.2% (≈$8–9) — a range that comfortably contains both the $775 and $780 strikes, which is exactly why they're such active gamma battlegrounds this week.
By contrast, the Nov-20 expiration (where the $700C sale lives) has a much wider implied range straight from the chart's own OPEX labels: $714.88–$832.46, roughly ±7.6% — reflecting the fact that it has to survive two FOMC meetings and a full earnings/data cycle the four-day contract never sees.
🎪 Catalysts
What lands inside the four-day window (now → Friday, Aug 14)
This window is a pure inflation trade — no Fed decision, no jobs report, no mega-cap earnings:
- Wednesday, Aug 12, 8:30am ET — July CPI. The dominant event of the window. June printed 3.5% headline / 2.6% core with energy still +15.7% year-over-year, per the BLS. With three FOMC members already dissenting in favor of a rate hike, per the Federal Reserve's July 29 statement, a hot print re-prices the September meeting directly.
- Thursday, Aug 13, 8:30am ET — July PPI, per Finance Calendar — the second inflation read in 24 hours.
- Friday, Aug 14, 8:30am ET — July Advance Retail Sales, per the Census Bureau — prints about one hour before the opening bell on expiration morning itself. With July payrolls down 23,000 and labor-force participation at a five-year low, per CNBC, this is the cleanest live read on whether the consumer is cracking, delivered right before these contracts stop existing.
Friday, Aug 14, 4:00pm ET is the expiration itself — not a catalyst. Don't confuse the two.
What the Nov-20 expiration (the $700C sale) has to survive instead
A completely different animal: two FOMC meetings (Sep 15–16 with a fresh dot plot, and Oct 27–28), at least four CPI reports (Aug 12, Sep 11, Oct 14, Nov 10), three jobs reports, NVIDIA's Q2 FY2027 earnings on Aug 26 (8.13% of SPY's weight — the single largest scheduled catalyst in the window), the Sep 30 fiscal-year-end/funding deadline (fiscal 2026 has already seen two shutdowns, per this compilation), and the Nov 3 US midterm elections, per Wikipedia. Nine of eighteen Fed officials have penciled in at least one 2026 hike, per Forbes — a live tail risk the bullish rally narrative largely ignores.
The bottom line on timing: the Aug-14 trade is a single-data-point bet on Wednesday's CPI print. The Nov-20 trade has to live through an entire macro-and-earnings cycle. They are not the same kind of position wearing different clothes.
🎯 Four-Reader Take
🎰 YOLO trader: Neither August leg is an opportunity, and the resolved open interest makes that clearer than the trade-day read did — no new long exposure was created at either strike. If you trade the $775C anyway, do it on your own thesis: it is four days from expiring and sitting almost exactly at the money. Position tiny, and know that theta and gamma will both be working against a static hold every single hour into Friday.
📈 Swing trader: The real information here is the $775/$780 gamma wall cluster, not the trade itself. If SPY is pinned between $773 support and $775–$780 resistance into Wednesday's CPI, that's a range to trade around the print, not through it blindly. The Nov-20 $700C sale isn't actionable information for a swing horizon — it's hedged and doesn't express a market view.
💰 Premium collector: The $700C sale is the more relevant structure conceptually — someone collected $17.42M selling calls against stock, a classic income overlay, just done at institutional scale and deep ITM. It's a reminder that premium-selling against a long position is a real, common strategy — just don't mistake this specific hedged package for a signal about where SPY is headed.
🌱 Beginner: This is a genuinely useful real-world lesson: a "$22M call buy" headline sounded exciting, but a big chunk of it was just someone buying back calls they'd already sold — closing risk, not opening a new bet. Before you ever read a big options print as "bullish" or "bearish," ask whether the size is bigger or smaller than the existing open interest. If it's smaller, you often can't tell open from close without waiting for the next morning's data.
⚠️ Honest Limits — What the Tape Cannot Prove
- We cannot confirm today whether the $775C leg is a new opening position or a partial close/rollover — size (30,000) sits below prior open interest (90,973). Only the Aug-11 through Aug-13 pre-market OI snapshots can settle it, and that window closes fast.
- The $780C "BTC" read was archive-verified high confidence, and the next-day OI test did not confirm it — open interest rose 2,275 instead of falling. The tape cannot tell us whether this particular buyer was covering; it can only tell us the strike's outstanding position did not shrink. We have corrected the article to say "transfer" rather than "cover."
- We don't know the counterparty, broker, customer identity, or order ID behind any of these three legs — OPRA data never reveals that.
- We can't see the paired stock leg's direction (long vs. short) on the $700C trade from the options tape alone, only that a stock leg exists and delta-hedges the package.
- We cannot see any invisible hedge in futures, other option series, or other tickers that might be part of a larger cross-asset position.
- None of this predicts where SPY trades Friday. It describes what happened on the tape today and what we can and cannot conclude from it.
Disclaimer: Options trading involves substantial risk of loss and is not suitable for all investors. This analysis is for educational purposes only and is not financial advice. At-the-money options with four days to expiration are among the fastest-decaying, highest-risk instruments retail traders can access — position sizing and risk control matter more here than almost anywhere else on the options board. Always do your own research and consider consulting a licensed financial advisor before trading.
Last updated: 2026-08-11 (pre-market) — the next-day OPRA open-interest snapshot resolved all three legs and corrected this article's original headline. Nov-20 $700C 1,387 → 3,356 (+1,969 on a 2,000-lot sale): OPEN (STO), at the top of the published range. Aug-14 $775C 90,973 → 82,935 (−8,038): not an open — the conditional bullish framing is withdrawn. Aug-14 $780C 145,531 → 147,806 (+2,275) against a predicted fall toward ≈85,531: the strike's position did not shrink, so the "mostly someone covering a short" claim is retracted as a stated fact and reframed as a transfer. The title, quick take, structure section, order-type cells, plain-English section, YOLO section and honest-limits were updated; the ⏳ callout was replaced with the ✅ RESOLVED box.