🪜 SPY: A $72.6M Credit Collected on 600,000 Puts — And the Long Leg Does Not Cap the Loss
📅 2026-08-13 | 🤝 Floor Block Detected
🎯 The Quick Take
At 09:59:56 ET a desk crossed a single negotiated package in SPY — 600,000 December-18 put contracts across three strikes, collecting ≈$72.6 million net. It is the largest trade we have seen this week by a wide margin.
The headline number is the credit. The number that matters is the loss. This structure is short two $480 puts for every one $350 put it owns — which means the long put does not put a floor under the position. Below $350 the losses keep compounding at roughly $2 for every $1 the market falls.
At today's $777.62, nothing about that is a near-term worry. The breakeven sits 22.2% below spot. But the difference between "unlikely" and "capped" is the entire risk of this trade, and it deserves to be said plainly before anything else.
🏛️ Fund Overview
SPY is the oldest and largest US-listed ETF, tracking the S&P 500.
| Attribute | Value |
|---|---|
| AUM | ≈$812.7B (issuer figure; independently cross-checked at $812.05B) |
| Gross expense ratio | 0.0945% |
| Holdings | 504 |
| Top 10 weight | ≈37.52% |
| Information Technology | 37.83% of the fund |
Largest positions: NVDA 8.14%, AAPL 6.66%, MSFT 5.48%.
A transparency note worth making: the issuer's own page headlines a "44.49%" concentration figure that does not reconcile with its published individual weights. We use the 37.52% that the weights actually sum to, and flag the discrepancy rather than repeat a number we cannot rebuild. Fund data per the issuer factsheet.
💰 The Trade, in Plain English
Three put legs, one timestamp, one negotiated package:
- 🔴 SOLD 300,000 December 18 $480 puts at $0.99 → ≈$29.70M collected
- 🔴 SOLD 150,000 December 18 $610 puts at $3.20 → ≈$48.00M collected
- 🟢 BOUGHT 150,000 December 18 $350 puts at $0.34 → ≈$5.10M paid
Gross premium traded: ≈$82.80M. Net credit: ≈$72.60M.
| Time | Buy/Sell | Call/Put | Expiration | Premium | Strike | Volume | OI | Size | Spot | Option Price | Option Symbol |
|---|---|---|---|---|---|---|---|---|---|---|---|
| 09:59:56 ET | SELL | PUT | 2026-12-18 | ≈$29,700,000 | $480 | 300,000 | 11,086 | 300,000 | $777.62 | $0.99 | SPY20261218P480 |
| 09:59:56 ET | SELL | PUT | 2026-12-18 | ≈$48,000,000 | $610 | 150,000 | 8,307 | 150,000 | $777.62 | $3.20 | SPY20261218P610 |
| 09:59:56 ET | BUY | PUT | 2026-12-18 | ≈$5,100,000 | $350 | 150,000 | 6,917 | 150,000 | $777.62 | $0.34 | SPY20261218P350 |
The ratio is the trade. Per unit the shape is long 1× $350 put, short 2× $480 puts, short 1× $610 put — a structure known as a broken-wing put ladder. In total: 450,000 short puts against 150,000 long, or roughly 45 million shares of notional obligation.
On the mechanism and the labels. This printed as a 🤝 negotiated floor block — worked off the open book with a known counterparty, not a lit sweep. There is no urgency signature and no aggressor to measure. The tape geometry does corroborate the reported sides (the $480 leg printed below the bid, the $610 at the bid, the $350 at the ask), but on a negotiated package that is corroboration, not proof. What the tape does prove: the mechanism, the sizes, the prices, and the prior open interest.
✅ RESOLVED — All Three Legs Opened, Contract for Contract
Updated 2026-08-14 pre-market. Resolving OPRA snapshot timestamped August 14 (reflects the August 13 close, after this print); baseline is the August 13 snapshot (reflects the August 12 close, before this print).
| Leg | Baseline (Aug-13) | Resolving (Aug-14) | Δ | Print size | Capture | Verdict |
|---|---|---|---|---|---|---|
| Dec-18 $480 put (sold) | 11,086 | 311,132 | +300,046 | 300,000 | 100% | ✅ OPEN (STO) |
| Dec-18 $610 put (sold) | 8,307 | 158,358 | +150,051 | 150,000 | 100% | ✅ OPEN (STO) |
| Dec-18 $350 put (bought) | 6,917 | 156,963 | +150,046 | 150,000 | 100% | ✅ OPEN (BTO) |
Every contract created new exposure. Each line rose by slightly more than the printed size — the small excess of 46 to 51 contracts per leg is ordinary same-day flow at those strikes, not part of this block. Nothing matched against existing holders. This is a genuine new 600,000-contract position, not a transfer of one that already existed.
The ladder is confirmed as published: short 300,000 $480 puts and 150,000 $610 puts against 150,000 long $350 puts, and the uncapped middle is now sitting in the open-interest book exactly as described.
Unchanged: the ≈$72.6M net credit, the negotiated-floor-block mechanism, and the fact that the BUY/SELL labels are reported rather than tape-proven. Open interest proves the position is new; it cannot prove who holds it or what sits behind it.
🤓 What This Actually Means — Plain English
Start with the simple version. Selling a put means you are paid now, and in exchange you promise to buy the index at the strike if it falls that far. Sell enough of them far enough below the market and the premium looks like free money, because the market rarely travels that far.
Now the structure. This desk sold puts at two levels — $610 and $480 — and bought protection at a third, $350. If the long put were bought one-for-one against the short puts, the loss would be capped: below $350 the long would offset a short and the damage would stop growing.
It is not one-for-one. For every one $350 put owned, two $480 puts were sold. So below $350 the position still has one uncovered short put per unit working against it. The loss does not stop — it keeps compounding at roughly $2 for every $1 the market falls.
Here is the whole payoff in one table:
| SPY at expiry | Move from today | Outcome |
|---|---|---|
| Above $610 | — | Maximum profit ≈$72.6M — the entire credit |
| $605.16 | −22.2% | Breakeven |
| $480 | −38% | Loss ≈$1.88B — roughly 26× the credit collected |
| $350 | −55% | Loss ≈$7.73B |
| Below $350 | worse | Still losing ≈$2 per $1 |
Two reference points make those strikes concrete. In index terms the $350 strike sits at the October 2022 low and the $480 strike at the January 2022 peak. So the trade is not betting the market never falls — it is betting the market does not return to levels it traded at within the last four years.
Why anyone takes the other side of that argument: because it usually works. Selling deep out-of-the-money puts wins the overwhelming majority of the time, and loses spectacularly on the rare occasion it does not. The credit is the compensation for that shape. Whether ≈$72.6M is adequate compensation for ≈$1.88B of risk at $480 is a judgment about probability, not a judgment about direction.
📈 Technical Setup
One-Year Performance
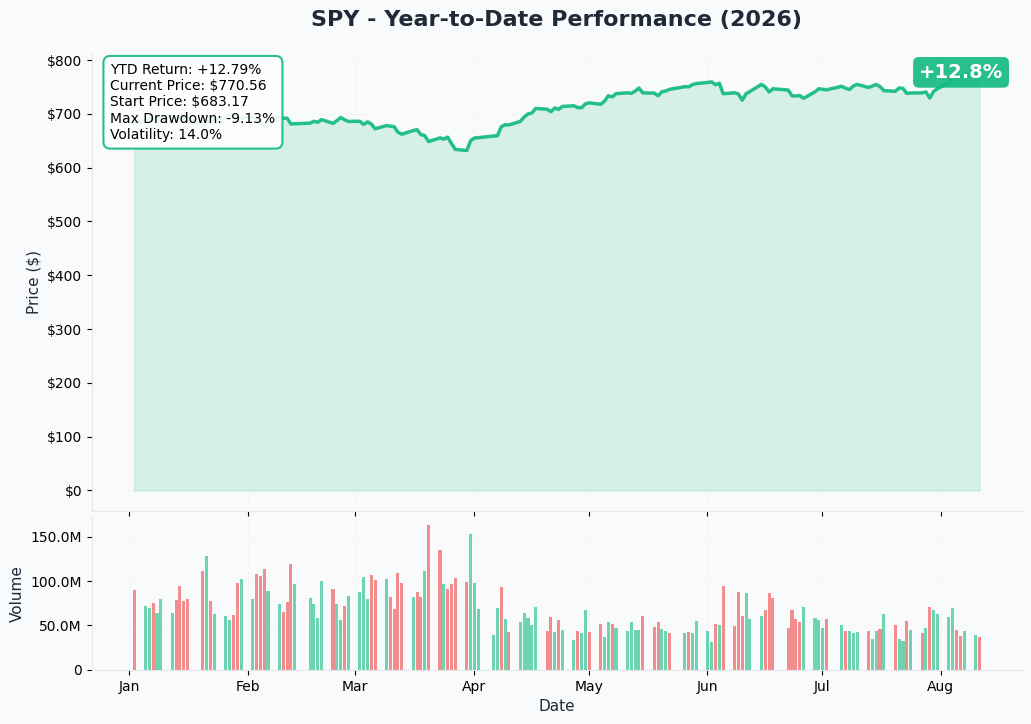
The S&P 500 closed 7,444.25 on May 13 and 7,799.96 on August 13 — +4.78% over the three months, and +13.95% year to date. But the path matters more than the endpoints: the entire three-month gain was earned in the first two weeks of August. SPY was essentially flat from mid-May through July 31 (the issuer's July NAV return was −0.07%), with a June 10 low of $725.43.
🔵🟠 Gamma-Based Support & Resistance
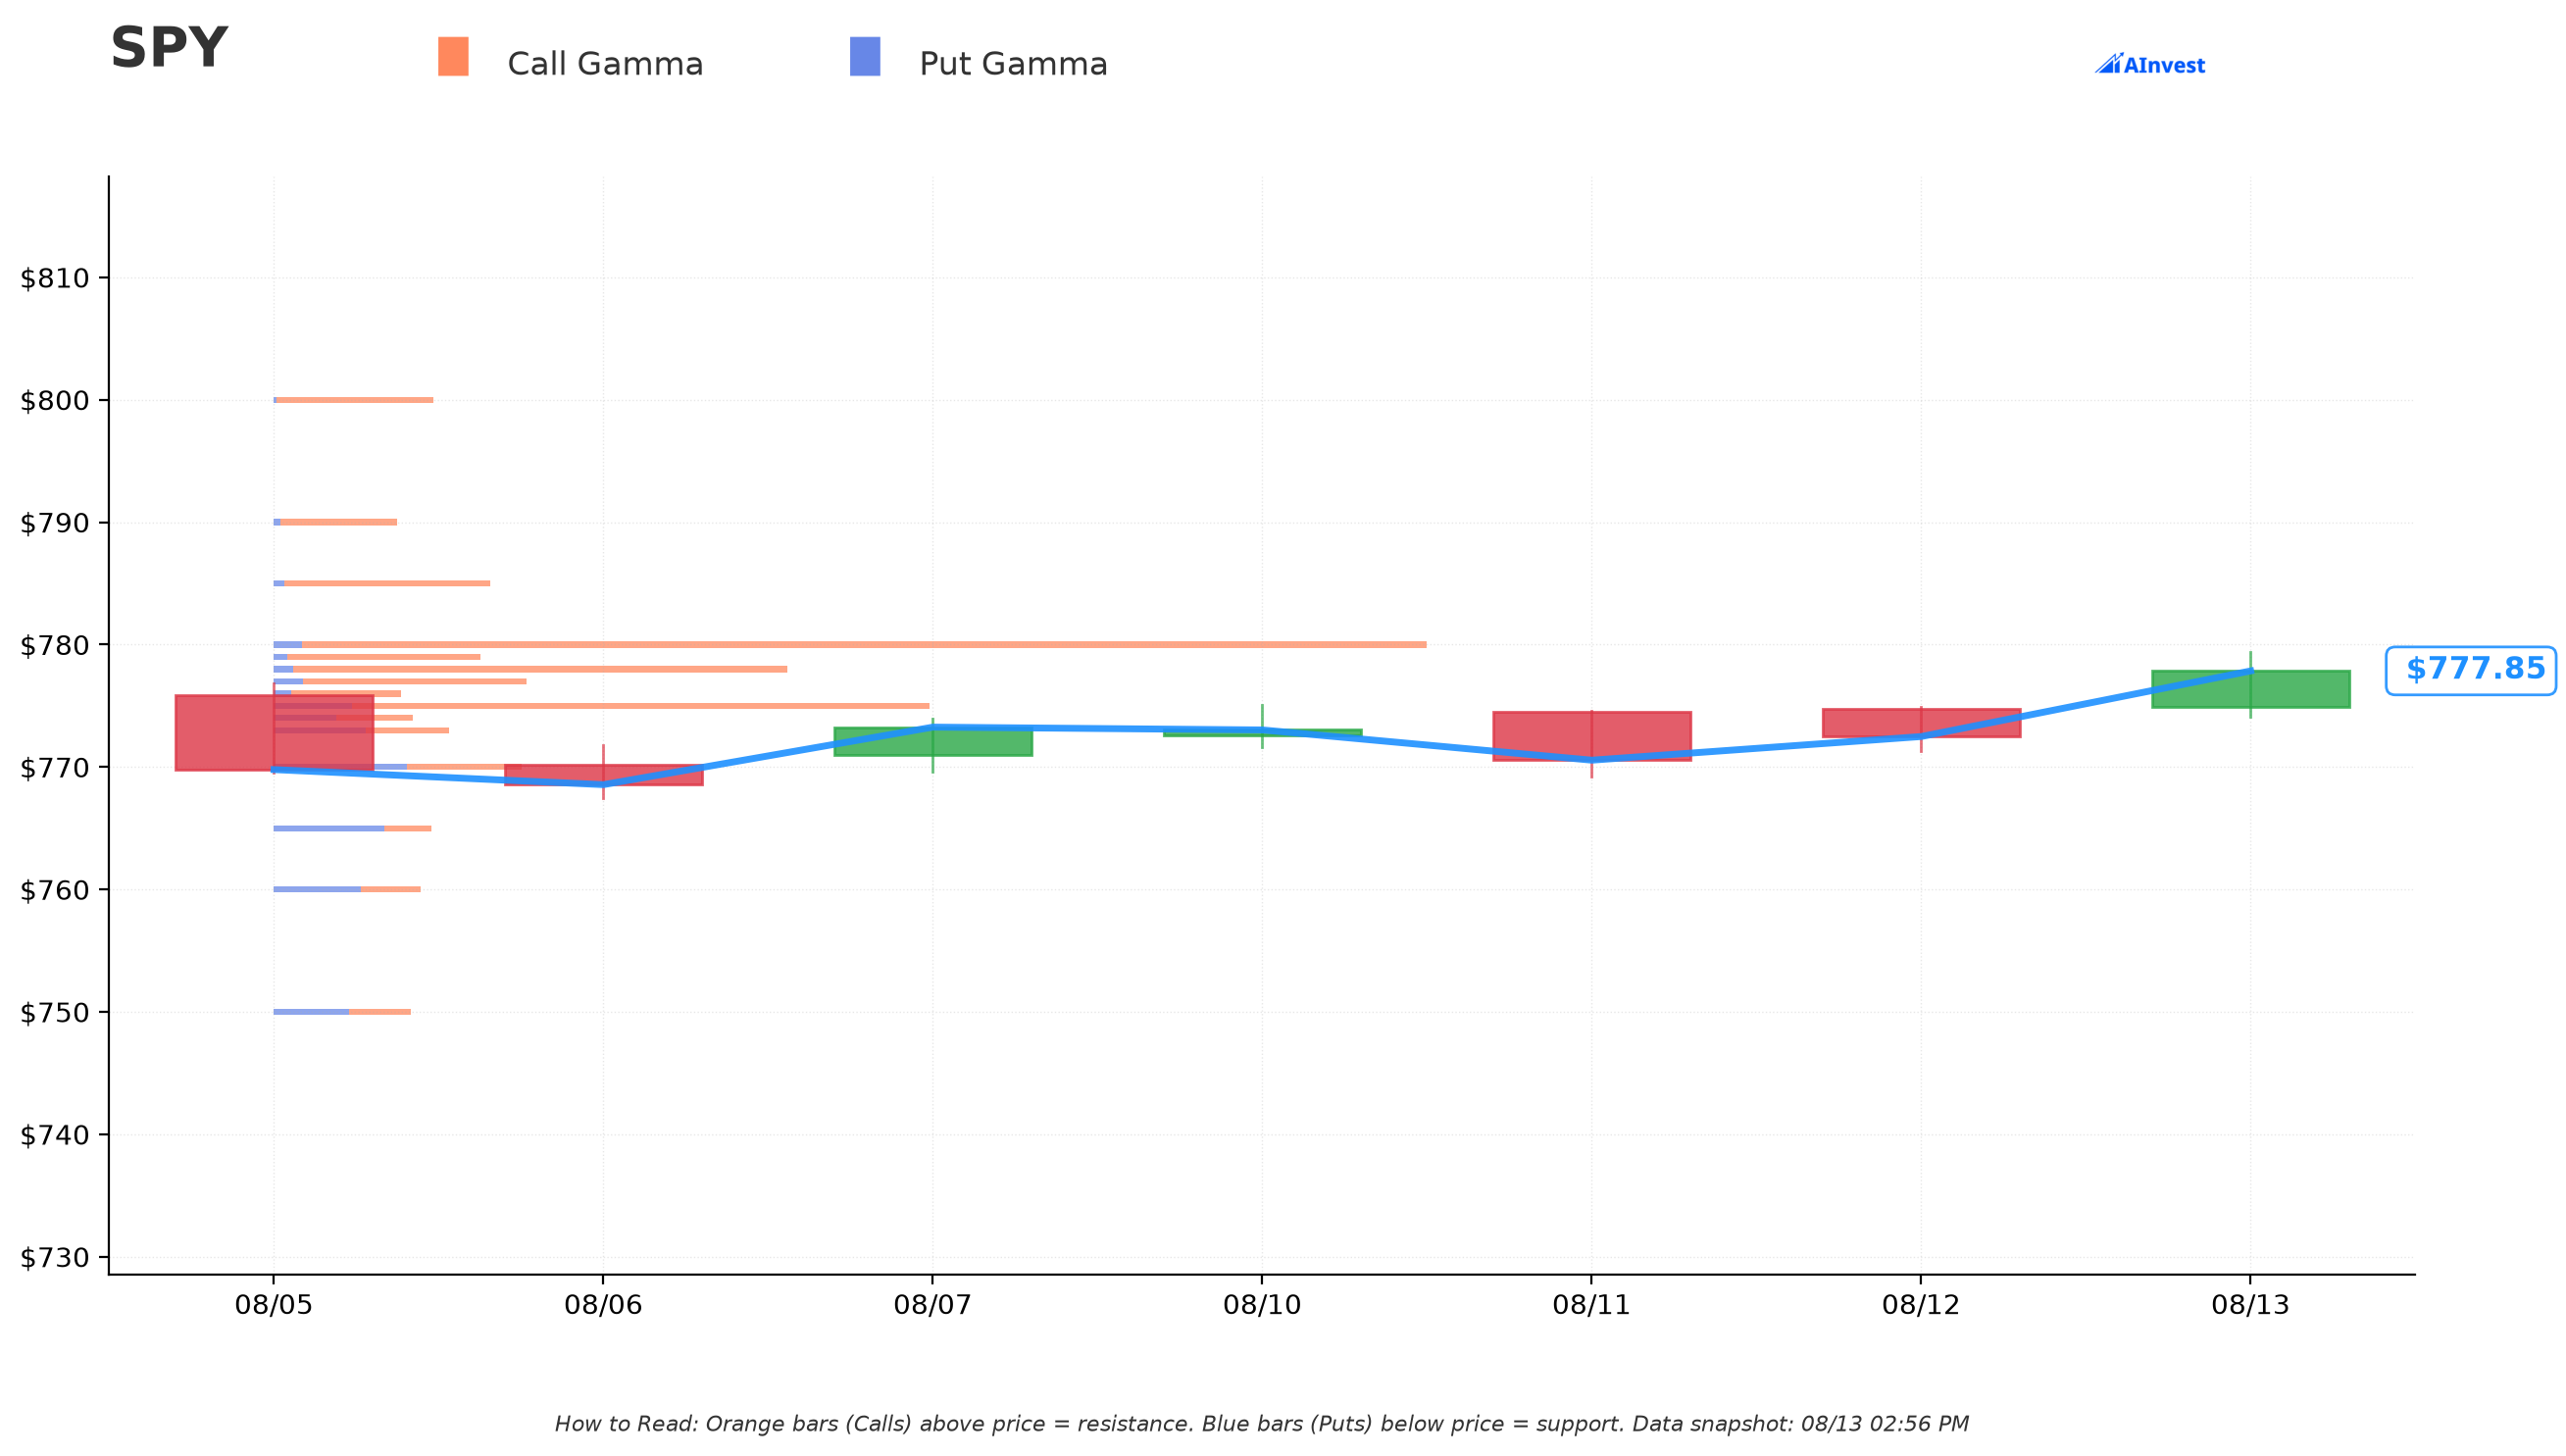
| Level | Strike | Strength |
|---|---|---|
| Resistance | $780 | Very Strong |
| Spot | $777.85 | — |
| Support | $775 | Very Strong |
Dealer positioning is tightly clustered right at the money — a $5 band around spot — which is consistent with an index that has spent the last fortnight grinding upward rather than trending hard.
🎯 Implied Move
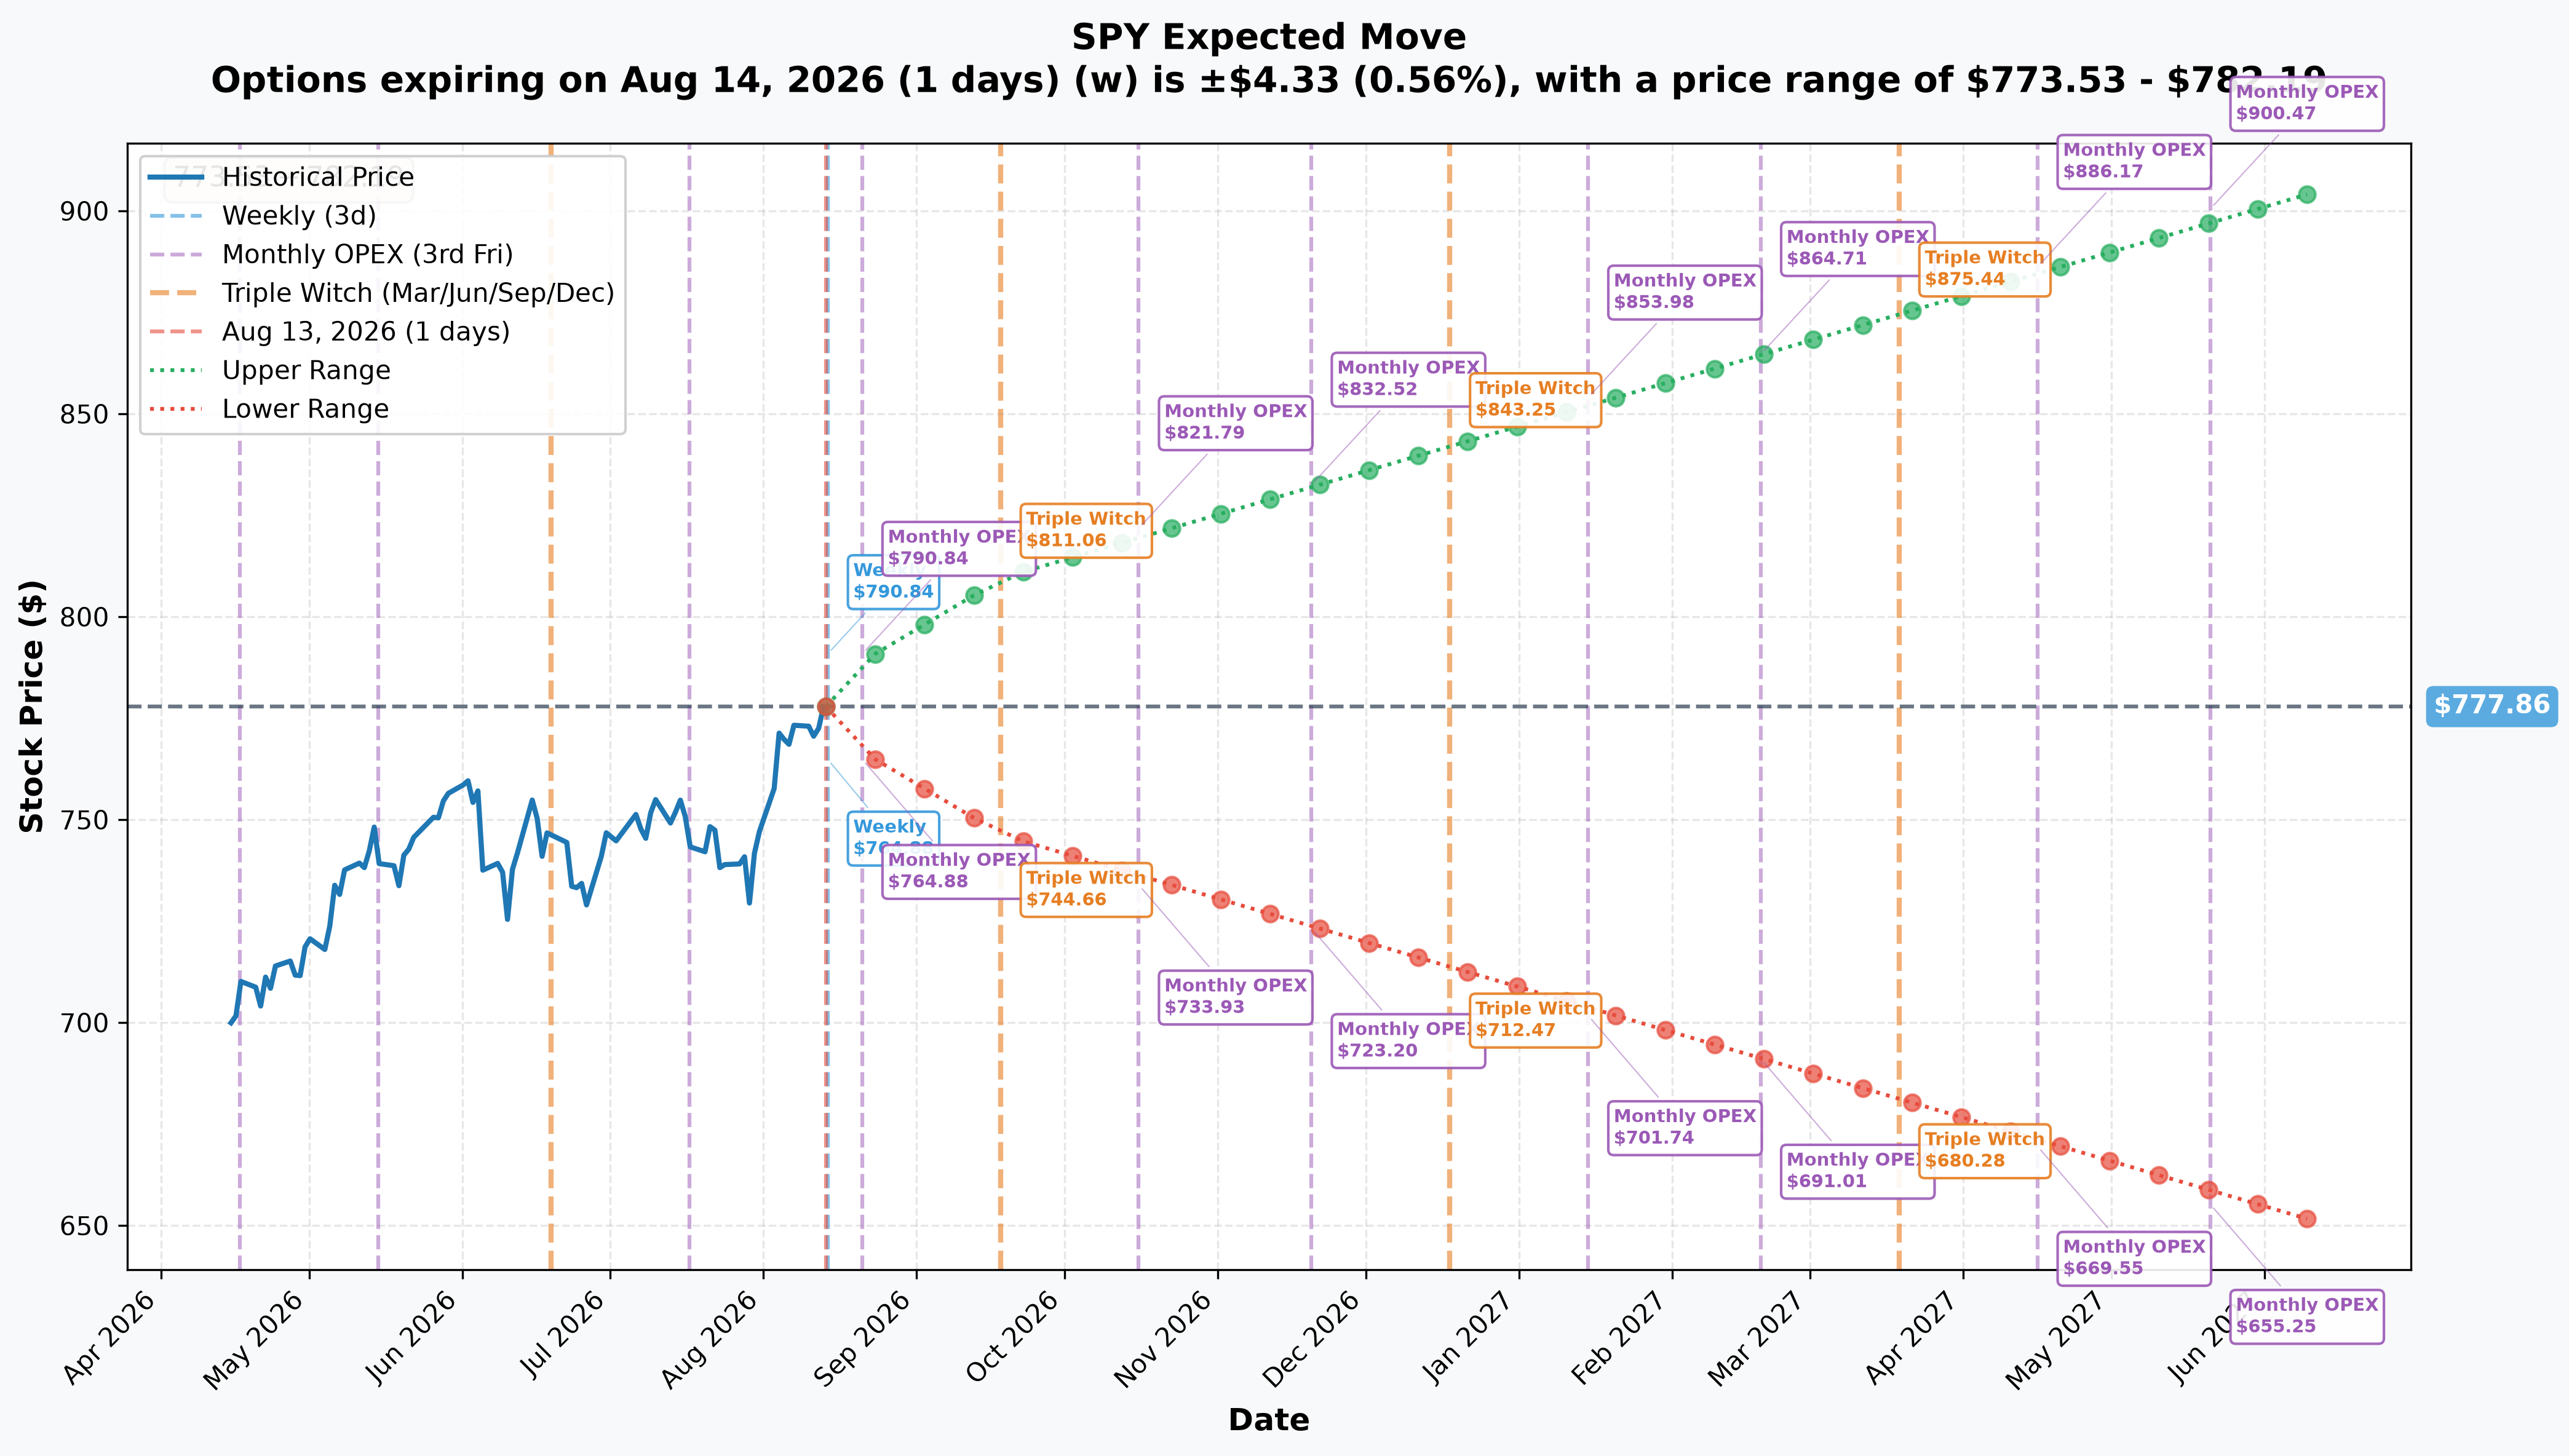
| Horizon | Implied move |
|---|---|
| Aug 14 | ±0.56% |
| Aug 21 | ±1.48% |
| Sep 18 | ±4.08% |
Read that against the trade. The options market is currently pricing a ±4.08% move over five weeks. This structure only begins to lose money on a −22.2% move, and reaches its worst outcomes at −38% and −55%. The market is not pricing anything remotely like the move that would hurt this position.
That cuts both ways, and honestly. It is precisely why the credit is available — you do not get paid $72.6M for risk the market thinks is likely. It is also why the risk is easy to underestimate: VIX at 14.70 sits at or below the bottom of its entire three-month range. Cheap volatility is when selling tails feels safest and is most dangerous.
🎪 Catalysts — And Which Ones Fall Inside December 18
Read this carefully: a catalyst date and an option expiration date are different things. The expiration is a market-structure date; the events below are economic ones.
Inside the 127-day window:
| Date | Event |
|---|---|
| Aug 26 | NVIDIA earnings — the single largest holding at 8.14% |
| Sep 15-16 | FOMC with Summary of Economic Projections |
| Oct 27-28 | FOMC |
| Nov 3 | US midterm elections |
| Dec 4 | November payrolls |
| Dec 8-9 | FOMC with projections — 9 days before expiry |
| Dec 10 | November CPI — 8 days before expiry |
In total: 3 FOMC meetings (2 carrying projections), 4 CPI prints, 4 payrolls reports, 4 PCE releases, the midterms, and NVIDIA's report. The highest-impact cluster is back-loaded into the final fortnight, precisely when a short-put position has the least time to recover from a shock.
The macro regime is more hostile than the index level suggests. Headline CPI is running +3.4% year over year with energy +14.7% (BLS). July payrolls came in at −23,000 with 103,000 of downward revisions (BLS Employment Situation). And at the July meeting three FOMC members dissented in favour of a rate hike, with the funds rate held at 3.50–3.75% under Chair Kevin Warsh (Federal Reserve). The 10-year sits at 4.645%, within 10bp of its 52-week high.
The identifiable tail risk has a name. The EIA reports Strait of Hormuz flows have collapsed to 4.9 million barrels a day from 21.6 million pre-conflict, with 5.5 mb/d of production shut in (EIA). That is an oil shock feeding exactly the inflation that would force the hawkish wing's hand — the plausible route from "expensive energy" to "policy mistake" to the kind of drawdown this structure is short.
Is a −22% move realistic by December? No single scheduled event in the window has precedent for it on its own. But the April 2025 drawdown of −23% in roughly seven weeks is barely a year old. This is not remote history, and it is the honest answer to anyone who calls the breakeven unreachable.
👥 Four Ways to Read This Trade
🎲 The YOLO trader
There is no lottery ticket here for you. The most convex leg — the $350 put — is the one this desk bought, and it costs $0.34 for something 55% out of the money. If you want the tail, that is the honest instrument, and you should expect it to expire worthless in almost every scenario. What you should not do is copy the short legs because the credit looks large.
📈 The swing trader
Four months is beyond your horizon, but the calendar is genuinely tradeable. The events cluster in the final fortnight — December 4 payrolls, December 8-9 FOMC with projections, December 10 CPI. If you trade index volatility, note that VIX at 14.70 is at the bottom of its three-month range while the macro data (negative payrolls, +3.4% CPI, hike dissents) is anything but calm. That gap is the observation, whichever way you lean.
💰 The premium collector
This is your trade, and it is the clearest lesson on the board. ≈$72.6M collected. ≈$1.88B at risk at $480 — about 26 times the credit. ≈$7.73B at $350. And critically, the long put does not cap it — below $350 losses keep compounding, because the structure is short two for every one it owns. If you sell index puts for income, the discipline this trade should teach you is to check the ratio before you check the credit. A defined-risk spread and a broken-wing ladder can look almost identical on a screen and behave nothing alike.
🌱 The beginner
Learn one idea: a big credit is not the same as a safe trade. Someone collected $72.6 million here, which sounds like a windfall. What they actually did was promise to buy the S&P 500 at prices 22% and 38% below today's — 45 million shares' worth. Most of the time that promise costs nothing and they keep the money. Occasionally it costs a fortune. And learn the second idea: check whether the "protection" leg actually protects. Here it doesn't, because there is only one of it for every two obligations.
⚠️ Honest Limits — What We Know vs. What We Don't
- Proven from the tape: the mechanism (a negotiated floor block, not a sweep), all three sizes, prices and strikes, the single timestamp, and the prior open interest at every leg — which is what makes all three provably opening positions.
- Corroborated but not proven: the direction of each leg. The $480 printed below the bid, the $610 at the bid and the $350 at the ask, which is consistent with the reported sides — but a negotiated block takes no liquidity, so there is no aggressor read and the BUY/SELL labels remain reported rather than tape-proven.
- Unknowable from any public source: who holds this, whether an offsetting equity or futures position sits behind it, whether it hedges an existing book, and what the desk's actual net exposure is. A position this size at an institution is rarely standalone.
- Research gaps, disclosed: this session's search budget was exhausted, so all sourcing was done by direct page retrieval. 2027 data-release dates are unpublished and therefore absent. Market-implied Fed probabilities could not be retrieved. The Q1 2026 drawdown could not be precisely dated.
- Not a recommendation. The payoff table above is arithmetic, not a forecast. Nothing here says the market will or will not fall 22%.
Last updated: 2026-08-14 — next-day OPRA open interest resolved all three legs as opens, contract for contract (see the ✅ RESOLVED section).
This is market analysis and education, not investment advice. Options carry substantial risk of loss, and uncovered short options carry theoretically unlimited risk.