🔄 TLT — CORRECTED: The $20.4M Put Block Created Zero New Open Interest. It Was a Transfer, Not a New Rate Bet.
🔄 INVERSION — updated 2026-08-07 pre-market. We called all four legs proven opens on size. Open interest says nothing opened at all. The resolving OPRA snapshot shows the January-2027 puts essentially unchanged: $110 put 7,776 → 7,776 (0), $107 put 500 → 500 (0), $120 put 140 → 140 (0), and $105 put 2,626 → 2,646 (+20) — against prints of 8,220, 1,620, 540 and 3,710 contracts. We checked the tape for cancellations and found none: all four are clean floor prints (no cancel conditions). The contracts changed hands; the market's net position did not change. No new short-duration exposure was created on August 6. See the ✅ RESOLVED box below; the title and thesis have been rewritten.
iShares 20+ Year Treasury Bond ETF holds long-dated US government bonds. Its price moves inversely to long-term interest rates — when long yields rise, TLT falls. The fund trades at $82.44. Follow it on the TLT fund page.
🤝 The Trade in Plain English
At 14:19:03, with the fund at $82.44, four put legs printed together — every one a floor trade, negotiated on the exchange floor:
| Time | Buy/Sell | C/P | Expiration | Strike | Size | Volume | OI (prior) | Option Price | Premium | Spot | Option Symbol |
|---|---|---|---|---|---|---|---|---|---|---|---|
| 14:19:03 | BUY | PUT | 2027-01-15 | $110 | 8,220 | 8,200 | 7,776 | $27.60 | $22,687,200 | $82.44 | TLT20270115P110 |
| 14:19:03 | SELL | PUT | 2027-01-15 | $105 | 3,710 | 3,700 | 2,626 | $22.50 | $8,347,500 | $82.44 | TLT20270115P105 |
| 14:19:03 | BUY | PUT | 2027-01-15 | $107 | 1,620 | 1,600 | 500 | $24.50 | $3,969,000 | $82.44 | TLT20270115P107 |
| 14:19:03 | BUY | PUT | 2027-01-15 | $120 | 540 | 540 | 140 | $39.00 | $2,106,000 | $82.44 | TLT20270115P120 |
Net: a $20,414,700 DEBIT. Package delta −554,170 shares. 🤝 BLOCK — floor-negotiated, not a sweep.
We originally wrote that all four legs were proven opens because every size exceeded its prior open interest. That inference was wrong — see the ✅ RESOLVED box below. Size exceeding prior open interest establishes that some contracts must be new only if the print is the sole activity and both sides are not simultaneously closing. Here the next-day count settled it: net open interest did not move.
✅ RESOLVED — Zero Net Open Interest Created. This Was a Transfer.
Updated 2026-08-07 pre-market. The ≈06:30 ET OPRA snapshot (which reflects the August 6 close) has published, and it contradicts the size-based opening read on all four legs.
| Leg | Baseline OI (Aug-6 snap) | Predicted | Actual (Aug-7 snap) | Δ | Print size | Δ as % of print | Day vol | Verdict |
|---|---|---|---|---|---|---|---|---|
| Jan-15-2027 $110 P (bought 8,220) | 7,776 | ≈16,000 | 7,776 | 0 | 8,220 | 0% | 8,220 | ⚠️ NOT AN OPEN — flat, transfer |
| Jan-15-2027 $105 P (sold 3,710) | 2,626 | ≈6,300 | 2,646 | +20 | 3,710 | ≈0.5% | 3,710 | ⚠️ NOT AN OPEN — flat, transfer |
| Jan-15-2027 $107 P (bought 1,620) | 500 | ≈2,100 | 500 | 0 | 1,620 | 0% | 1,620 | ⚠️ NOT AN OPEN — flat, transfer |
| Jan-15-2027 $120 P (bought 540) | 140 | ≈680 | 140 | 0 | 540 | 0% | 1,120 | ⚠️ NOT AN OPEN — flat, transfer |
Four legs, $20.4M, and a combined net open-interest change of twenty contracts.
We ruled out the obvious alternative first. A flat open-interest reading after a large print has two explanations: the print was busted (cancelled after the fact, which would leave the volume on the record but no position behind it), or it was a pure transfer. We pulled the OPRA tape for each strike and found single clean prints at 14:19:03 carrying floor-trade conditions, with no cancellation records anywhere in the session. The trades stood. So this is a transfer.
What a transfer means here. Every contract that was opened by one account was closed by another, exactly offsetting. In practice, on a deep in-the-money multi-leg floor block, that is the signature of a position being moved — between accounts, between funds, or between clearing brokers — rather than risk being put on. Somebody who already owned this January-2027 put structure handed it to somebody else at an agreed price.
So the central claim of the original article does not hold. We wrote that "somebody has paid $20.4M to be short long-dated US government bonds" and that this was "a bet that long yields go higher." The position is still a short-duration position, and it still carries −554,170 shares of delta — but it is not a new one. Nobody added that view to the market on August 6. It already existed, and it simply moved.
The distinction matters for a reader. A new $20.4M duration short is a signal: someone with capital took a macro view at a moment in time, ahead of three Fed meetings. A transfer of an existing position is not a signal at all — it carries no information about when the view was formed, at what level, or whether either party still believes it.
What is still unknowable. Who transferred what to whom, why, and at what original cost. Open interest shows the net; it does not name the participants or their motive. We also cannot rule out that the transfer accompanied a broader portfolio move we cannot see.
What This Position Actually Is
Every strike — $105 to $120 — sits far above the $82.44 fund price, which makes all four puts deeply in the money. The deltas confirm it: between −0.81 and −0.84, so these behave much more like short bond positions than like conventional options.
Three legs bought, one sold, and the sizes do not pair off. Net, this is long a large block of deep in-the-money puts — and the package delta of −554,170 shares says the same thing plainly.
In plain terms: $20.4M of short exposure to long-dated US government bonds changed hands. Since TLT falls when long-term rates rise, whoever now holds it is positioned for long yields going higher — but, per the resolution above, that position was not created on August 6. It was transferred.
⭐ The Timing Fits the Fed's Own Record — With One Caveat
The macro backdrop below is why a short-duration position makes sense at all. Read it as context for the position that exists, not as evidence that somebody chose this moment to establish it — the open-interest record says they did not.
The July 29, 2026 FOMC held rates at 3.50–3.75% on a 9–3 vote, and the statement names Hammack, Kashkari and Logan as preferring a quarter-point increase (Federal Reserve). Three officials wanted to hike.
Three more FOMC meetings fall inside the January-2027 expiry — September 15–16 (with projections), October 27–28, and December 8–9 (Federal Reserve) — and so do the November 3 midterm elections, which feed fiscal expectations directly into long-end yields.
🤓 What This Actually Means — Plain English
Bond prices and interest rates move in opposite directions. When rates rise, existing bonds paying lower rates become less valuable. TLT holds 20-year-plus Treasuries, which makes it the most rate-sensitive mainstream fund available — small moves in long yields produce large moves in the price.
Buying puts on TLT is therefore a bet that long-term rates rise. Buying deep in-the-money puts, at a delta above 0.8, means the buyer wants something close to a direct short position rather than a lottery ticket — they are paying for exposure, not for convexity.
One caution worth stating: deep in-the-money options carry large premiums with little time value, so the cost of being wrong is high in absolute dollars even though the percentage move required is small. This is a position with real capital at risk, not a cheap hedge.
Why not simply short the fund? Defined maximum loss, no borrow cost, and no risk of the short being recalled. The trade-off is the premium paid and the January deadline.
And the correction, in one sentence: all of the above describes what this position is — but the next-day open-interest count proves nobody put it on that day. It was handed from one holder to another, which is a very different thing from $20.4M of fresh conviction hitting the tape.
📊 The Charts
One-Year Price Action
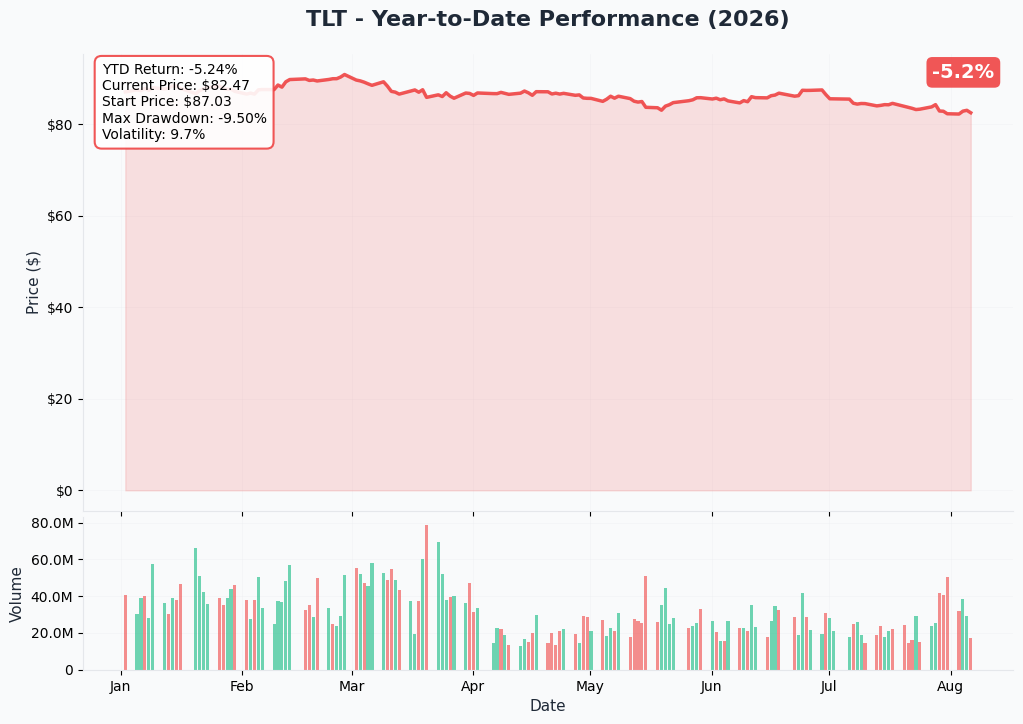
TLT is −5.2% over the past year — consistent with a market that has been repricing long rates upward rather than downward. The position that changed hands is aligned with that continuing; note it was established at some earlier, unknown point rather than on August 6.
Gamma Support and Resistance
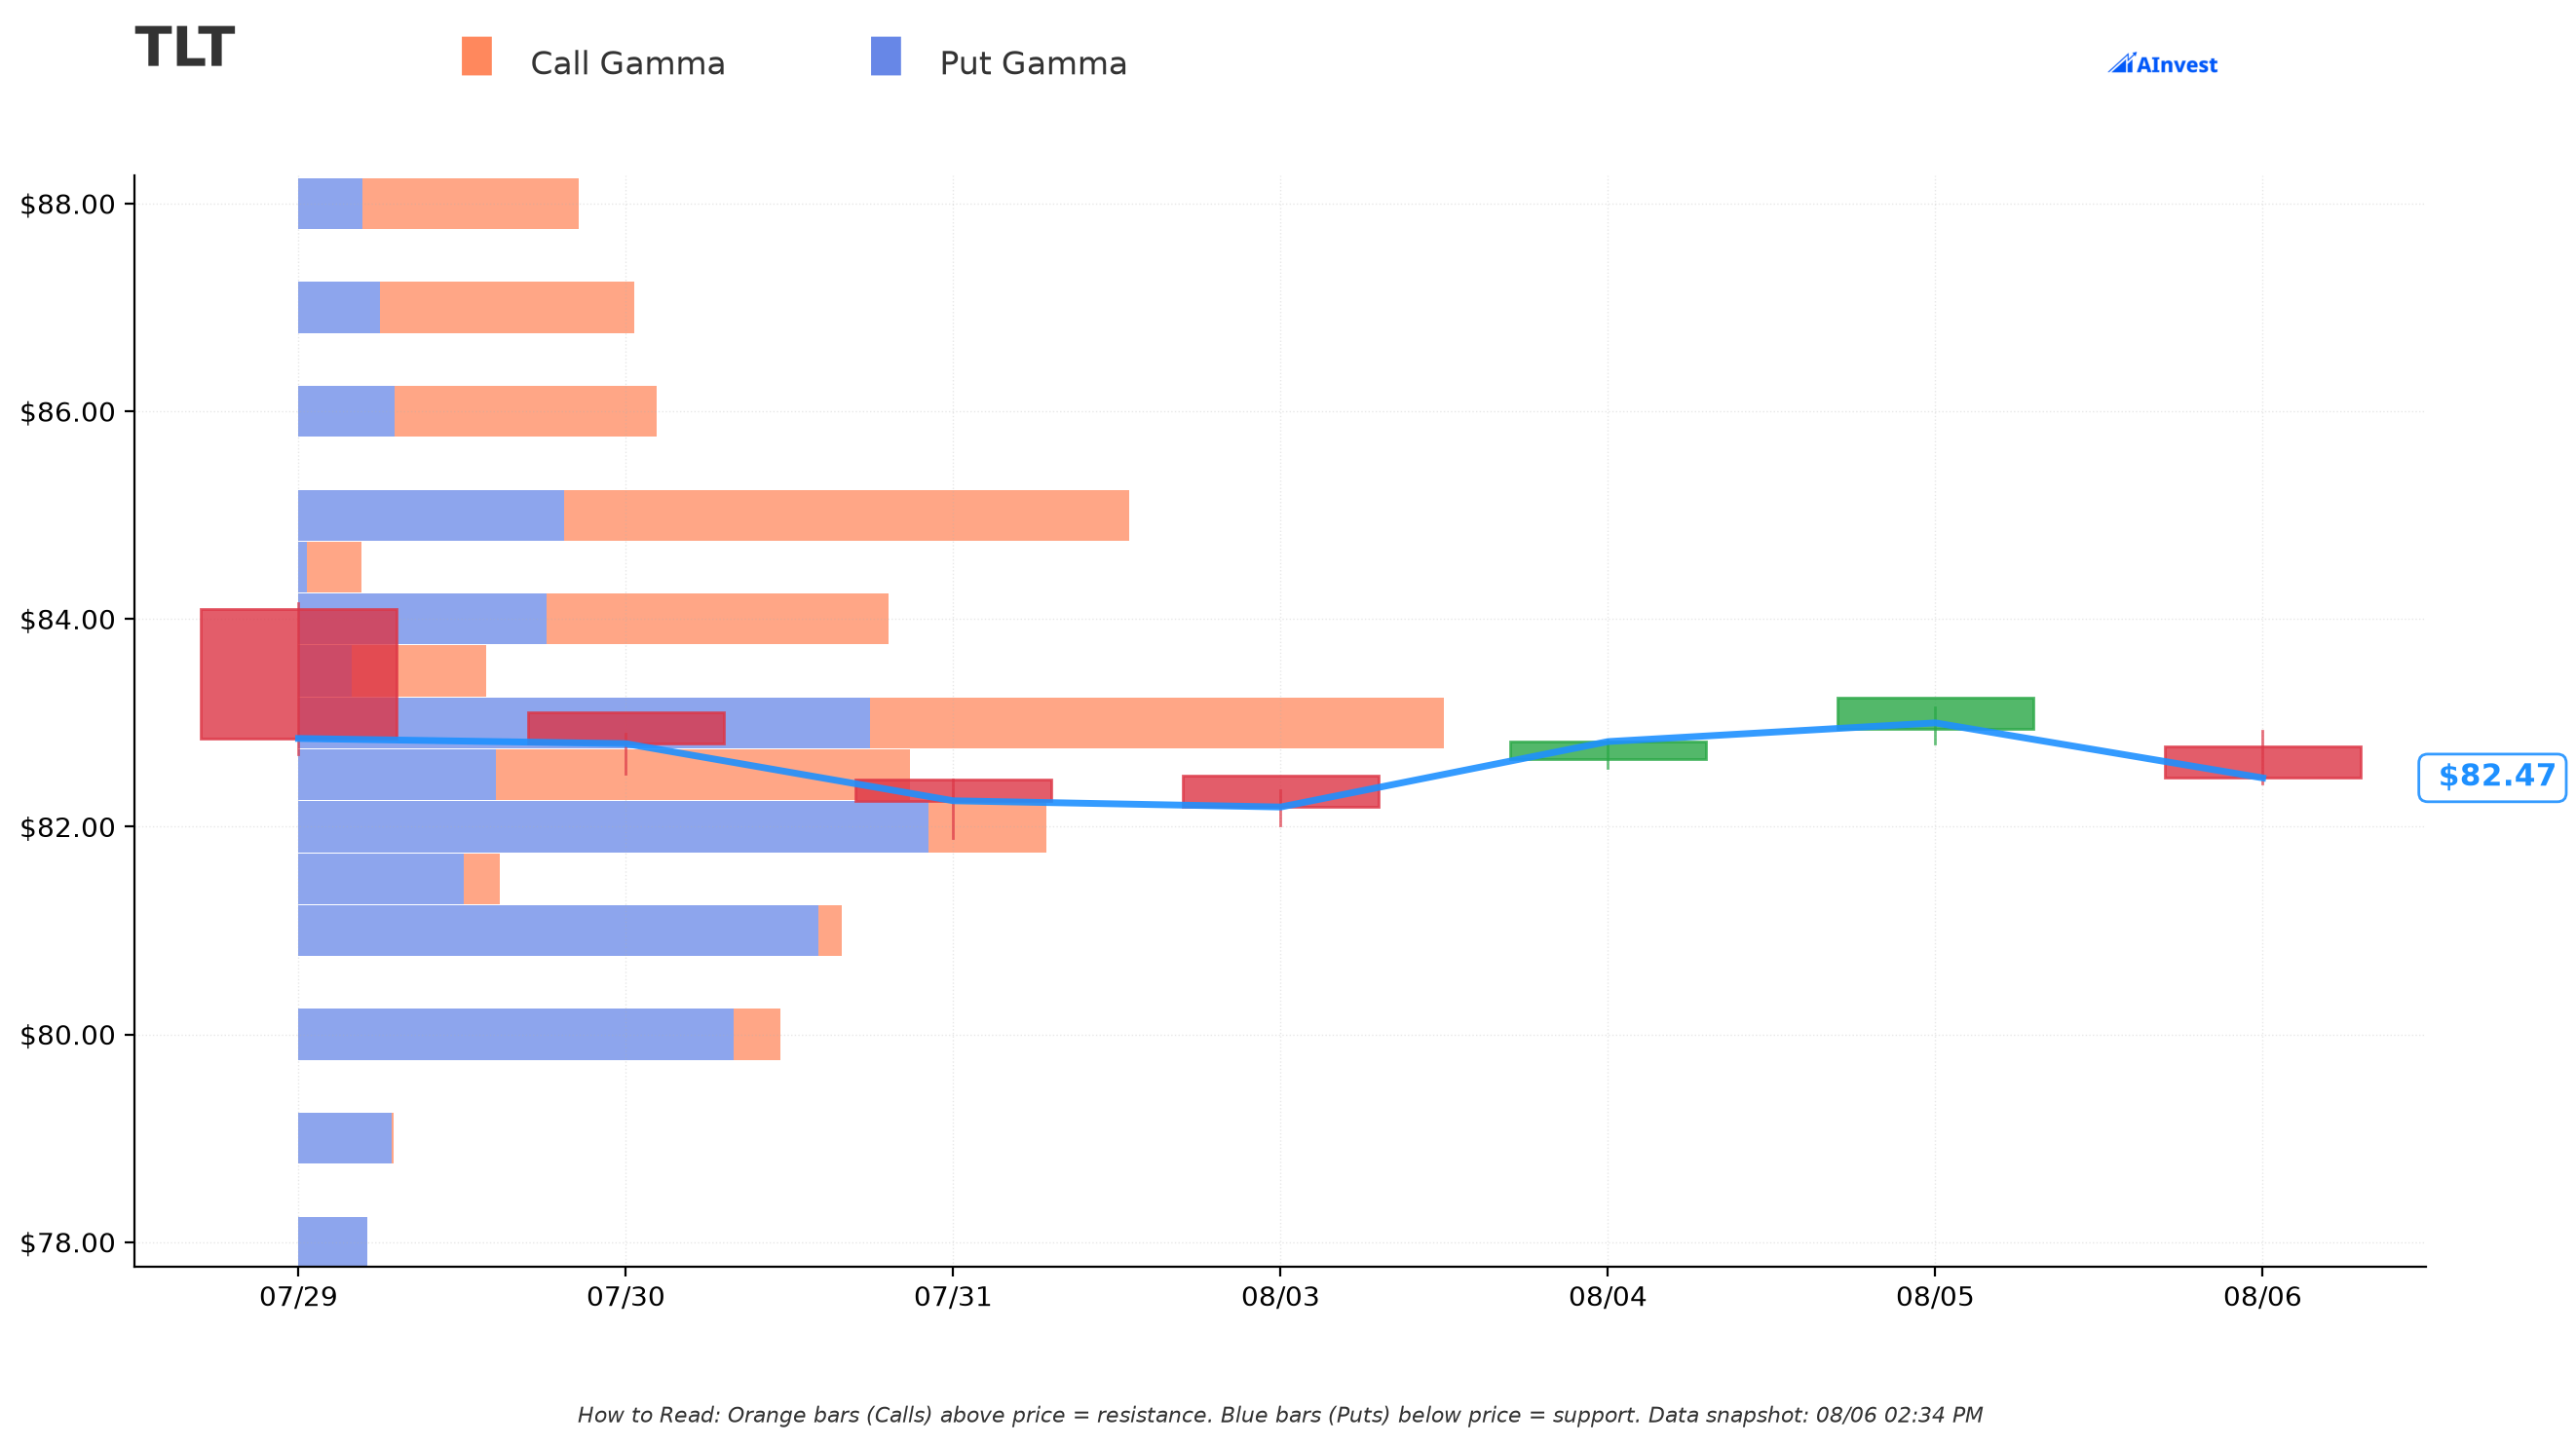
The chart shows where dealer hedging concentrates around the current price. All four strikes in this trade sit far above it, between $105 and $120 — deep in-the-money options are not where gamma lives, which is consistent with a position taken for direct exposure rather than for a hedging effect.
Implied Move
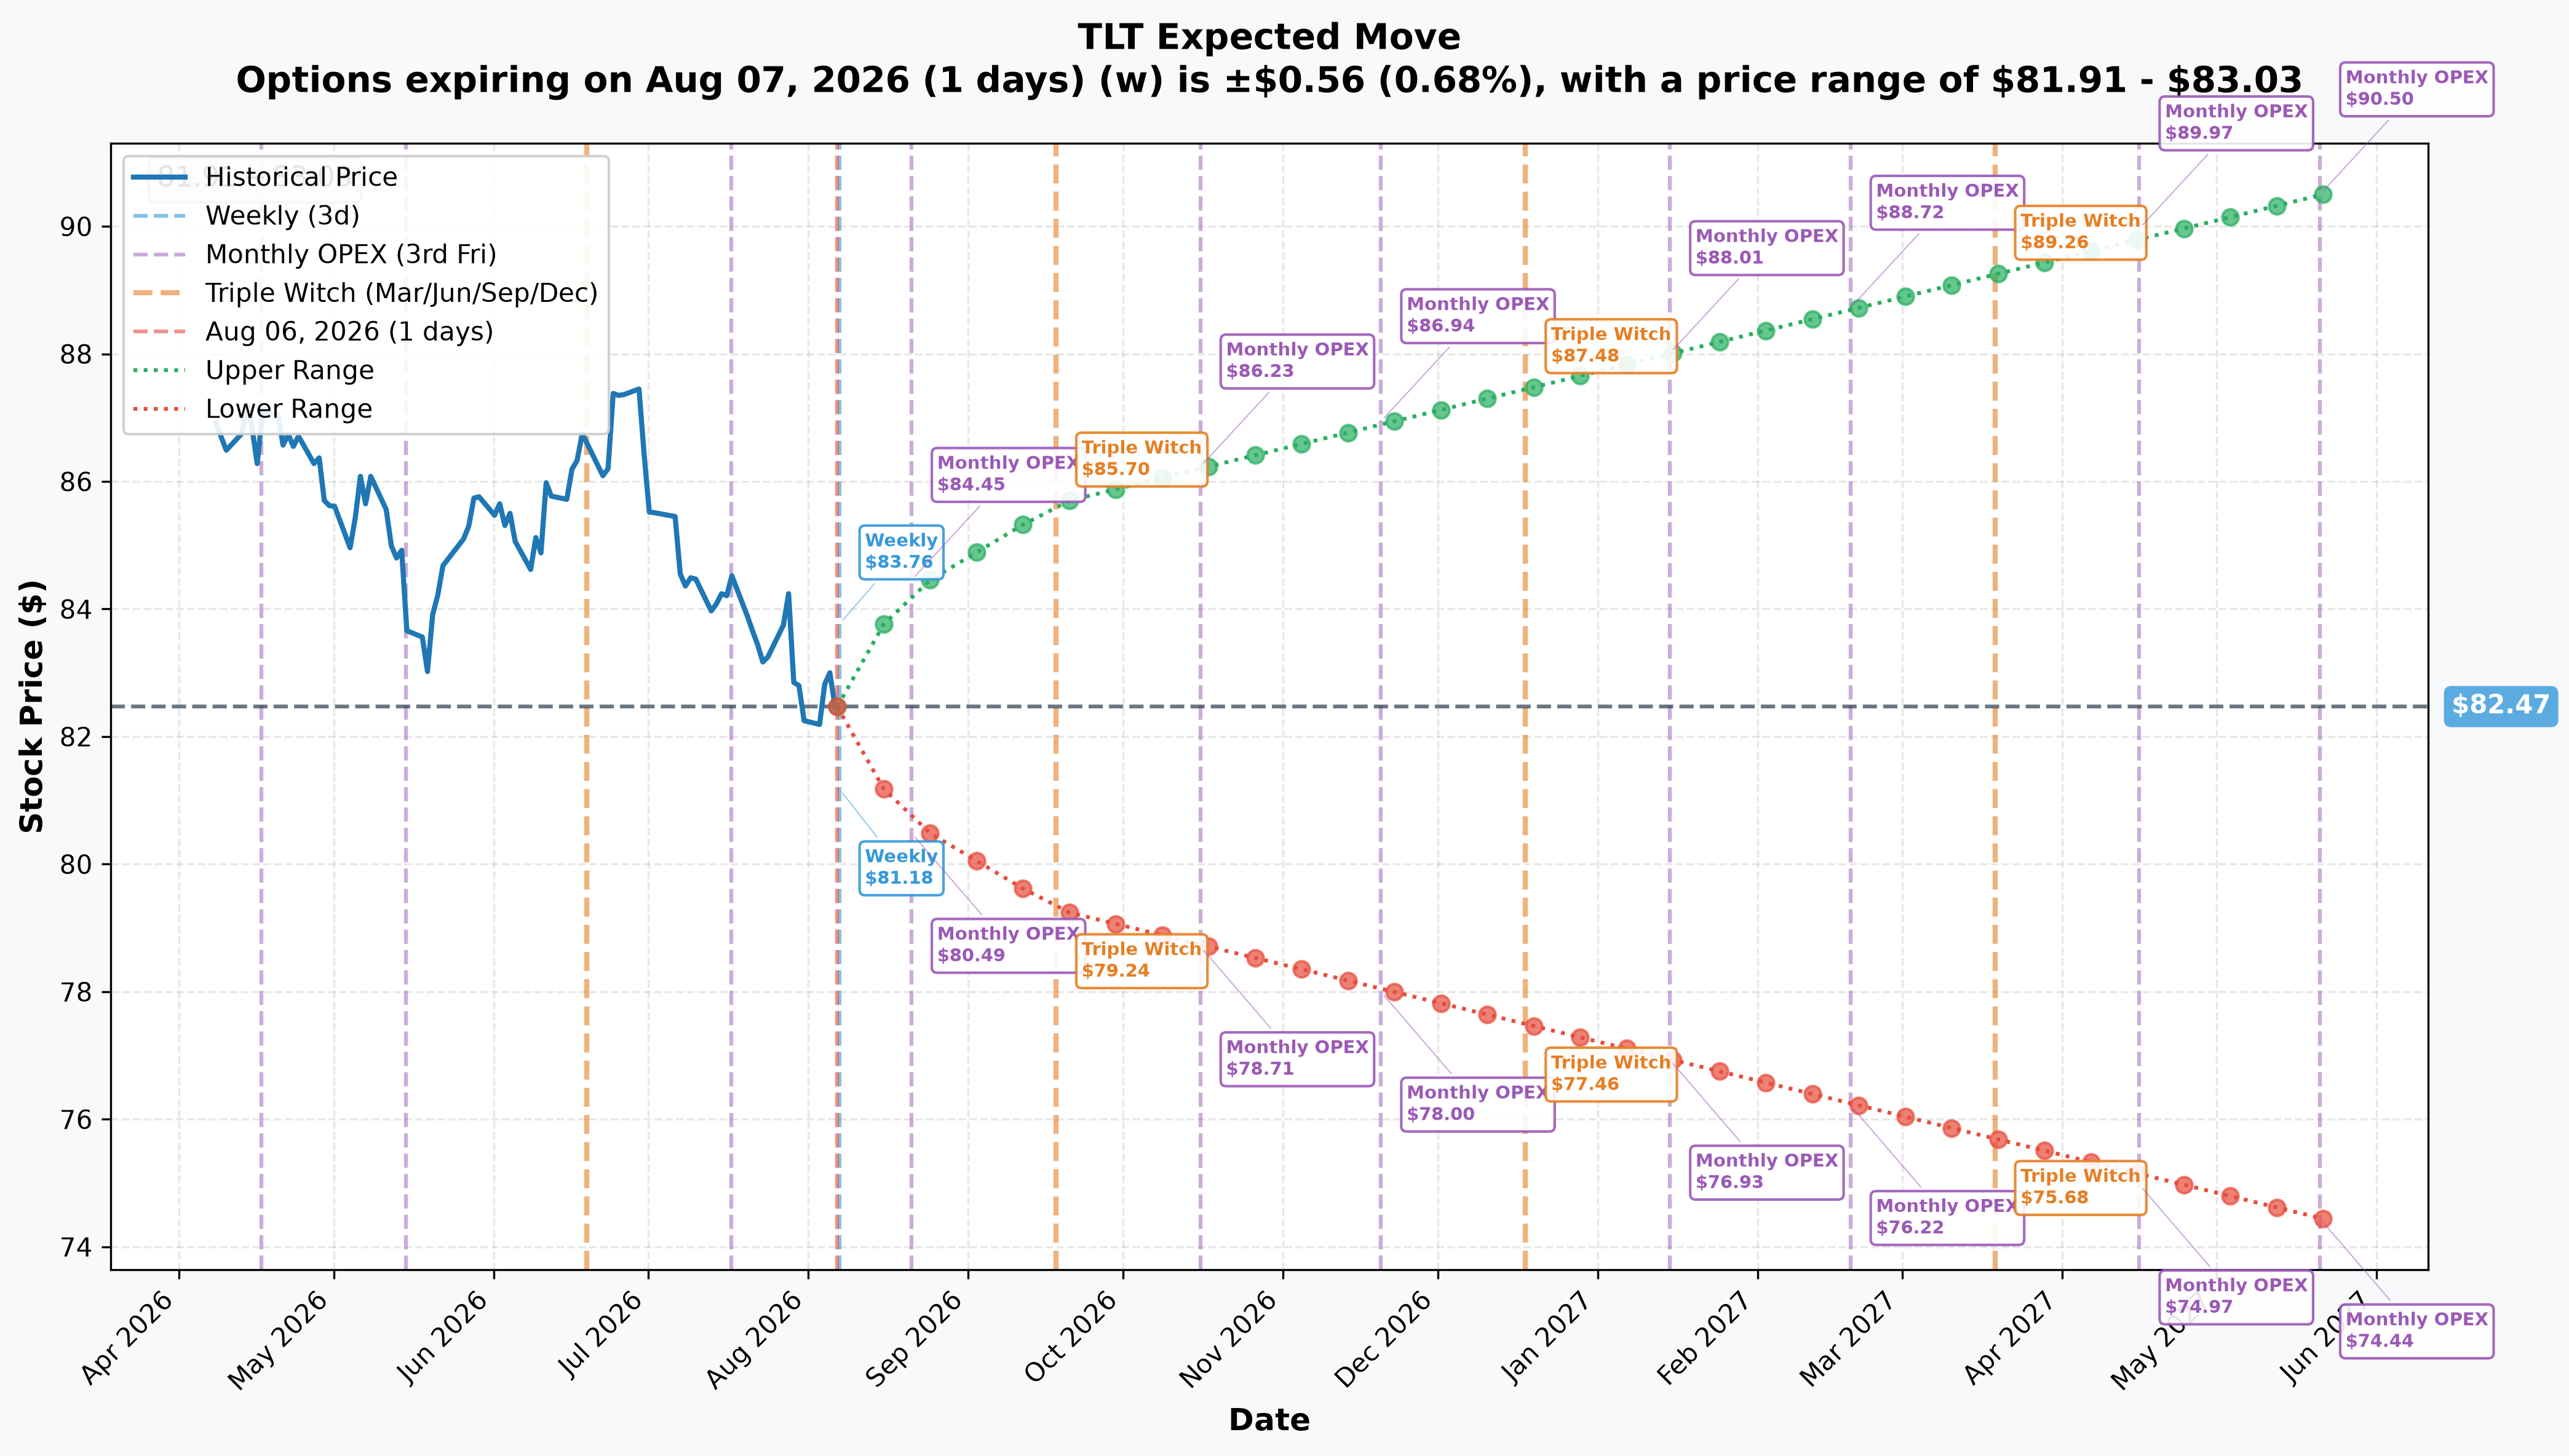
Compare the chain's expected range through January against the current $82.44. Because these puts are already deep in the money, they profit from any further decline rather than needing a threshold move — a different payoff profile from the out-of-the-money hedges elsewhere on today's board.
📅 Catalysts
- ⭐ Three FOMC meetings inside the expiry: September 15–16 (with projections), October 27–28, and December 8–9 (Federal Reserve).
- The Fed is debating hikes, not cuts. July 29's hold came on a 9–3 vote with three dissents preferring an increase (Federal Reserve).
- The November 3, 2026 midterm elections also fall inside the expiry, and fiscal expectations transmit directly into long-end yields.
- ⚠️ We could not source the current long-bond yield, the fund's assets, expense ratio, duration or flow data this session. We are leaving those out rather than estimating them.
👥 Four Ways to Read This
🎲 The YOLO trader — deep in-the-money puts are not your instrument. At $27.60 a contract this costs real money and gives you roughly 0.82 of the fund's move, not leverage.
📈 The swing trader — we originally called this the clearest macro expression on the board. It is not, and that is the correction that matters most for you: no new macro view was expressed. Three Fed meetings still sit inside the January window, but this print is not evidence that somebody just took a position ahead of them.
💰 The premium collector — the $105 leg looked like your side of a large long position with a partial offset. With the transfer confirmed, there is no new short premium here to take the other side of; the whole package was already someone's book before it printed.
🌱 The beginner — two lessons. The durable one: bonds and rates move opposite ways, so buying puts on a long-bond fund is a bet that interest rates rise, not that "the market falls." The sharper one: a large print with flat next-day open interest means no new position was created. Volume is not exposure. Always check whether the contract count actually grew.
⚠️ Honest Risk and Limits — What the Tape Cannot Prove
- The opening read was wrong and has been corrected. Net open interest across the four legs moved by twenty contracts against $20.4M of prints. This was a transfer of an existing position, not a new one.
- We cannot identify either party to the transfer, when the position was originally established, or at what price.
- We cannot see bonds, futures or swap positions this may hedge. A large asset manager holding duration exposure through options usually has something else on the other side.
- The legs do not pair cleanly, so calling this a specific named structure would overstate what the tape shows. What is solid is the net shape: long deep in-the-money puts, −554,170 shares of delta — now sitting in a different account than it did the day before.
- We could not source basic fund data or a current yield this session — the fundamental picture here is incomplete by our own admission.
Nothing here is investment advice.
Last updated: 2026-08-07 — 🔄 INVERSION. Next-day OPRA open interest refuted the size-based opening read on all four legs: $110 put 7,776 → 7,776 (0), $105 put 2,626 → 2,646 (+20), $107 put 500 → 500 (0), $120 put 140 → 140 (0), against prints totalling 14,090 contracts. The OPRA tape was re-checked for cancellations and none exist, so this was a pure transfer, not a bust and not a new position. Title, lead, thesis, plain-English, chart, reader and risk sections were rewritten.