📉 TLT $2.66M Synthetic Short Bets Long-Term Yields Break Higher
📅 2026-08-11 | 🤝 Block Cross Detected
🔄 Updated 2026-08-12 pre-market — the next-day OPRA open interest confirmed both legs, and both came in well above prediction. The September $82 put — the genuinely unresolved leg — opened: open interest rose 114,053 → 141,224 (+27,171) against a 20,000-lot buy, comfortably clearing the ≈20,000 rise we said would confirm a fresh open. The $82 call opened too, and far harder than expected: 8,474 → 57,409 (+48,935) versus the ≈28,000+ we published. The synthetic short is confirmed on both sides, and the short-call build at this strike is roughly 2.4× larger than the block itself. See the ✅ RESOLVED box.
🎯 The Quick Take
At 12:03:23 ET, a desk crossed 20,000 September $82 puts (bought, ≈$2.10M) against 20,000 September $82 calls (sold, ≈$2.66M) on TLT — same strike, same expiration, ≈$0.56M net credit. That combination is a synthetic short: it behaves almost exactly like shorting 2,000,000 shares of TLT, and because TLT moves opposite to long-term Treasury yields, this is a bet that the 30-year yield keeps climbing past its already-25-year high. It printed as a negotiated block cross, not a lit sweep, so there's a known counterparty on the other side — weigh that before reading it as pure conviction.
💰 The Option Flow Breakdown
📊 What Just Happened — Fund Overview First
TLT is the iShares 20+ Year Treasury Bond ETF — it holds 48 long-dated U.S. Treasury bonds maturing roughly 2053–2056, tracking the ICE US Treasury 20+ Year Index. Fund facts, all sourced from the fund quote page:
- 💰 AUM: $41.64B
- 🏷️ Expense ratio: 0.15%
- 📅 Inception: July 22, 2002
- 💵 Distribution yield: 4.75% (paid monthly, ≈$3.90 TTM)
- 📊 52-week range: $81.89 – $92.19
The mechanic that matters more than anything else here: these are U.S. Treasury bonds, so there's essentially zero credit risk — the entire risk in TLT is interest-rate/duration risk. A bond's price and its yield move in opposite directions, and because TLT holds only 20+ year maturities, that inverse relationship is amplified. TLT rises when long-term yields FALL. TLT falls when long-term yields RISE. If you remember nothing else from this article, remember that inversion — a lot of readers instinctively think "bond ETF go up = good for bonds," and it's actually the reverse of the yield story.
🤓 The Trade, Plain English
Two legs, same moment, same strike, same expiration:
- 🔴 BUY 20,000 September 18 $82 puts at $1.05 (≈$2.10M paid)
- 🟢 SELL 20,000 September 18 $82 calls at $1.33 (≈$2.66M collected)
- Net: ≈$0.56M credit collected
Spot was $82.27 at the time — this trade is essentially at the money, right on top of the strike.
| Time | Buy/Sell | Call/Put | Expiration | Premium | Strike | Volume | OI | Size | Spot | Option Price | Option Symbol | Order Type | Strategy |
|---|---|---|---|---|---|---|---|---|---|---|---|---|---|
| 12:03:23 | BUY | PUT | 2026-09-18 | $2.10M | $82 | 20,000 | 114,053 | 20,000 | $82.27 | $1.05 | TLT20260918P82 | ✅ BTO — open confirmed 2026-08-12 (OI 114,053 → 141,224) | Synthetic Short (long $82 put / short $82 call) |
| 12:03:23 | SELL | CALL | 2026-09-18 | $2.66M | $82 | 23,000 | 8,474 | 20,000 | $82.27 | $1.33 | TLT20260918C82 | STO | Synthetic Short (long $82 put / short $82 call) |
🤝 BLOCK CROSS — the tape shows both legs printed on a negotiated multi-leg cross, not a lit sweep. That means one broker matched a known buyer and a known seller off the open order book. Read it as deliberate position management, not urgent aggression lifting offers.
The parity tell. The call fetched $1.33 and the put cost $1.05 — a $0.28 spread. Spot ($82.27) sat $0.27 above the $82 strike. Those two numbers almost exactly match. That's textbook put-call parity: the package was priced off the forward, not "paid up for" in either direction. It's the signature of a mechanically-priced package, which supports reading this as a directional or hedging package rather than someone chasing a stale quote.
✅ RESOLVED — Both Legs Opened, and the Strike Drew Far More Flow Than the Block
Updated 2026-08-12 pre-market. Resolving OPRA snapshot timestamped August 12 (reflects the August 11 close, after this print); baseline is the August 11 snapshot (reflects the August 10 close, before this print).
| Leg | Baseline (Aug-11) | Resolving (Aug-12) | Δ | Print size | What we published | Verdict |
|---|---|---|---|---|---|---|
| Sep-18 $82 put (bought) | 114,053 | 141,224 | +27,171 | 20,000 | "if OI rises by roughly 20,000, that confirms a fresh open; if flat or down, this was a close" | ✅ OPEN (BTO) — clears the threshold |
| Sep-18 $82 call (sold) | 8,474 | 57,409 | +48,935 | 20,000 | "jump from 8,474 toward ≈28,000+" | ✅ OPEN (STO) — 2.4× the block |
The put leg — the one we said readers should not treat as settled — resolved on the opening side. It was the honest unknown in this trade: 20,000 contracts against a 114,053-contract base is far too small a margin for the size test to say anything. We published the decision rule in advance and the number cleared it with room to spare, rising 27,171 where a fresh open needed roughly +20,000. The long put half of the synthetic short is real and new.
The call leg opened much harder than the block alone explains. We noted that short-call interest at this strike had been building for two weeks (2,388 → 8,474) and predicted ≈28,000+. It printed 57,409 — an increase of 48,935 against a 20,000-lot sale, meaning roughly 2.4 times the block's worth of new short calls were written at the $82 strike in a single session. This trade was not an isolated print; it was the visible part of a much larger short-call build.
What that adds to the read below. Both halves of the synthetic short are confirmed as new positions, so the "a desk is betting long-term yields break higher" framing stands at full strength. If anything the resolution makes it more forceful: the $82 line went from a quiet 8,474-contract call book to 57,409 contracts of short-call interest overnight, alongside 27,171 new long puts. That is a lot of conviction concentrated on one strike, and it is genuinely new money rather than repackaged exposure.
Nothing in the direction or thesis below needs revision; only the scale was understated.
🤓 What This Actually Means — Plain English
This is a synthetic short position, not a garden-variety options bet. Buying a put and selling a call at the exact same strike and expiration replicates being short the underlying, almost dollar for dollar:
- Delta ≈ −1.00 per contract — it moves almost exactly like short 100 shares of TLT, times 20,000 contracts ≈ short 2,000,000 TLT shares in exposure
- Vega ≈ 0 — the long put's volatility exposure and the short call's volatility exposure cancel out. This is not a bet that options get more or less expensive. It's not a volatility trade at all.
- Theta ≈ 0 — the two legs' time decay largely offsets. There's no "free money from decay" here and no decay working against the position either.
- P&L is close to linear in TLT's price — it goes up in value roughly dollar-for-dollar as TLT falls, and loses roughly dollar-for-dollar as TLT rises.
Strip away the options mechanics and the statement being made is simple: "TLT goes down between now and September 18." Since TLT falls when long-term Treasury yields rise, that's a direct bet that the 30-year yield — already at 5.24%, its highest since 2007 — climbs further.
Two things every reader needs to understand about the risk here, and they cut in opposite directions:
- The short call leg has theoretically unlimited risk. A short call has no cap on the underlying's upside — if TLT rallies hard (a flight-to-quality shock, a surprise dovish pivot, weak jobs data), the loss on the call side is uncapped, just like a naked short call would be in isolation. The long put partially offsets that below $82, but above $82 the position behaves like an outright short with real, uncapped downside risk to the trade if TLT rises.
- The honest counter-read: this could be delta-neutral, not directional at all. An at-the-money synthetic short priced right at parity is also exactly what you'd see from a conversion, reversal, or financing package that carries an invisible long-stock leg we can't see on the options tape. If there's a matching long-stock position attached to this (common in bank/dealer financing books), the net exposure could be close to flat, not short — a synthetic-short-plus-long-stock package collects the option-implied financing rate rather than betting on direction. We do not have the equity tape here, so we cannot rule this out. Treat the "this is a bet yields rise" read as the leading hypothesis, not a certainty.
📈 Technical Setup / Chart Check-Up
YTD Chart
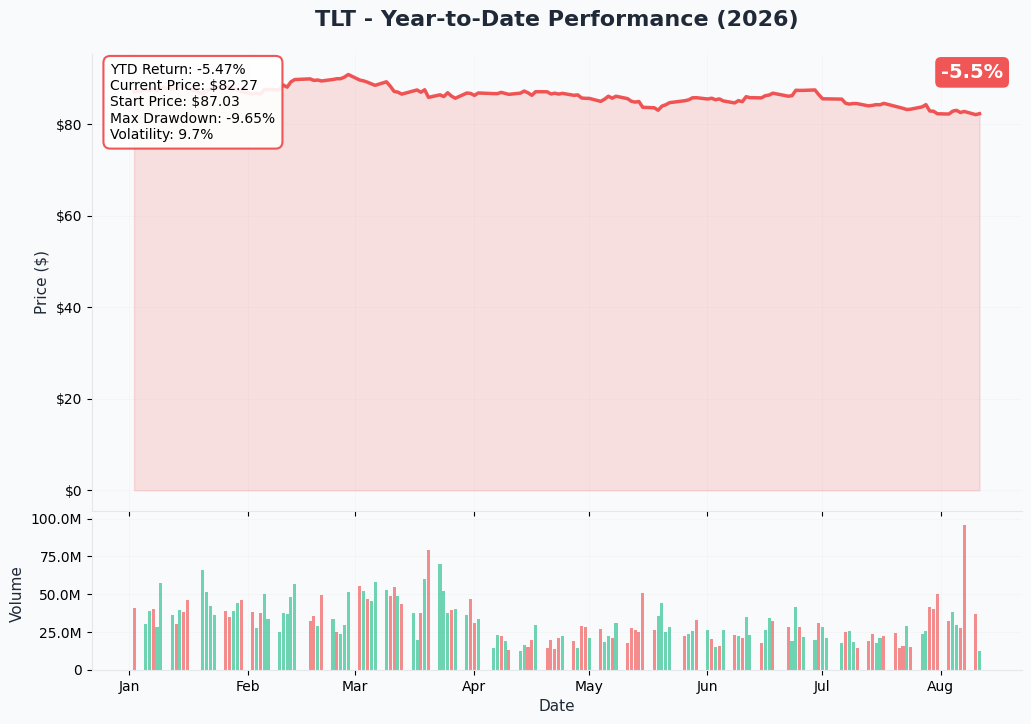
TLT sits at $82.27, just ≈0.5% above its 52-week low of $81.89, after a year that's seen it round-trip from a 52-week high of $92.19. The one-year total return (including distributions) is −1.44%. This entry point matters for reading the synthetic short: it's a breakout-continuation bet, not a fade — the position needs TLT to make new 52-week lows to pay off meaningfully, not just to hold where it is.
Gamma-Based Support & Resistance Analysis
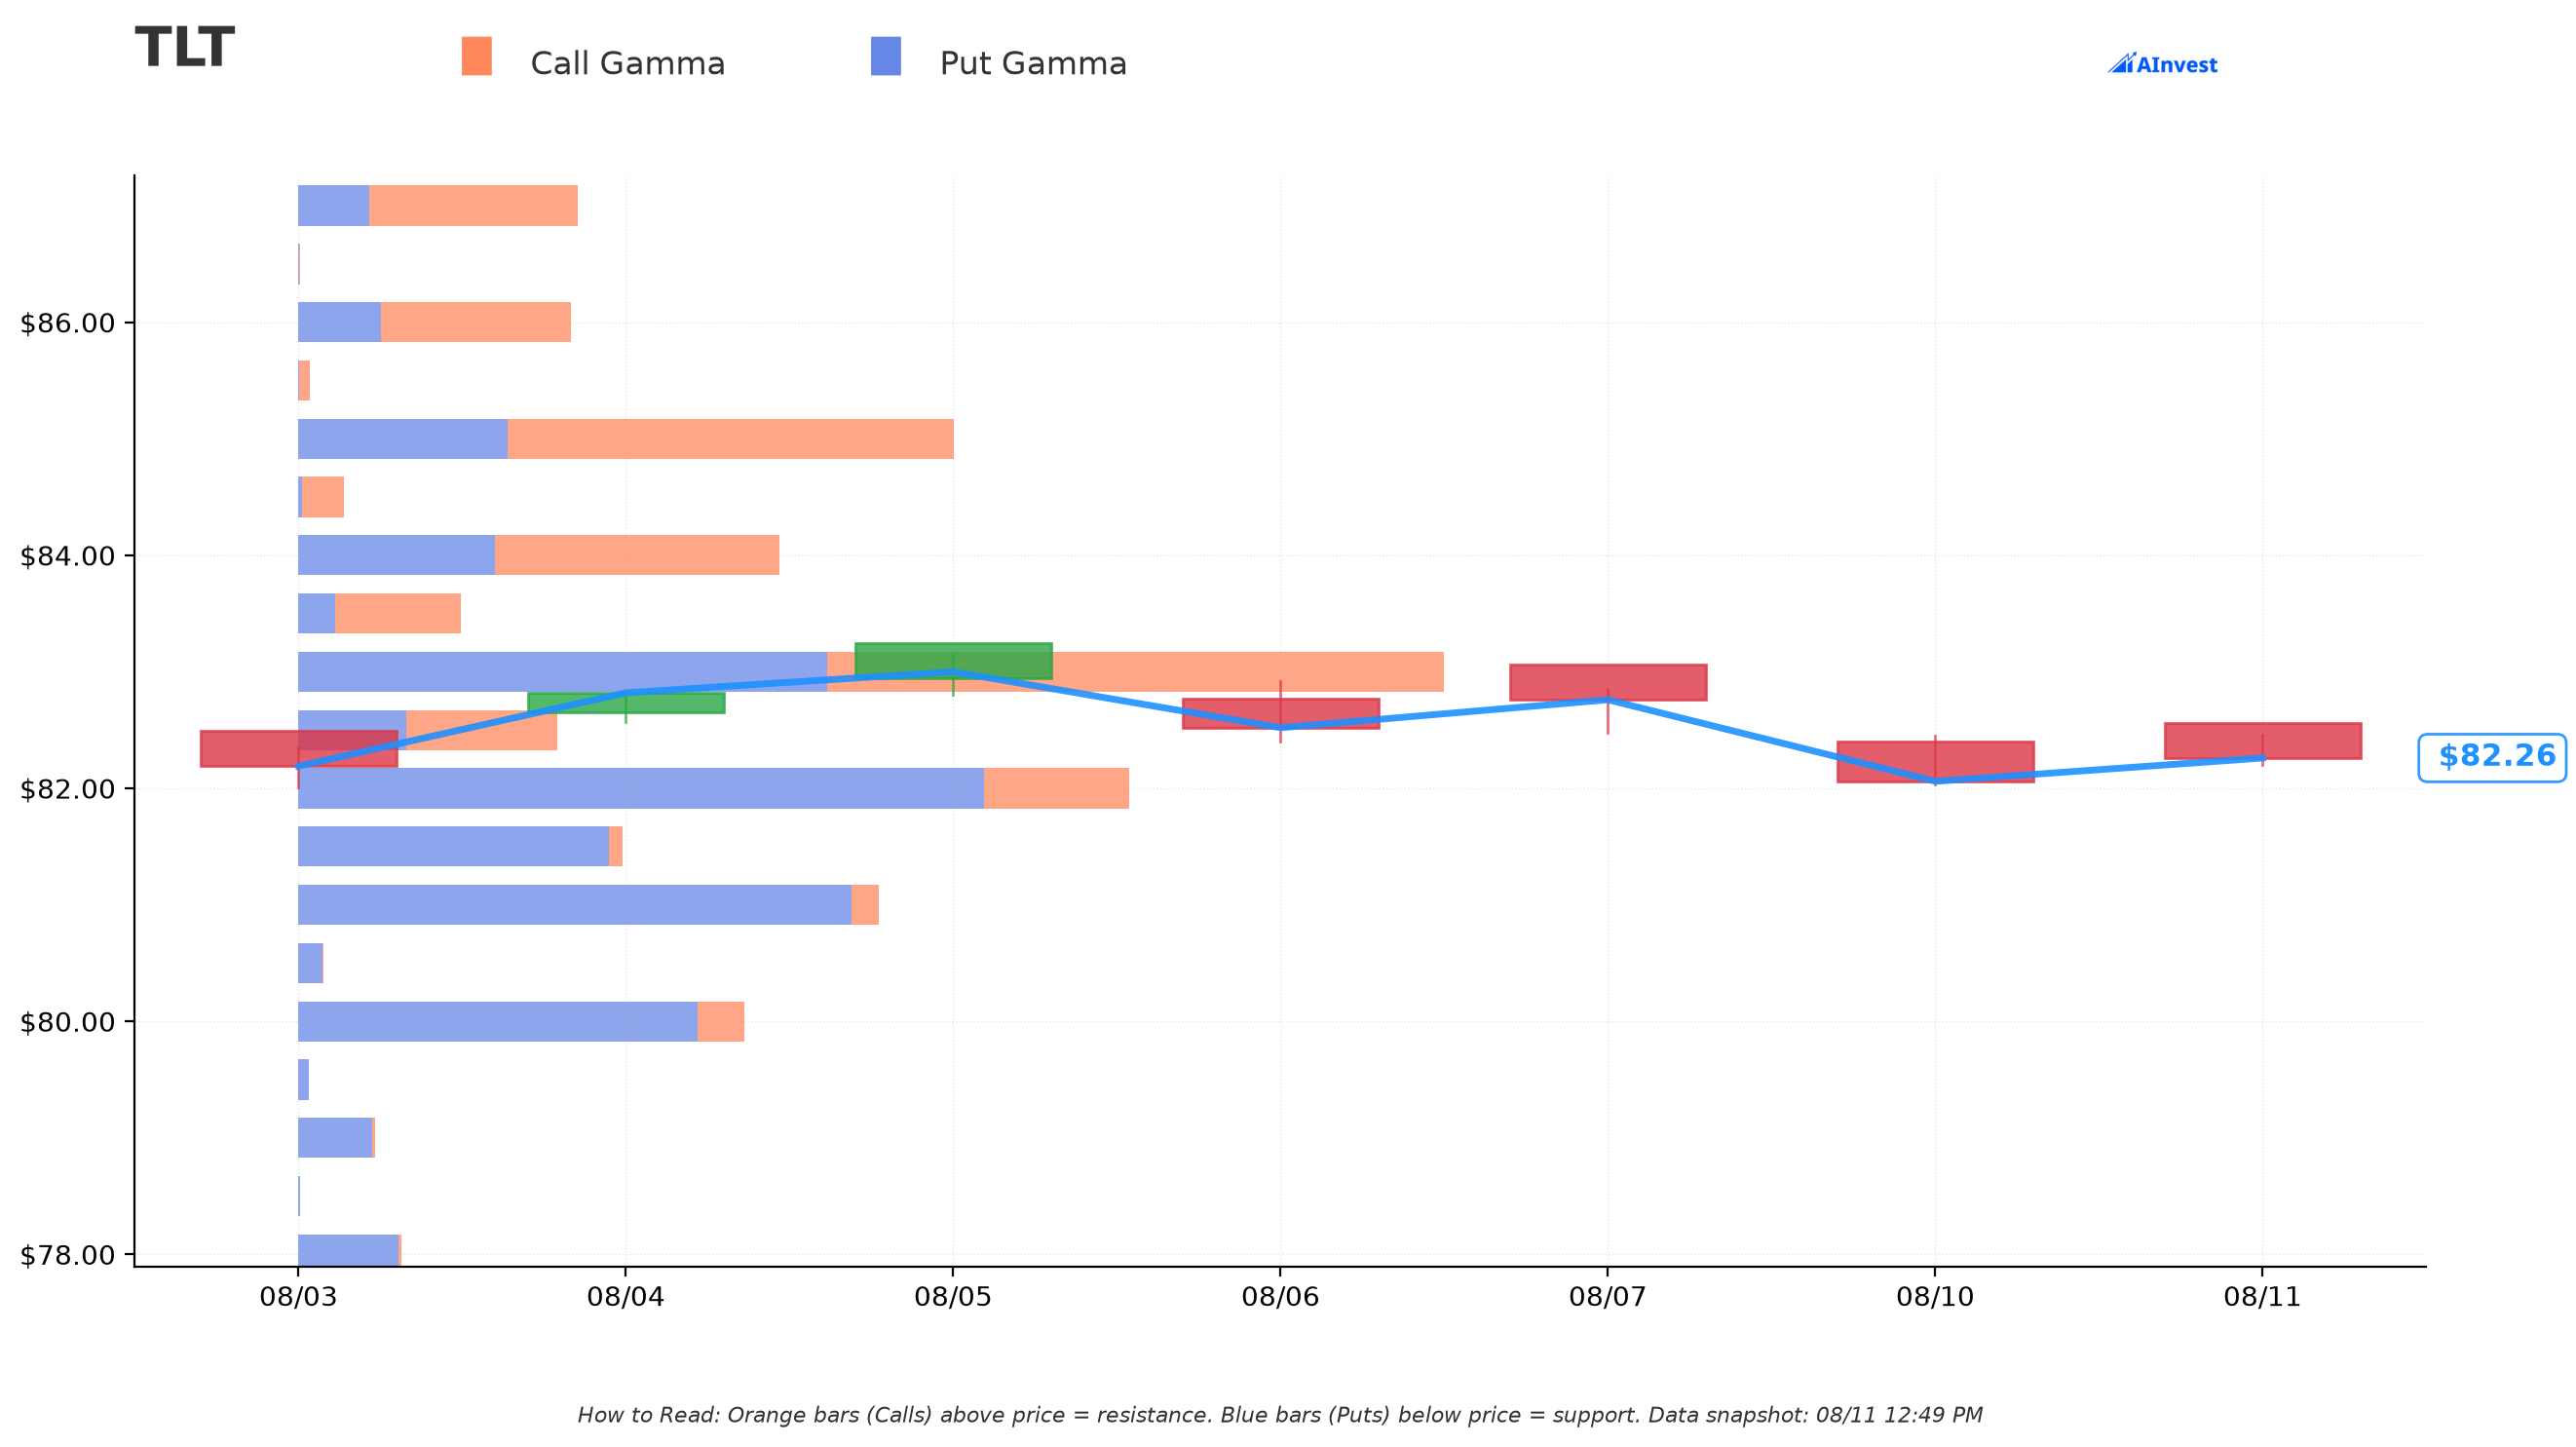
Reading directly from today's gex.json (spot $82.26):
- 🟠 Resistance wall at $83.00 — the single strongest level on the board, total gamma exposure ≈721.7, split call gamma ≈389.1 / put gamma ≈332.6, sitting just 0.90% above spot. This is the nearest lid on any bounce.
- 🔵 Support wall at $82.00 — total gamma ≈519.1, dominated by put gamma (≈428.0 vs. call gamma ≈91.1), just 0.32% below spot. This is essentially where the trade's own strike sits.
- 🔵 Secondary support at $81.00 (total gamma ≈362.4, almost entirely put gamma ≈345.8) and $80.00 (≈278.5, put gamma ≈249.6) — these line up closely with the 52-week low and would be the levels a real breakdown has to clear.
- 🟠 Secondary resistance at $85.00 (total gamma ≈411.7, call gamma ≈280.6) and $84.00 (≈302.9, call gamma ≈178.9) mark where a bounce would run into thicker call-side positioning.
In retail terms: the options market has built a thick wall of dealer hedging right around $82–$83 — exactly where this synthetic short is centered — which means price could chop in that zone before committing to a direction. A clean break below $81 or above $83 is where the gamma structure stops fighting the move.
Implied Move
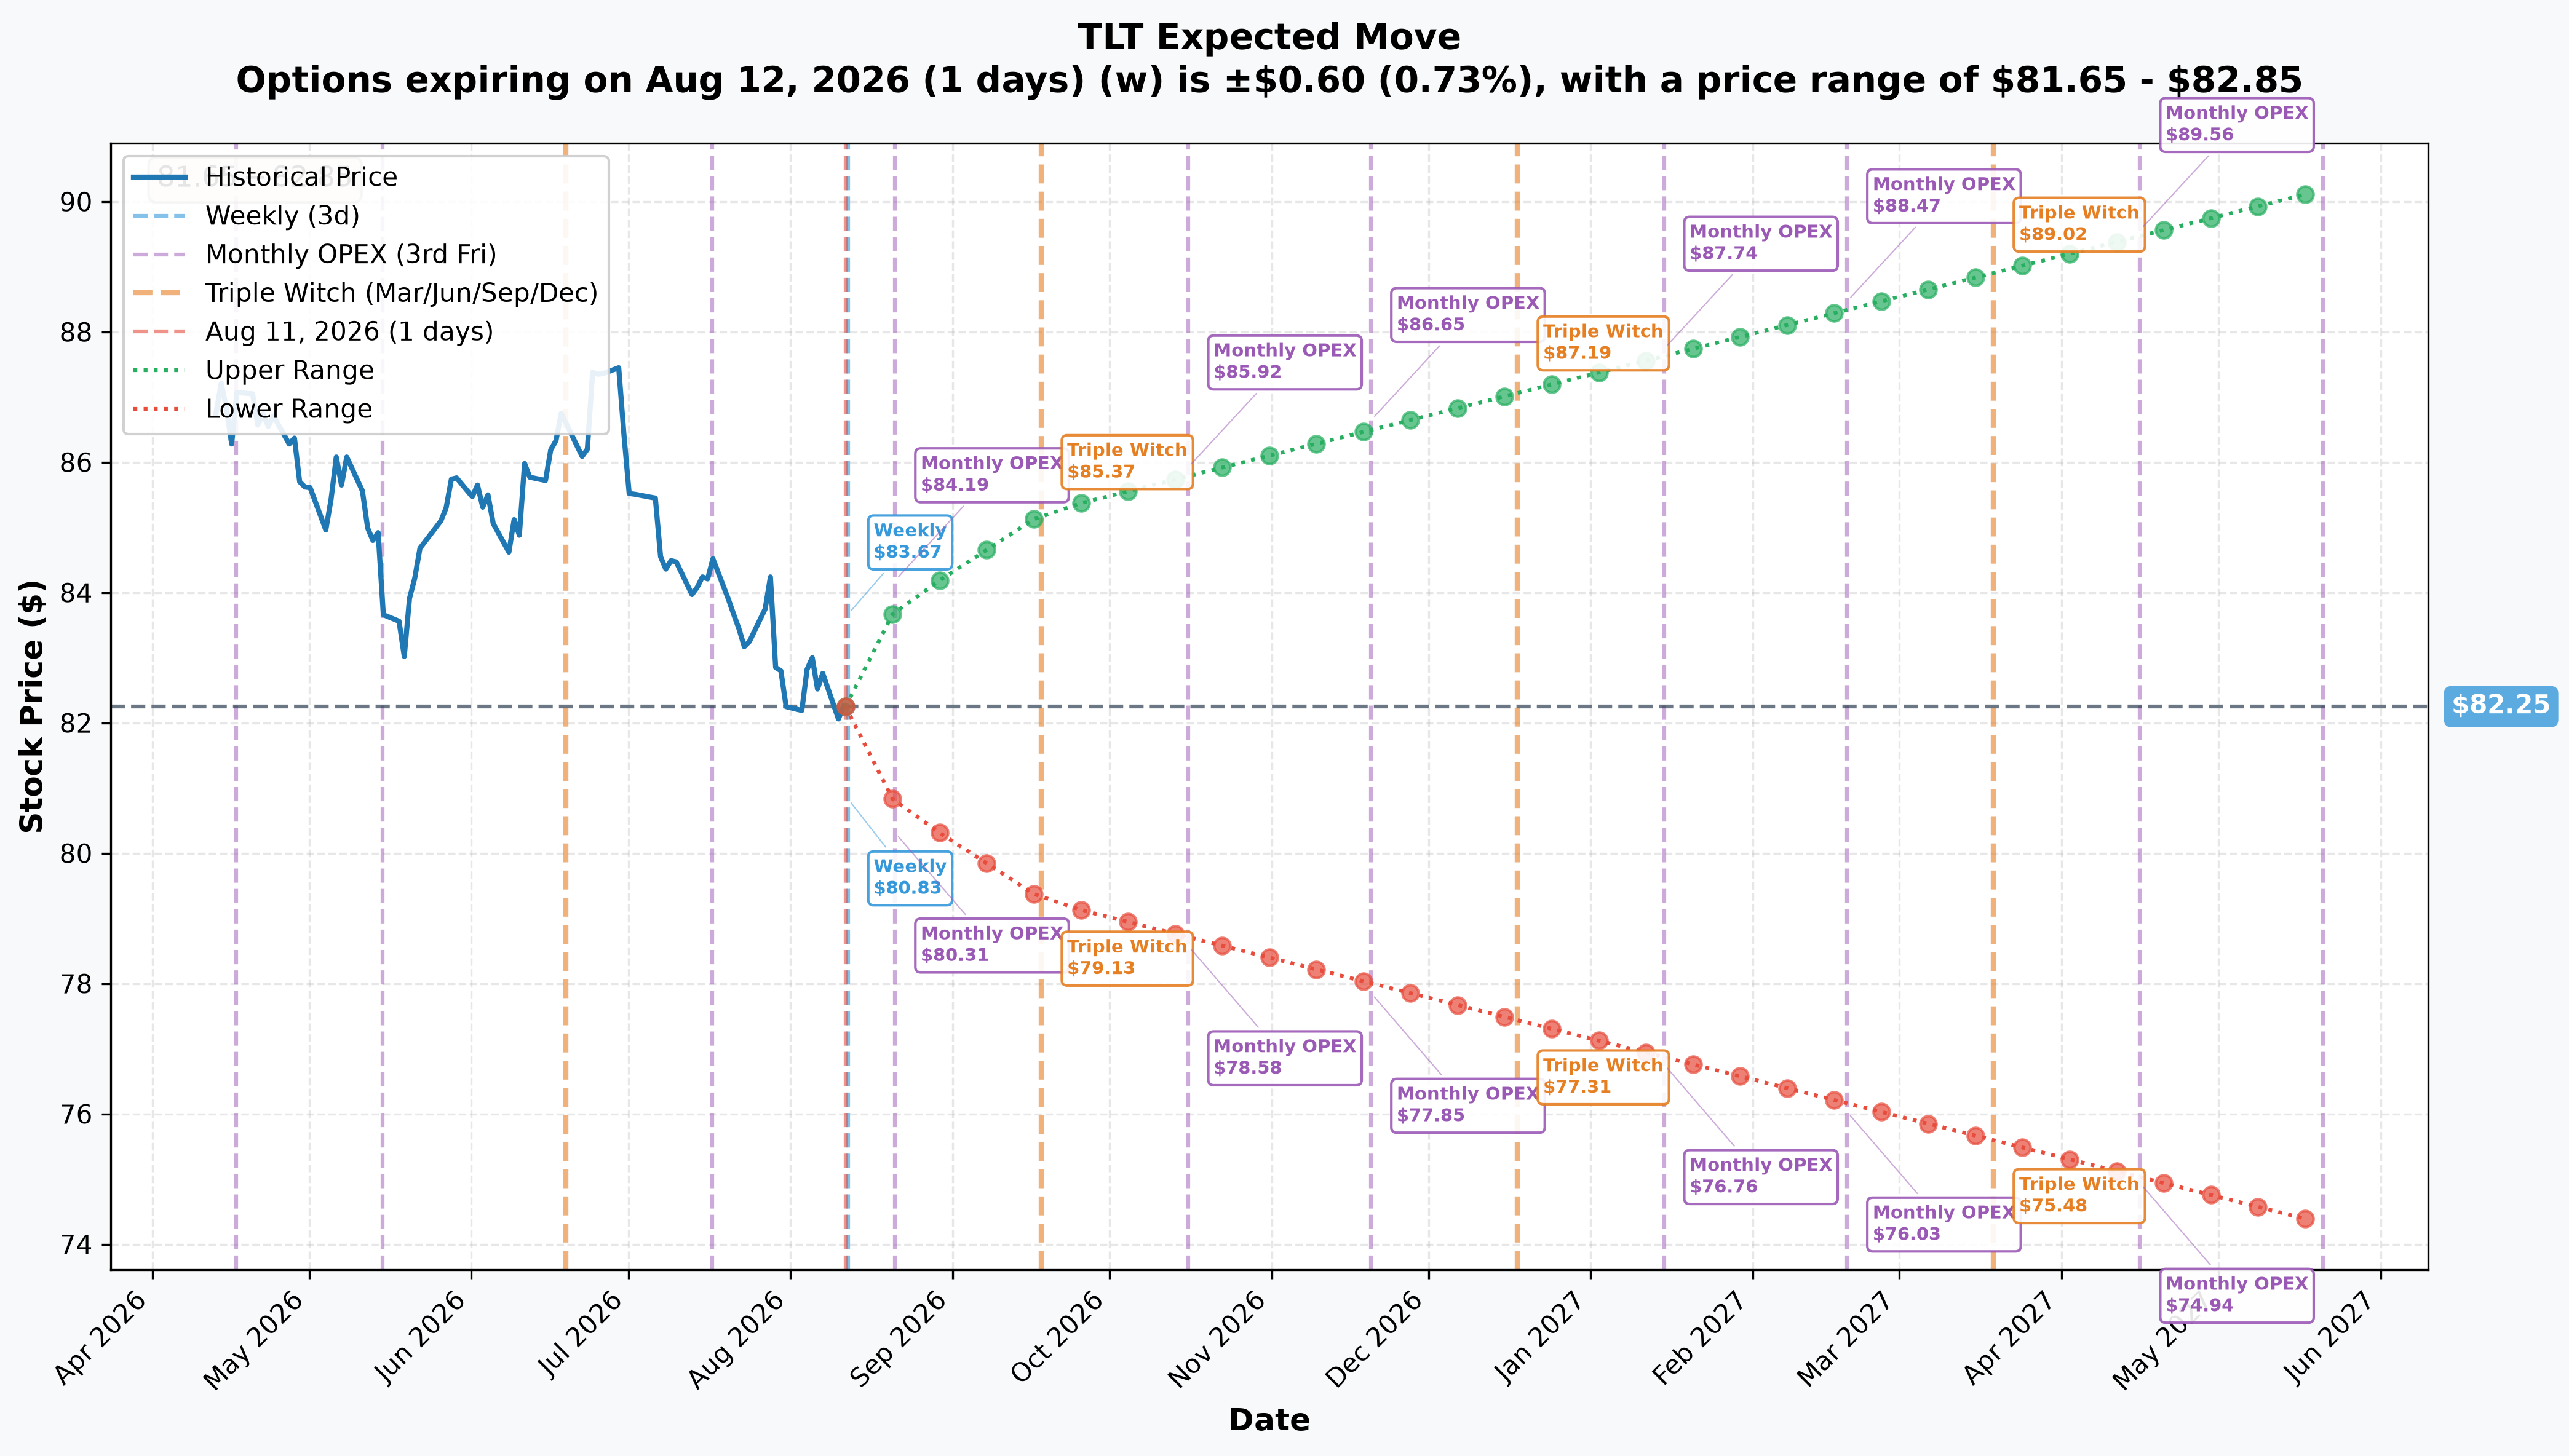
Straight from TLT_implied_move.json (spot $82.25):
- Weekly (Aug 12 expiry, 1 day out): implied move ≈0.73% / ≈$0.60 → range $81.65 – $82.85
- Monthly OPEX (Aug 21, 10 days out): implied move ≈1.85% / ≈$1.52 → range $80.73 – $83.77
- Quarterly / this trade's expiration (Sep 18, 38 days out): implied move ≈3.62% / ≈$2.98 → range $79.27 – $85.23
- Yearly LEAPS (May 2027, 283 days out): implied move ≈9.66% / ≈$7.94 → range $74.31 – $90.19
The market is pricing roughly a $79.27–$85.23 range for TLT by September 18. Note that the low end of that range ($79.27) sits below the 52-week low of $81.89, and the $82 strike this trade is built on sits almost dead center of the implied-move band — meaning options pricing itself doesn't strongly favor either the bull or bear case over the next 38 days.
🎪 Catalysts
Inside the September 18 Expiration Window (the trade's live period)
This is an unusually dense stretch for a Treasury ETF — 8+ confirmed macro events land before expiry:
- August 12, 2026 (tomorrow) — July CPI, per the published release schedule. First test of whether June's −0.4% m/m energy-driven cooling extends or reverses.
- August 13, 2026 — July PPI, per the economic calendar.
- August 19, 2026 — Minutes from the July 28–29 FOMC meeting, which will reveal how close the three-dissent hike vote came to prevailing.
- August 26, 2026 — July PCE / core PCE and the Q2 GDP second estimate, per the economic calendar — the Fed's preferred inflation gauge, tested against a 3.6% 2026 median PCE projection.
- September 4, 2026 — August payrolls, per the economic calendar, following July's −23,000 print with 103,000 of downward revisions.
- September 11, 2026 — August CPI, per the release schedule — the last inflation print before the meeting.
- September 15–16, 2026 — The dominant catalyst. FOMC decision plus an updated Summary of Economic Projections and dot plot, per the official FOMC calendar. This is genuinely live for a hike: three members (Hammack, Kashkari, and Logan) formally dissented for a 25bp increase at the July meeting, and the June 2026 median dot already sits at 3.8% — above the current 3.50%–3.75% range.
- September 18, 2026 — ⏱️ Option expiration, just two calendar days after the FOMC decision. The structure captures the September meeting and its fresh dot plot with almost no time decay left over.
Already Happened (feeding the current setup)
- June 17, 2026 — FOMC held rates at 3.50%–3.75% unanimously, 12–0, per the June statement.
- June 2026 SEP — the Fed's own 2026 median dot flipped from a March projection of 3.4% (implying cuts) to 3.8% (above the current range), and the 2026 PCE inflation forecast jumped from 2.7% to 3.6%, per the SEP materials.
- June CPI (released July 14, 2026) — cooled to 3.5% from 4.2%, core CPI to 2.6% from 2.9%, the largest monthly headline drop since April 2020.
- July 29, 2026 — FOMC held again at 3.50%–3.75%, but three members dissented in favor of a hike — the fifth consecutive hold, per the July statement.
- August 7, 2026 — July payrolls printed −23,000 versus +80,000 expected, with May and June revised down a combined 103,000 and wage growth of just +0.1% m/m, per the payrolls page.
- Fiscal backdrop — Treasury borrowed $1.8 trillion in the first ten months of FY2026, including $431 billion in July alone, per the budget watchdog analysis, with June flipping from a $27B surplus a year ago to a $120.3B deficit, per the budget balance page — heavy long-end supply that pressures TLT independent of the Fed.
🎲 Price Targets & Probabilities
Using the gamma structure and implied-move ranges together:
- 🚀 Bull case for the synthetic short (TLT falls, yields rise): a break below the $81.00–$82.00 gamma support zone opens a path toward $79.27, the low end of the September implied-move range — below the current 52-week low. This needs the September 15–16 FOMC to lean hawkish (a hike, or hawkish dots) and/or the August 12/September 11 CPI prints to run hot.
- ⚖️ Base case: TLT chops inside the thick $82–$83 gamma wall, roughly tracking the $80.73–$83.77 monthly-OPEX implied-move band, waiting on the data. This is the coin-flip outcome the catalyst calendar itself points to — the labor data argues one way, the Fed's own dots argue the other.
- 😰 Bear case for the synthetic short (TLT rallies, yields fall): a weak August payrolls report (September 4) or continued soft CPI pulls TLT back up through $83.00–$85.00 resistance, toward the implied-move upper bound of $85.23 — this is where the short call's uncapped risk actually bites.
💡 Trading Ideas
🛡️ Conservative
Don't replicate the structure. If you want rate exposure with defined risk, consider a single long $80 or $79 put for September 18 instead of the full synthetic — you pay more premium up front, but your max loss is capped at what you pay, with no uncapped short-call risk. Size small; this is a directional rates bet, not an income trade.
⚖️ Balanced
A debit put spread, e.g. long the $82 put / short the $78 put for September 18, captures the same "yields rise" thesis with a defined maximum loss and maximum gain, at a fraction of the capital and none of the unlimited downside that the short $82 call carries in the trade profiled here.
🚀 Aggressive
Mirroring the tape's own structure — long put / short call at the same strike — is the highest-conviction, highest-risk way to express this view, and it's exactly what this desk did for a ≈$0.56M net credit. Understand before doing this: you are taking on the same risk as shorting TLT outright, including a short call leg with theoretically unbounded loss if TLT rallies hard. This is not a strategy for anyone who isn't prepared to manage a losing short position actively.
👥 How Different Readers Should Think About This
🎰 YOLO Trader
You're looking at the same structure the desk used: long put / short call at $82 for September 18. Know exactly what you're signing up for — it's a leveraged short with uncapped loss on the call side if TLT rips. If you do it, size it like you're short 2,000,000 shares' worth of exposure per 20,000-lot, not like a normal options bet, and have a hard exit level above $83 (the nearest gamma resistance) where you cut it rather than let the short call run against you.
📈 Swing Trader
The cleaner way to play this thesis over the next few weeks is a single long $80 or $79 put into the September 15–16 FOMC — defined risk, no short-call tail, and it lines up with the $79.27 lower bound of the implied-move range. Use the $82–$83 gamma wall as your read on whether the market is stalling before committing to a breakdown.
💰 Premium Collector
Selling premium into this specific setup is dangerous right now — TLT sits near a 52-week low heading into the most catalyst-dense 38 days on the calendar, capped by an SEP-bearing FOMC two days before expiry. If you want to collect premium here, do it with a defined-risk credit spread (e.g., short the $82 call / long the $85 call) rather than a naked short call, so the FOMC surprise can't produce an unbounded loss.
🌱 Beginner
The single most important thing to understand from this whole trade: TLT goes UP when interest rates go DOWN, and DOWN when interest rates go UP — it's backwards from how a lot of people first assume a bond fund works. This specific trade is a bet that long-term rates keep rising. Before trading anything like it, understand that the "sell a call" half of a synthetic short can lose more than the premium collected — options selling isn't free money, and this structure specifically carries unlimited theoretical risk on that leg.
⚠️ Risk Factors
- The short call leg has unlimited loss potential. If TLT rallies — a flight-to-quality shock, weak jobs data, a dovish surprise — the loss on the short call is uncapped. This is the single most important risk fact in this entire article.
- Negative carry. TLT distributes 4.75% annualized, paid monthly (≈0.40%/month) — a synthetic short is economically on the hook for that distribution, a real drag over the 38-day window.
- Entry is already near the 52-week low. At $82.27 against $81.89, much of the bearish repricing (the 30-year's +35.6bp move over the past year) may already be in the price — shorting into an extended move offers worse risk/reward if a catalyst disappoints.
- Labor data cuts the other way. July payrolls were negative with large downward revisions; a second weak print on September 4 (inside this trade's window) would flip the Fed narrative fast.
- The hidden-leg problem. We cannot see the equity tape for this print. An at-the-money synthetic short priced exactly at parity is equally consistent with a conversion/reversal/financing package carrying an invisible long-stock hedge, which would make the real exposure close to flat rather than short. Do not assume this is a pure directional bet with certainty.
- Event risk is concentrated on one day with zero cushion. The FOMC lands September 15–16, expiration is September 18, and because the structure has ≈zero theta and ≈zero vega, there's no time-decay or volatility buffer — only raw direction — heading into that decision.
🎯 The Bottom Line
Real talk: someone crossed a $2.66M call sale against a $2.10M put purchase at the same $82 strike and same September 18 expiration, for a net $0.56M credit — a synthetic short that's a clean bet the 30-year Treasury yield, already at a 2007-era high of 5.24%, keeps climbing. The call side is a proven fresh open (OI 8,474 → expect ≈28,000+ tomorrow) and has been building for two weeks; the put side is unprovable from today's tape (size 20,000 against 114,053 existing contracts) — check back ≈06:30 ET tomorrow for the OI print that resolves it.
The setup lines up with a genuinely hawkish few months from the Fed — three hike dissents in July, a median 2026 dot above the current range, relentless Treasury supply — but it's fighting negative carry, an entry near the 52-week low, and a labor market that's now printing negative payrolls. Mark your calendar for September 15–16: that FOMC decision, two days before this position expires, is almost certainly what decides whether this trade wins or loses. And never lose sight of the short call: this position carries the same uncapped risk as an outright short position in TLT.
This analysis is for informational purposes only and is not financial advice. Options trading involves substantial risk, including the potential for unlimited losses on short option positions, and may not be suitable for all investors. Always do your own research and consider consulting a financial advisor before trading.
Last updated: 2026-08-12 (pre-market) — the next-day OPRA open-interest snapshot confirmed both legs. Sep-18 $82P 114,053 → 141,224 (+27,171 against a 20,000-lot buy): OPEN (BTO), clearing the published +20,000 threshold and resolving the trade's one genuine unknown. Sep-18 $82C 8,474 → 57,409 (+48,935): OPEN (STO), roughly 2.4× the block and well above the published ≈28,000+. The synthetic-short thesis is unchanged and strengthened; only the scale was understated. The put leg's order-type cell was updated; the ⏳ callout was replaced with the ✅ RESOLVED box.