📉 TLT: $6.59M of 2028 Calls on Long Bonds — And at Today's Yields Both Expire Worthless
📅 2026-08-13 | 🤝 Floor Block Detected
🎯 The Quick Take
At 12:15:22 ET a desk bought 10,000 January-2028 $83 calls and 10,000 January-2028 $87 calls in TLT — ≈$6.59 million for long-dated upside in 20-year-plus Treasuries.
This is a bet that long-term interest rates fall. TLT rises when long yields fall, and right now the 30-year sits at 5.21% — its highest since 2007.
Here is the subtlety that decides the trade, and most coverage would miss it. Because TLT's 4.72% distribution yield exceeds the ≈3.625% funds rate, the January-2028 forward price sits roughly 1.6% BELOW today's spot. At unchanged yields, both of these calls expire worthless. The position does not need rates to stop rising — it needs an actual rally in long bonds.
🏛️ Fund Overview
TLT holds US Treasury bonds with 20 or more years to maturity. It is the most direct listed instrument for a view on long-end rates.
| Attribute | Value |
|---|---|
| Price | $82.59 (at the print) |
| AUM | ≈$41.4–41.6B |
| Expense ratio | 0.15% |
| Distribution yield | 4.72% |
| Effective duration | ≈15.5 years (derived — see note) |
| Year to date | −5.24% |
| Position vs 52-week low | within ≈0.9% |
The inverse relationship, plainly: bond prices move opposite to yields. If long yields fall 1%, TLT rises roughly 15–16% — about 17% once convexity is included.
On duration: the issuer and the major data pages were unreachable this session, so we derived it two independent ways that agreed — analytically from the holdings (14.3 for high-coupon bonds, 18.2 for the low-coupon 2020-vintage issues) and empirically (a −5.79% price return against a +0.34pp yield rise implies ≈17% per 100bp). ≈15.5 years is our working figure, not a published one.
💰 The Trade, in Plain English
| Time | Buy/Sell | Call/Put | Expiration | Premium | Strike | Volume | OI | Size | Spot | Option Price | Option Symbol |
|---|---|---|---|---|---|---|---|---|---|---|---|
| 12:15:22 ET | BUY | CALL | 2028-01-21 | ≈$4,040,000 | $83 | 10,000 | 8,136 | 10,000 | $82.59 | $4.04 | TLT20280121C83 |
| 12:15:22 ET | BUY | CALL | 2028-01-21 | ≈$2,550,000 | $87 | 12,000 | 44,220 | 10,000 | $82.59 | $2.55 | TLT20280121C87 |
≈$6.59M total. Both strikes are 100% time value — the $83 is essentially at the money and the $87 is ≈5.3% out of it. Printed as a negotiated floor block; the BUY labels are reported rather than tape-proven, since the package took no liquidity.
✅ Resolved on 2026-08-14: the $87 leg opened. When published, this leg carried a genuine open-versus-close flag — its 10,000 contracts landed against 44,220 already outstanding, and size below open interest cannot prove direction on its own. The next-day snapshot took the line to 50,781, which rules out the closing branch. The qualification worth carrying forward: open interest rose +6,561 against a 10,000-lot print, so about a third of the leg was a transfer from closing holders rather than new exposure. The $83 leg, at 10,000 against 8,136, was unambiguously opening and confirmed at +10,009.
One tape detail worth noting: the $87 leg printed well above the displayed offer. On a negotiated package that usually means the quoted market was stale or wide rather than that someone chased — but it is unusual enough to flag.
What it takes to work:
| Outcome | TLT level | 30-year yield | Move required |
|---|---|---|---|
| Breakeven | $88.30 | ≈4.70% | ≈45–55bp fall |
| Roughly triples | ≈$95 | ≈4.25% | ≈100bp fall |
| At unchanged yields | ≈$81.3 forward | 5.21% | both expire worthless |
For scale: consensus currently forecasts 5.00% in twelve months — about half of what breakeven requires.
✅ RESOLVED — Both Legs Opened, but a Third of the $87 Leg Was a Transfer
Updated 2026-08-14 pre-market. Resolving OPRA snapshot timestamped August 14 (reflects the August 13 close, after this print); baseline is the August 13 snapshot (reflects the August 12 close, before this print).
| Leg | Baseline (Aug-13) | Resolving (Aug-14) | Δ | Print size | Capture | Verdict |
|---|---|---|---|---|---|---|
| Jan-2028 $83 call | 8,136 | 18,145 | +10,009 | 10,000 | 100% | ✅ OPEN (BTO) |
| Jan-2028 $87 call | 44,220 | 50,781 | +6,561 | 10,000 | 66% | ✅ OPEN (BTO) — partial |
The $83 leg landed exactly on prediction — 8,136 to 18,145, contract for contract.
The $87 leg opened too, and that settles yesterday's flag — but read the shortfall. We said open interest climbing toward ≈54,220 would prove the open. It rose, which rules out the covering branch, but it stopped at 50,781 — some 3,439 contracts short of target. Open interest rose by only 66% of the printed size, which means roughly a third of that leg matched against holders who were closing. Part of the block was a transfer of existing exposure, not new accumulation.
So the week-long build read was right in direction and a little generous in size. The strike's run — 38,262 → 44,220 → 50,781 — did continue, and this print was the largest single instalment in it. But the position added on the $87 line was ≈6,561 contracts, not 10,000, and the honest package total is ≈16,570 new contracts across both strikes rather than 20,000.
Unchanged: the negotiated-floor-block mechanism, the reported-not-proven direction, and the core observation that at today's yields both strikes expire worthless.
🤓 What This Actually Means — Plain English
The bet in one sentence: long-term interest rates fall meaningfully over the next year and a half.
Why the forward price matters more than the spot price. A long-dated call is priced off where the market expects the fund to trade at expiry, not where it trades today. TLT pays out 4.72% a year in distributions, and every distribution mechanically lowers the fund's price. Because that yield is higher than the ≈3.625% cost of money, the January-2028 forward sits about 1.6% below today's $82.59.
The practical consequence is stark: if long yields are exactly where they are today in January 2028, both calls are worthless. The buyer is not being paid to wait — they are paying to wait, and the clock runs against them. That is the opposite of how most people assume a long-dated option behaves.
What they get for it: implied volatility of roughly 10–11%, which is genuinely cheap for a 1.44-year option on an instrument this rate-sensitive. If the macro picture turns, a 15.5-year duration fund converts a modest yield move into a large price move. That asymmetry — cheap vol, high duration — is the trade's best feature, and the honest reason someone would do it despite the forward drag.
📈 Technical Setup
One-Year Performance
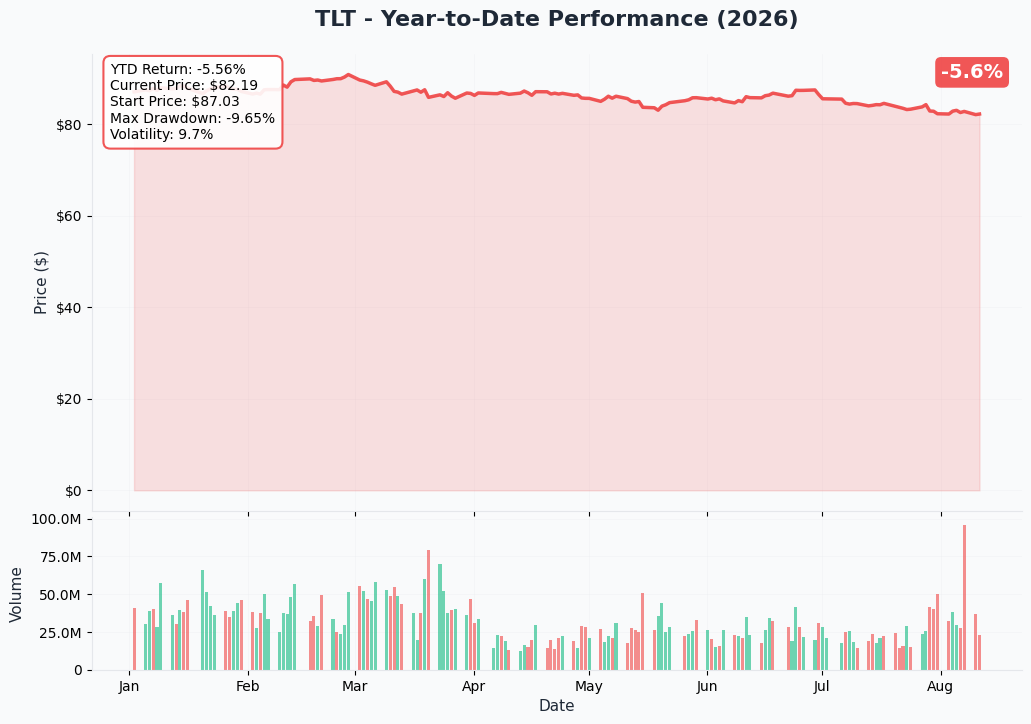
TLT is −5.24% year to date and sits within roughly 0.9% of its 52-week low — this is a bet placed near the lows, not a chase.
🔵🟠 Gamma-Based Support & Resistance
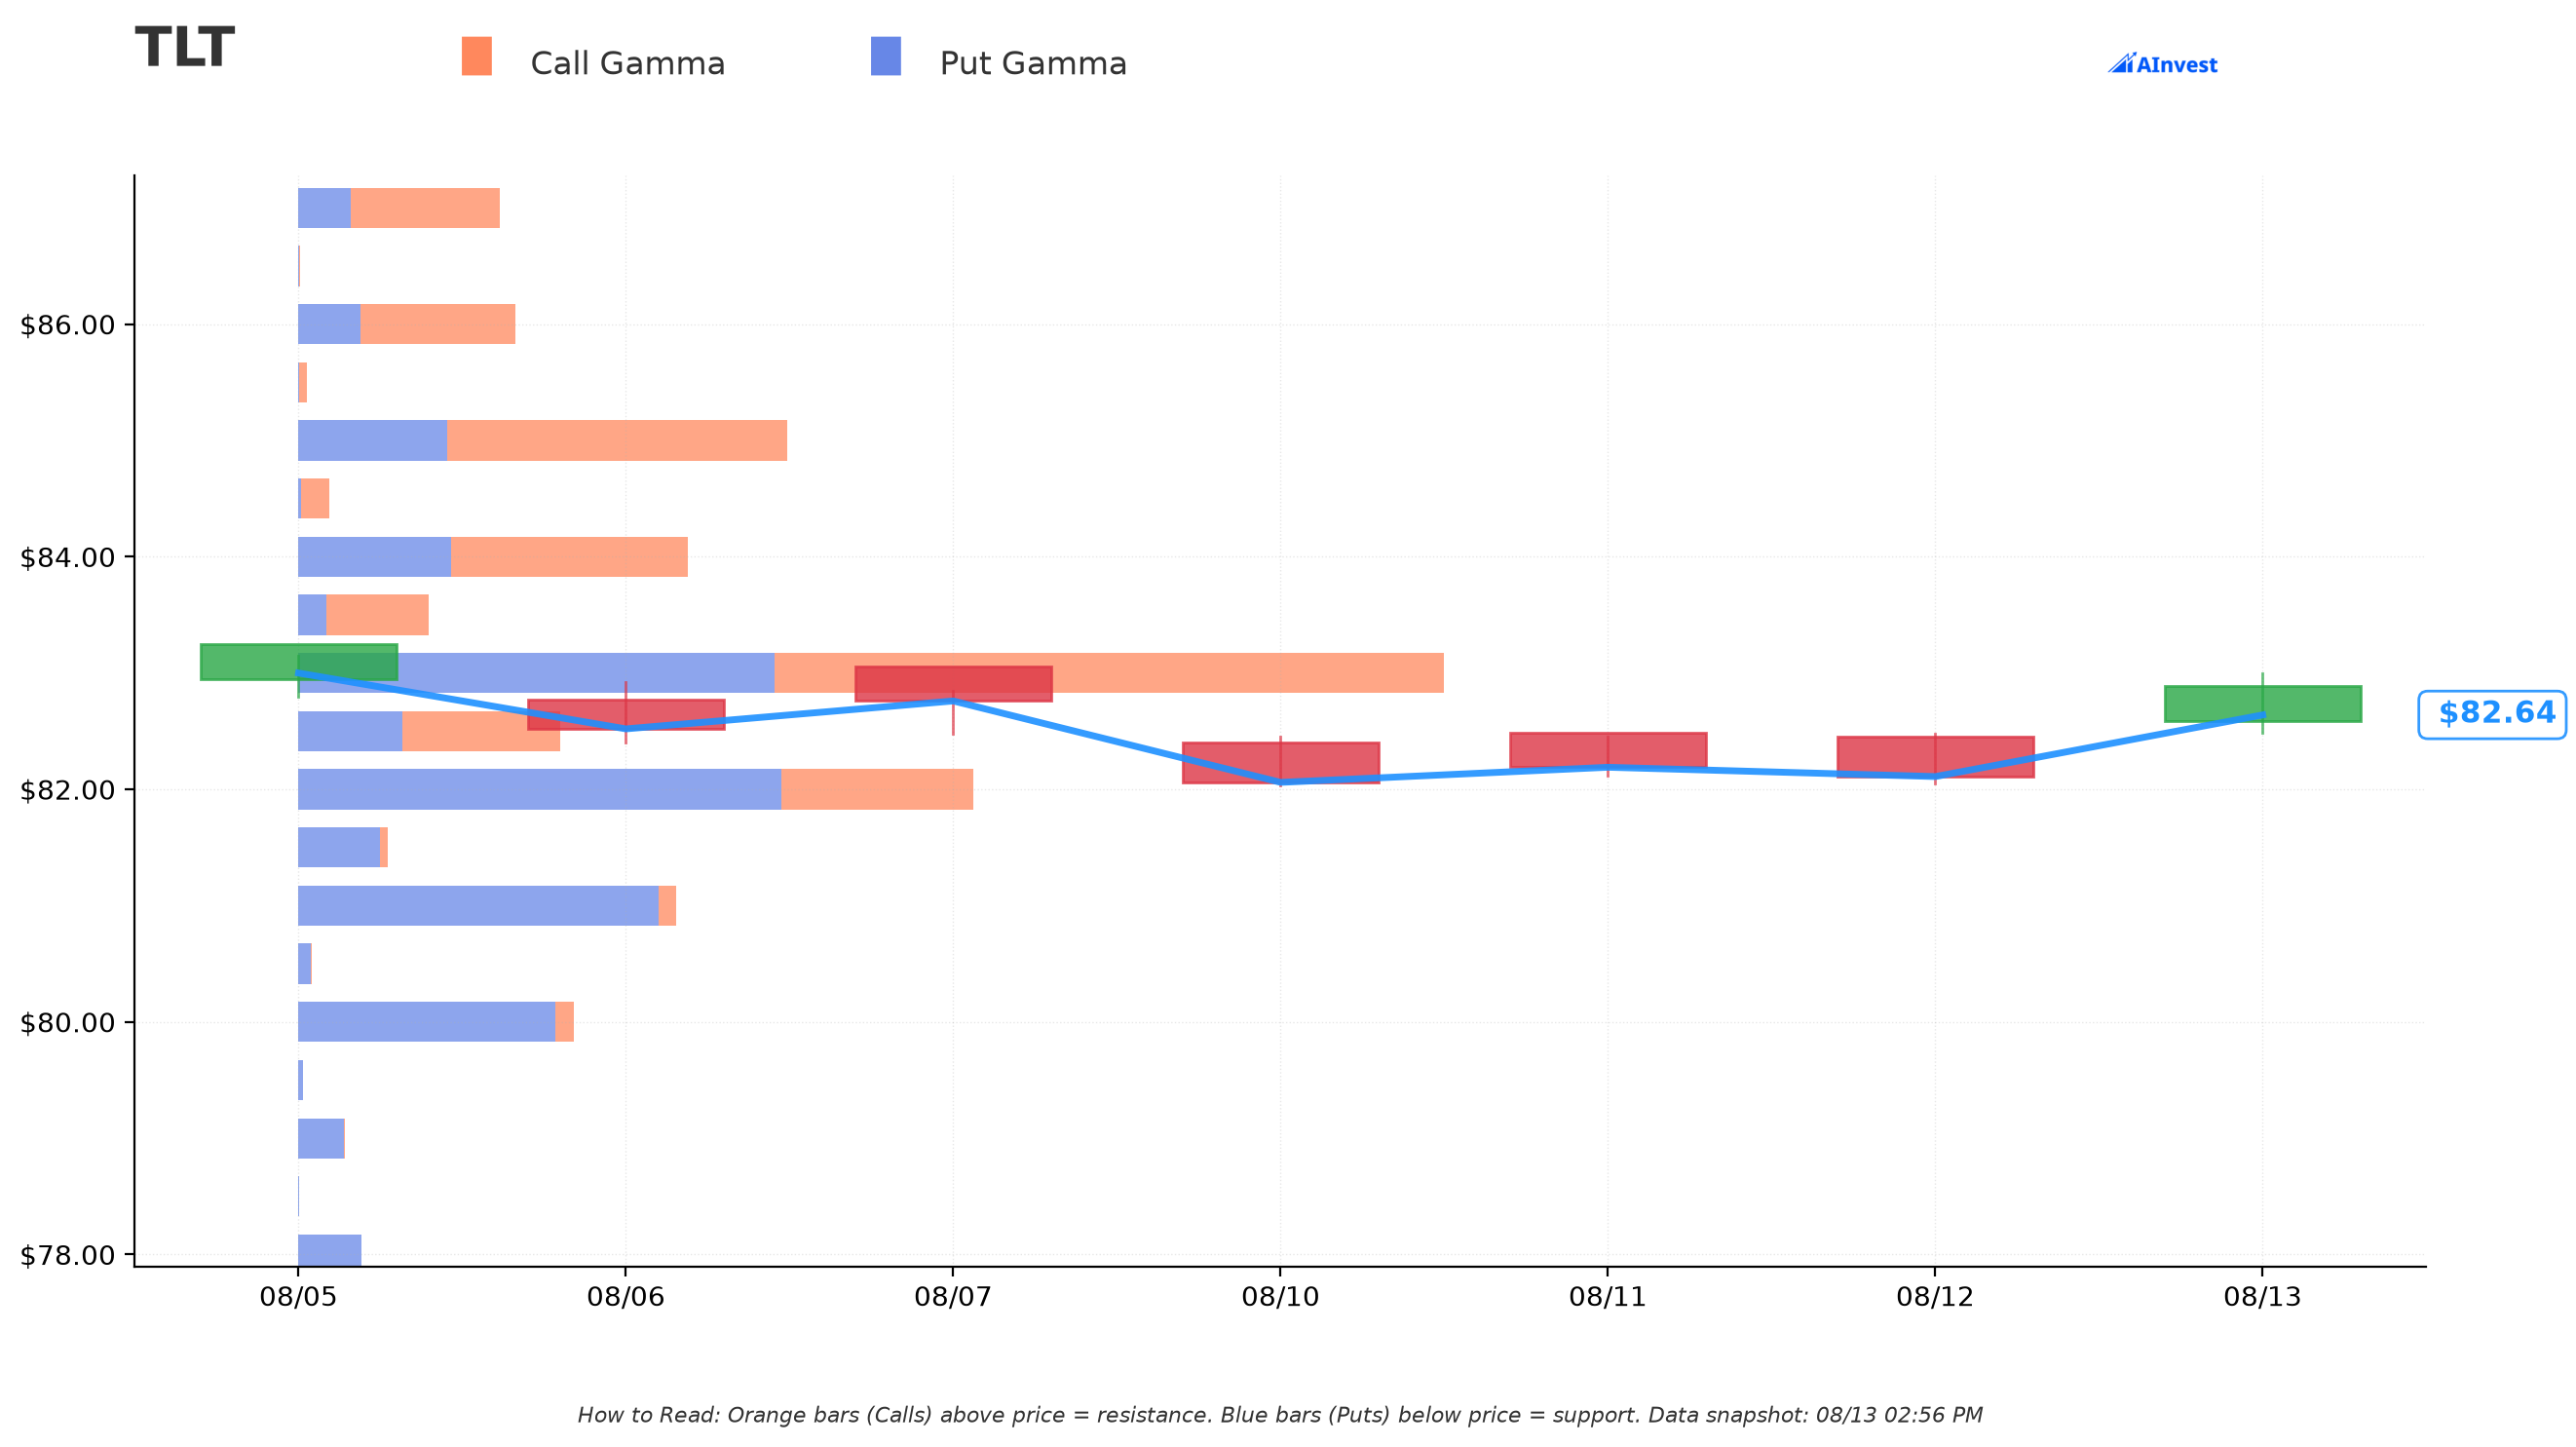
| Level | Strike | Strength |
|---|---|---|
| Resistance | $83 | Very Strong |
| Spot | $82.61 | — |
| Support | $82 | Very Strong |
Note the coincidence: the $83 strike being bought sits exactly on the strongest gamma resistance level.
🎯 Implied Move
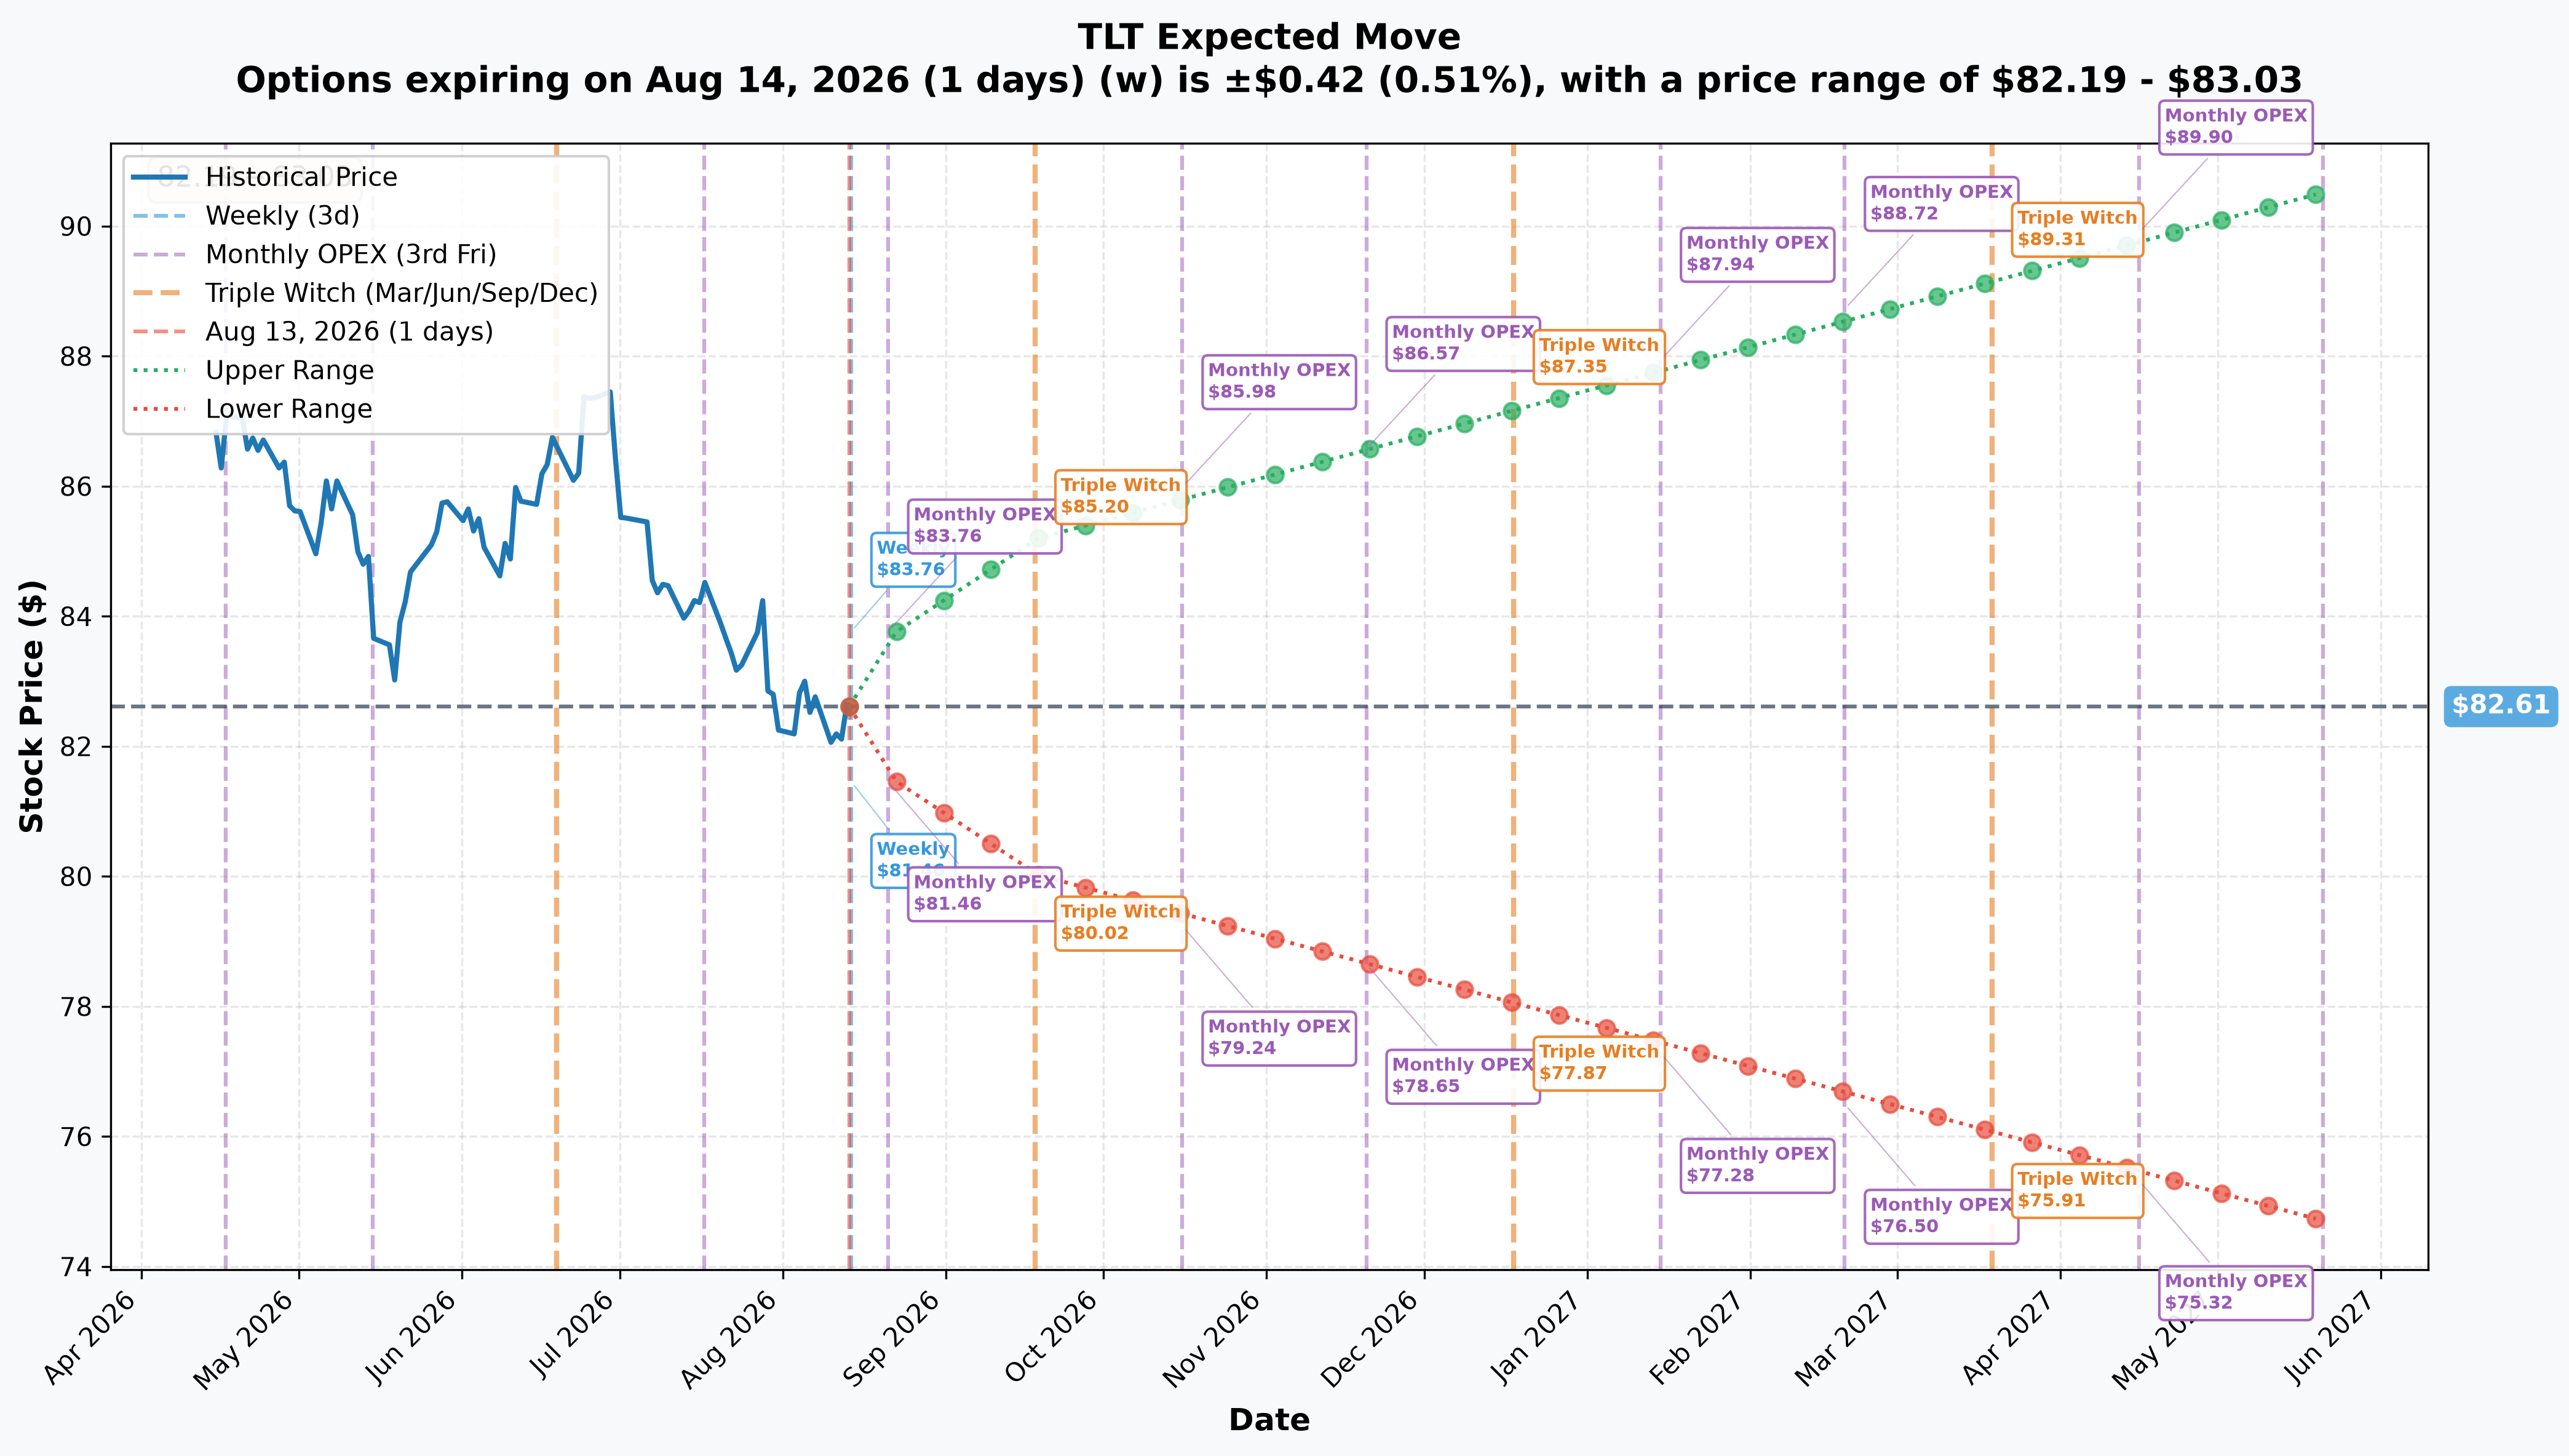
| Horizon | Implied move |
|---|---|
| Aug 14 | ±0.51% |
| Aug 21 | ±1.33% |
| Sep 18 | ±3.14% |
A ±3.14% five-week range against a position needing +7% just to break even shows how far out this thesis sits. This is a macro-regime bet, not a near-term trade.
🎪 Catalysts — 1.44 Years, 11 Fed Meetings
A correction on the window itself. The January 21, 2028 expiration is ≈1.44 years out (526 days), and 11 FOMC meetings fall inside it — three in 2026 and eight in 2027. The first 2028 meeting lands after expiry (Federal Reserve calendar).
The current regime is hostile to this trade, and it is worth being blunt about that. On July 29, 2026 the Fed held at 3.50–3.75% on a 9–3 vote, with Hammack, Kashkari and Logan all dissenting in favour of a 25bp hike (FOMC statement). The 2-year sits 52bp above the funds midpoint — the market is pricing tightening, not easing.
Current yields: 30-year 5.21% (highest since 2007), 10-year 4.64%, 2-year 4.15%.
The genuine bull hook, and it is a good one. July payrolls came in at −23,000 against +80,000 expected, with 103,000 of downward revisions, while CPI decelerated for a second month to 3.4% headline / 2.5% core. A shrinking payroll count is incompatible with dissents calling for hikes — one of those two signals has to break. If it is the labour market that wins the argument, long yields fall and this position works. That is the entire thesis in one sentence.
Keep the dates separate: the option expires January 21, 2028; the FOMC meetings, CPI prints and payrolls reports between now and then are the events that will decide it.
👥 Four Ways to Read This Trade
🎲 The YOLO trader
The $87 call at $2.55 is the higher-octane leg — ≈5.3% out of the money on a fund that moves ≈15–16% per 100bp of yield. But understand what you are fighting: the forward drag means you lose if nothing happens, and "nothing happens" is the single most likely outcome over any given stretch. Size it as money you can lose entirely.
📈 The swing trader
Eighteen months is not your horizon, but the setup is worth watching. TLT sits within 0.9% of its 52-week low with the 30-year at a 2007 high, and the gamma levels are tight — $83 resistance, $82 support. The tradeable question is whether the negative payrolls print or the hike dissents wins; each FOMC meeting and payrolls report is a decision point on that.
💰 The premium collector
You are the natural counterparty here, and the forward drag works for you: if long yields simply stay put, both these calls expire worthless and the seller keeps everything. But respect the duration. A 100bp rally in long bonds moves TLT ≈17%, which turns a quiet short-call position into a painful one quickly. Selling long-dated calls on a 15.5-year-duration instrument near multi-decade yield highs is picking up a small, steady income in front of a genuinely fat tail.
🌱 The beginner
Learn the counterintuitive bit: an option can lose money even if the underlying doesn't move. TLT pays out 4.72% a year, which drags its expected future price below today's price. So a call struck near the money is already fighting a headwind before rates do anything at all. When you look at any long-dated option on a high-yielding fund, ask where the forward price is — not just the spot.
⚠️ Honest Limits
- ✅ The $87 leg's open-versus-close status is now resolved — it opened. The August 14 snapshot took the line from 44,220 to 50,781. Note the qualification, though: open interest rose by 6,561 against a 10,000-lot print, so ≈34% of that leg matched against closing holders and was a transfer rather than new exposure.
- Direction is reported, not proven — a negotiated floor block takes no liquidity, so there is no aggressor read.
- The duration figure (≈15.5 years) is our own derivation, arrived at two independent ways, not a published number. The issuer and major data pages were unreachable this session.
- Two figures in our earlier working notes were wrong and are corrected here: the expiration is ≈1.44 years out (not ≈2.4), and 11 FOMC meetings fall inside it (not ≈20).
- Research gaps, disclosed: the search budget was exhausted, so all work was direct retrieval. Treasury, FRED and BLS pages were inaccessible, so the daily 30-year yield path since May 13 is missing; post-September CPI and payrolls dates are derived from stated conventions rather than published calendars; the August refunding auction sizes are unverified.
- Unknowable: who holds this, and whether a bond, futures or swap position sits behind it. A rates desk rarely holds a naked options view.
Last updated: 2026-08-14 — next-day OPRA open interest resolved the $87 leg as an open, though ≈34% of it was a transfer rather than new exposure (see the ✅ RESOLVED section).
This is market analysis and education, not investment advice. Options carry substantial risk of loss.