🛡️ TSLA $9.17M Put-Spread Collar — A Downside Hedge Out to December 2028
📅 2026-07-31 | 🔥 Unusual Activity Detected
✅ UPDATE — August 3, 2026 pre-market: the OI check is in and all three legs opened — including the $400 call we could not prove. $250 put 2,225 → 11,609 (+9,384); $175 put 167 → 8,092 (+7,925, exact); $400 call 6,041 → 8,484 (+2,443, ≈98% of print). The entire structure is new risk. See the ✅ RESOLVED box.
🎯 The Quick Take
At 12:54 p.m. today, someone put on a four-leg options package in Tesla that bought downside protection from $250 down to $175, financed by giving up upside above $400 — all expiring December 15, 2028, nearly 2.4 years from now. Gross premium moved was $81.76M, but because this is a spread with legs bought AND sold, the real number that matters is the net debit: $9.17M. That $9.17M buys roughly $85M of downside notional exposure — and the same-second, 273,706-share stock block that printed alongside it proves this package went on delta-neutral, which is the tape's way of telling us this looks like insurance on an existing Tesla position, not a fresh bearish bet. We can't prove that motive — only the tape's exposure — and we'll say exactly where that line is throughout this piece.
📊 Company Overview
Tesla, Inc. (NASDAQ: TSLA) designs, manufactures and sells electric vehicles (Model 3, Model Y, Model S, Model X, Cybertruck, Semi, Cybercab), stationary battery storage (Powerwall, Megapack), and solar products — and is increasingly pitching itself as an AI/robotics company via Full Self-Driving (FSD), the Robotaxi network, the Optimus humanoid robot, and in-house AI silicon.
- Sector: Consumer Discretionary (Automobile Manufacturers, with a growing AI/Industrials overlay)
- Market cap: ≈$1.23 trillion
- Shares outstanding: ≈3.95 billion
- Spot at the time of this trade: $309.95
- Trailing P/E: ≈286× · Forward P/E: ≈160×
Tesla just came off its worst week since 2022 — down ≈21% over six straight red sessions, breaking below $300 on 2026-07-29 after a mixed Q2 print. More on that below.
💰 The Option Flow Breakdown
📋 The Trade — 🤝 BLOCK CROSS, all four legs, same millisecond
| Time | Symbol | Buy/Sell | Call/Put | Expiration | Premium | Strike | Volume | OI | Size | Spot | Option Price | Option Symbol |
|---|---|---|---|---|---|---|---|---|---|---|---|---|
| 12:54:00 | TSLA | BUY | PUT | 2028-12-15 | $34.64M | $250 | 9,463 | 2,225 | 7,200 | $309.95 | $48.11 | TSLA20281215P250 |
| 12:54:00 | TSLA | BUY | PUT | 2028-12-15 | $10.83M | $250 | 9,463 | 2,225 | 2,250 | $309.95 | $48.12 | TSLA20281215P250 |
| 12:54:00 | TSLA | SELL | PUT | 2028-12-15 | $16.20M | $175 | 7,926 | 167 | 7,925 | $309.95 | $20.44 | TSLA20281215P175 |
| 12:54:00 | TSLA | SELL | CALL | 2028-12-15 | $20.10M | $400 | 2,591 | 6,041 | 2,500 | $309.95 | $80.39 | TSLA20281215C400 |
Paired equity block (PROVEN — same second): 273,706 shares printed at $308.85 at 12:54:00.832, carrying the qualified-contingent-trade marker. Computed option-package delta = −262,830 shares. The match is near-exact: the whole four-leg package went up delta-neutral at inception.
🤝 BLOCK CROSS — this was a negotiated cross (a broker matched both sides off the open book), not a lit sweep. No aggression, no panic — a known counterparty took the other side of each leg.
The math on capital: paid $45.47M for the $250 puts, collected $36.30M for the $175 puts and $400 calls → net debit $9.17M. That's the number that belongs in any headline, not the $81.76M gross (gross double-counts the legs they sold).
✅ RESOLVED — All Three Legs Opened, Including the One We Couldn't Prove
Two of the three strikes were already near-proven opens from size alone. The third — the $400 call — was genuinely unprovable, and we named the test in advance: OI up ≈2,500 = opening; OI down = closing. The August 3 pre-market OPRA snapshot came back on the opening side of all three:
| Leg | Baseline OI (Jul 31 snap) | Resolving OI (Aug 3 snap) | Δ | Print size | Δ as % of print | Verdict |
|---|---|---|---|---|---|---|
| Dec-15-2028 $250 Put (bought) | 2,225 | 11,609 | +9,384 | 9,450 | ≈99.3% | ✅ OPEN (BTO) |
| Dec-15-2028 $175 Put (sold) | 167 | 8,092 | +7,925 | 7,925 | 100.0% | ✅ OPEN (STO) |
| Dec-15-2028 $400 Call (sold) | 6,041 | 8,484 | +2,443 | 2,500 | ≈97.7% | ✅ OPEN (STO) — the ambiguous leg resolved opening |
The $400 call is the one that mattered, and it came back clean. Open interest rose by 2,443 against a 2,500-lot print — ≈98% of the trade converted straight into new open interest. A print landing on a strike whose open interest grows by nearly its full size cannot have been closing an existing long; the "partially closing out contracts someone already held" alternative is ruled out. This was a genuine fresh short call.
The $175 put matched to the exact contract (100.0%), and the $250 put converted 99.3%. All three legs are new risk — the entire structure was built from scratch, not adjusted out of something pre-existing. Every label in the analysis below now stands on confirmed footing rather than inference.
🤓 What This Actually Means — Plain English
This is a put spread collar — a three-part structure built for one purpose: cap the pain on the downside while giving something up on the upside to pay for it.
Break it into pieces:
- BTO the $250 puts (long puts): this is the actual insurance. If TSLA falls below $250, these gain value dollar-for-dollar the lower the stock goes — right up until the next leg kicks in.
- STO the $175 puts (short puts): this is what pays for most of the insurance. Selling these puts collects premium, but it also caps how much protection the position gets. Below $175, the short put's losses start canceling out the long put's gains — the trader is unprotected again below that floor. This is the single most important thing to understand about a put spread collar: the protection has a floor AND a ceiling on how far it reaches.
- STO the $400 calls (short call): this caps upside participation above $400. You only give up upside you don't have if you don't own the stock — selling a call you don't want exercised against you is a bet on a security you already hold. This is the leg that makes the "hedge, not a directional bet" reading plausible.
Put it together and here's the retail translation: for $9.17M, this trade bought roughly $85M of downside coverage on Tesla, active between $250 and $175, for nearly two and a half years — while giving up any stock gains above $400 during that same window. It's the options equivalent of buying a homeowner's insurance policy with a $250-strike deductible, a $175-strike coverage ceiling, and a landlord who takes any home-value gains above $400 in exchange for the discount.
On direction — a forensics note. All four legs printed at the mid (48-51% of the way across the bid-ask), which is normal for a negotiated cross — it tells us nothing about aggression or urgency on any single leg. The read here doesn't come from "buy pressure" or "sell pressure" at all; it comes purely from the structure (what strikes were bought vs. sold) and the delta math (the −262,830 share package matched almost exactly against a 273,706-share stock block in the same second). That's a genuinely useful forensic distinction: on a cross, per-leg tape aggression is meaningless — you have to read the structure.
On motive — this is where we have to be honest about limits. The structure is most consistent with hedging a large existing Tesla holding: you typically only sell a call at $400 if you already own shares and are willing to cap them there. The alternative reading — a financed, purely bearish outright view using the collar to reduce the cash outlay — is also fully consistent with the same tape. The OPRA tape proves the exposure (the delta-neutral package, the strikes, the premium). It does not prove the motive. We can't see whether the trader owns TSLA shares, and neither can anyone reading the tape. Grade the "hedge" read as INFERRED, not proven.
📈 Technical Setup / Chart Check-Up
YTD Chart
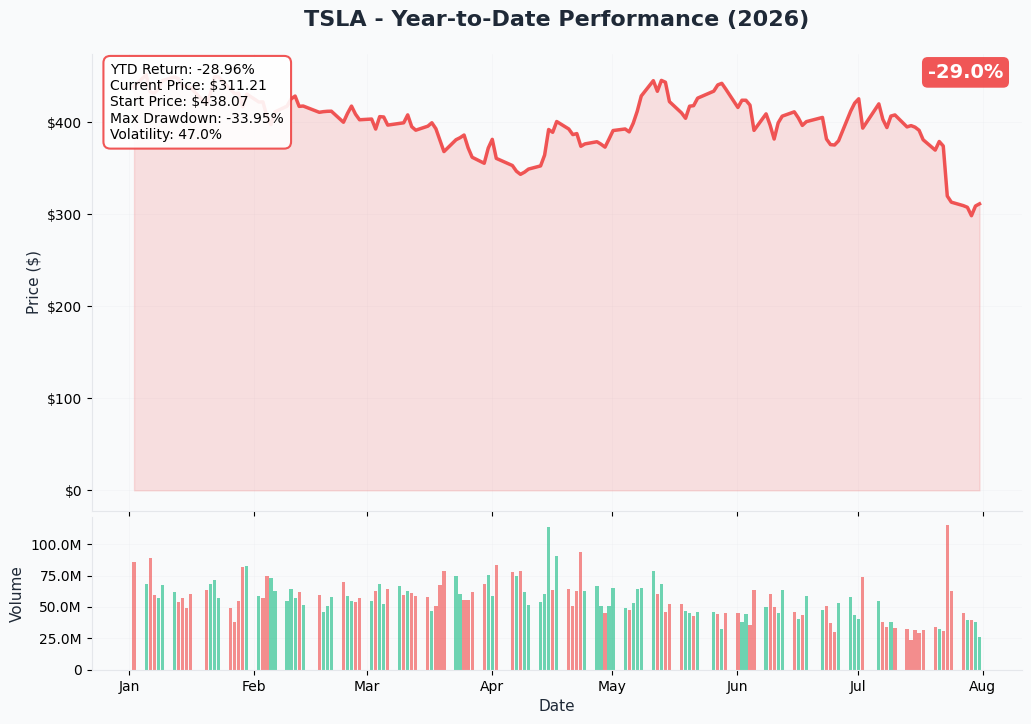
Tesla is down roughly 29% year-to-date, and the chart shows why this hedge landed when it did — the stock just logged its worst week since 2022. It fell -14.5% on 2026-07-23 alone after Q2 earnings, then racked up six straight red days for a cumulative ≈-21%, breaking below $300 on 2026-07-29 to a near one-year low, per Trefis and Yahoo Finance. This collar was put on nine days after the earnings gap — after the damage, not ahead of it.
🎯 Gamma-Based Support & Resistance
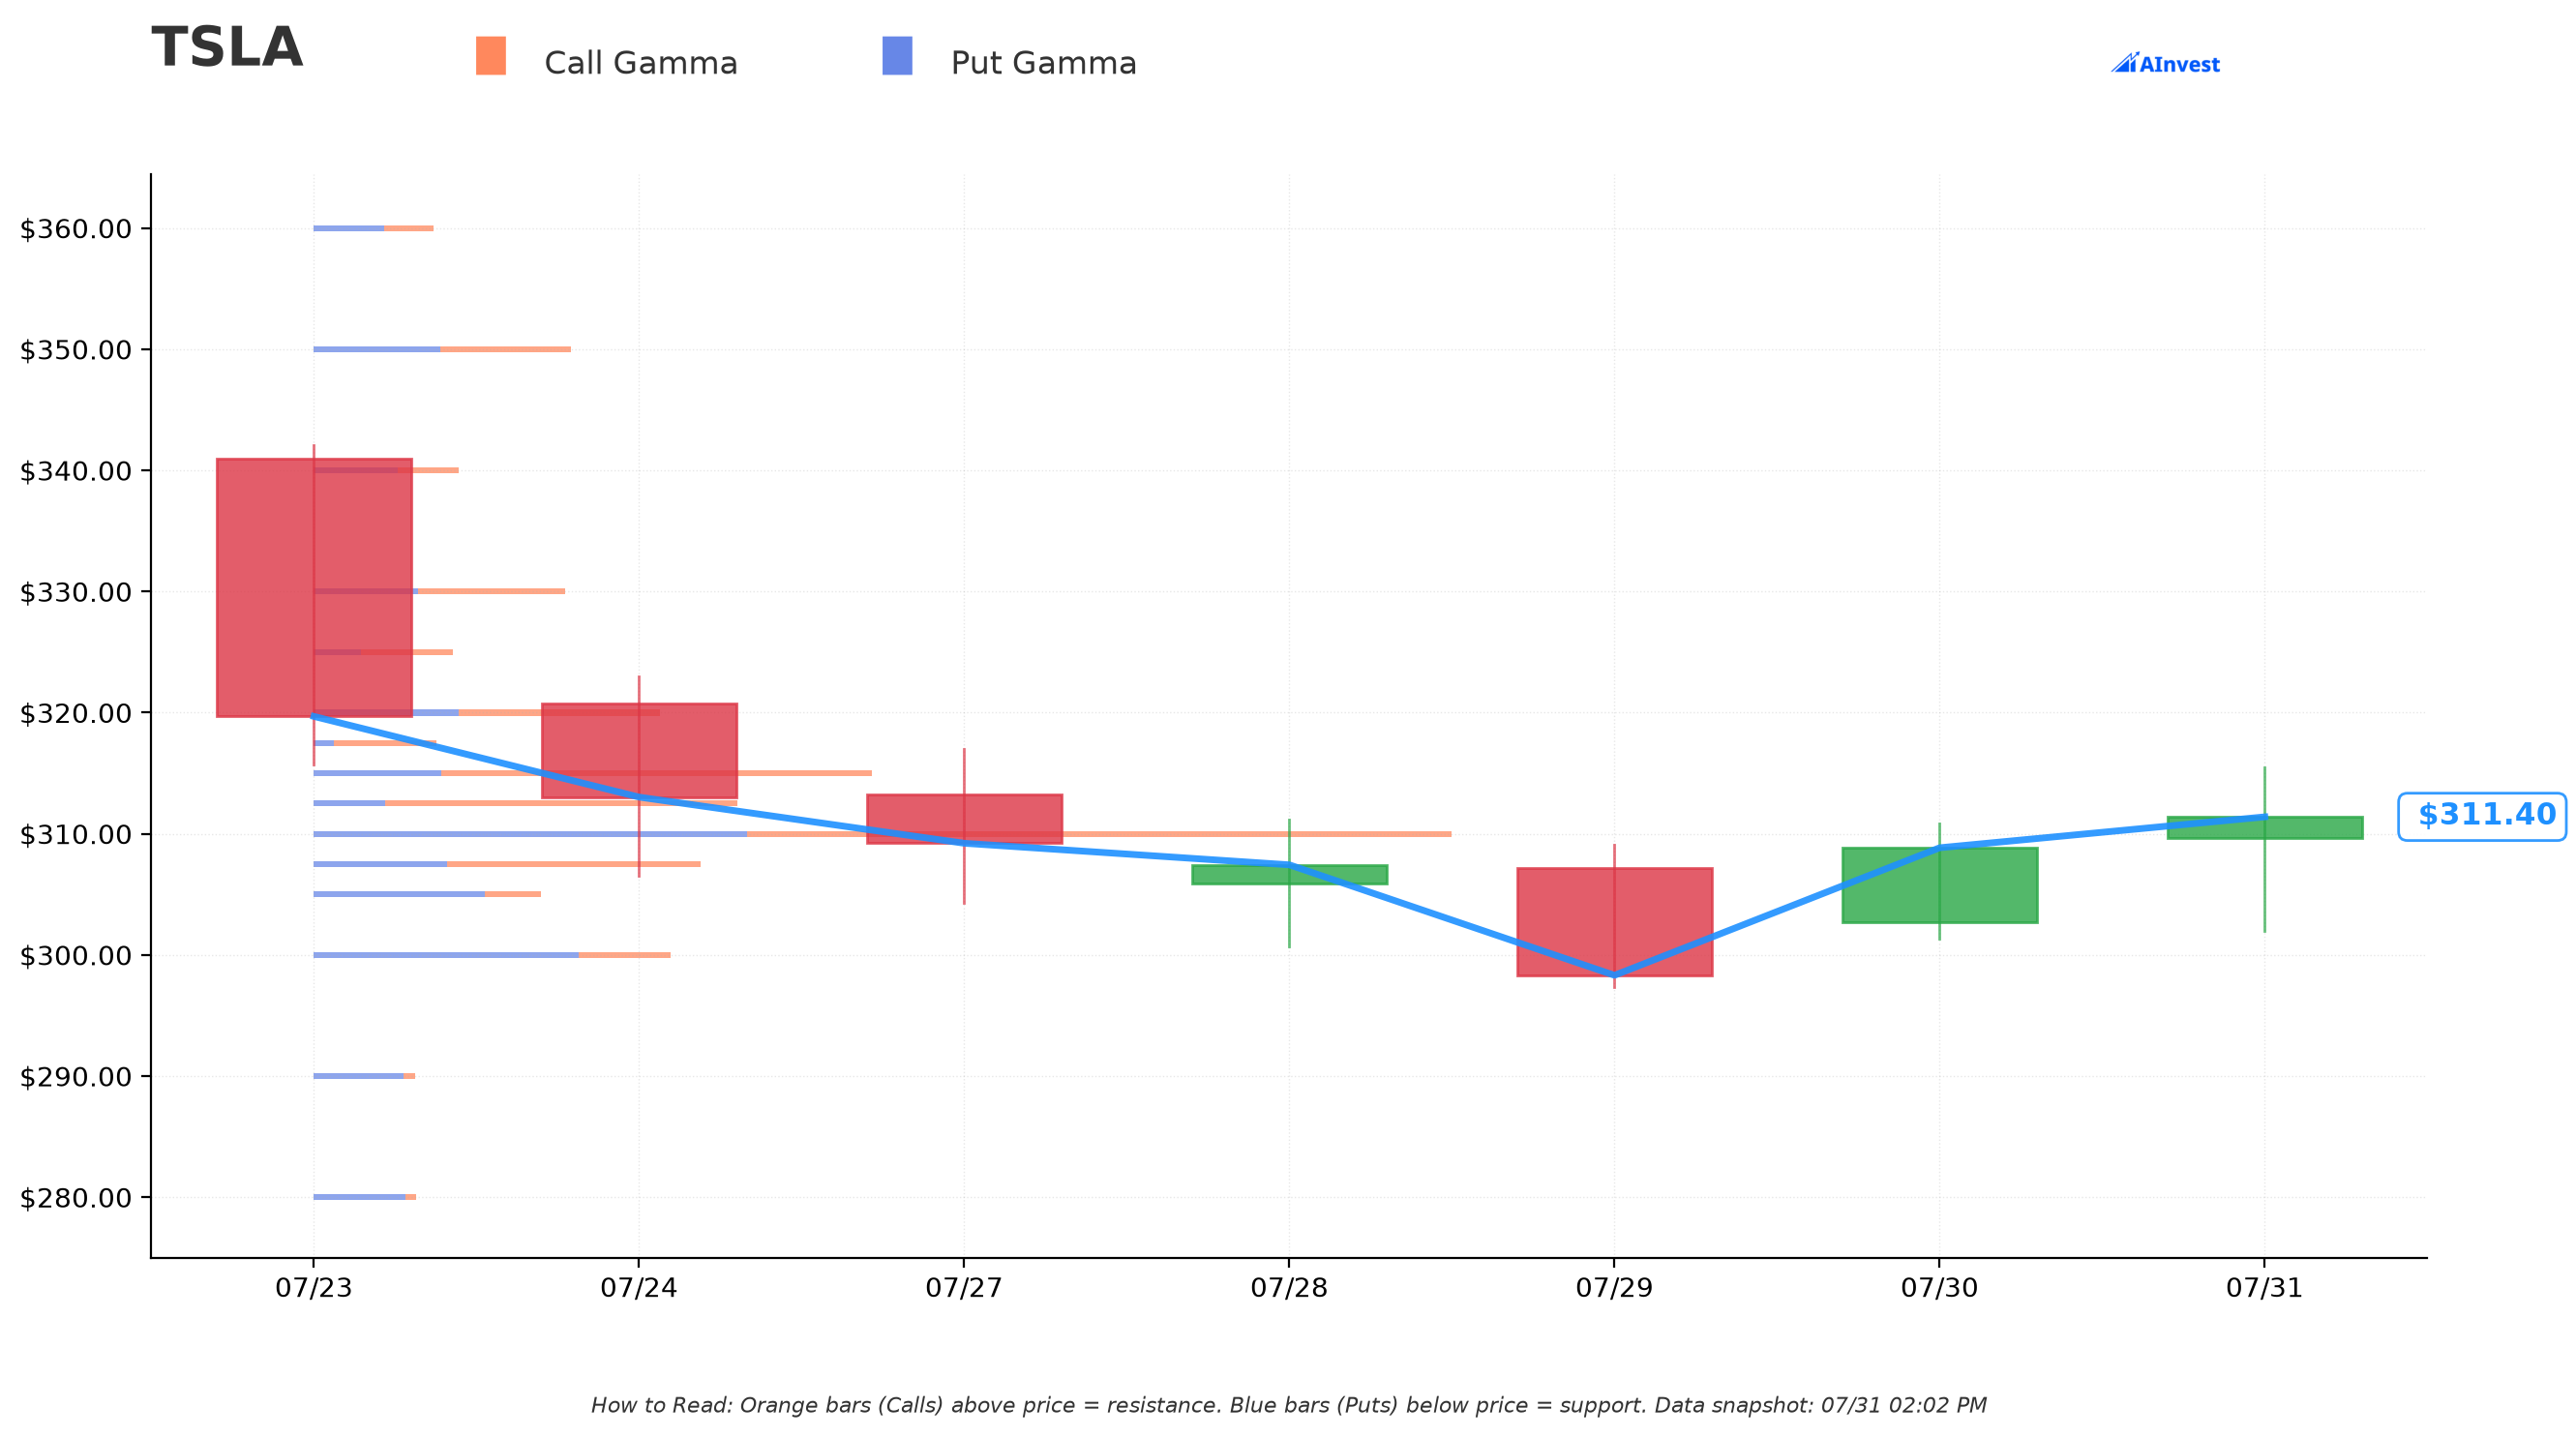
With spot near $311.35, dealer positioning shows the nearest walls tightly bunched around the stock:
🔵 Support below spot:
- $310 — the single largest gamma wall on the board (total gex ≈102.7B), just 0.43% below spot
- $307.50 — very strong support, 1.23% below spot
- $300 — very strong, 3.64% below spot, and notably put-dominated (net gex −15.4B) — this is where dealers are long puts against the market, a magnet if the stock rolls over again
🟠 Resistance above spot:
- $312.50 — very strong, just 0.37% above spot
- $315 — the strongest resistance level nearby (total gex ≈50.3B), 1.17% above spot
- $320 — very strong, 2.78% above spot
A striking coincidence worth flagging honestly: both strikes in today's collar line up with real, named gamma walls in the current chain — $250 is itself a listed support wall (total gex ≈7.2B, 19.7% below spot) and $400 is itself a listed resistance wall (total gex ≈17.8B, 28.5% above spot, call-dominated). That said, gamma walls are built from today's open interest and reset constantly — they're a near-term dealer-hedging map, not a multi-year forecast, so treat this as an interesting anchor point rather than a prediction that those levels will still matter in 2028.
📐 Implied Move Analysis
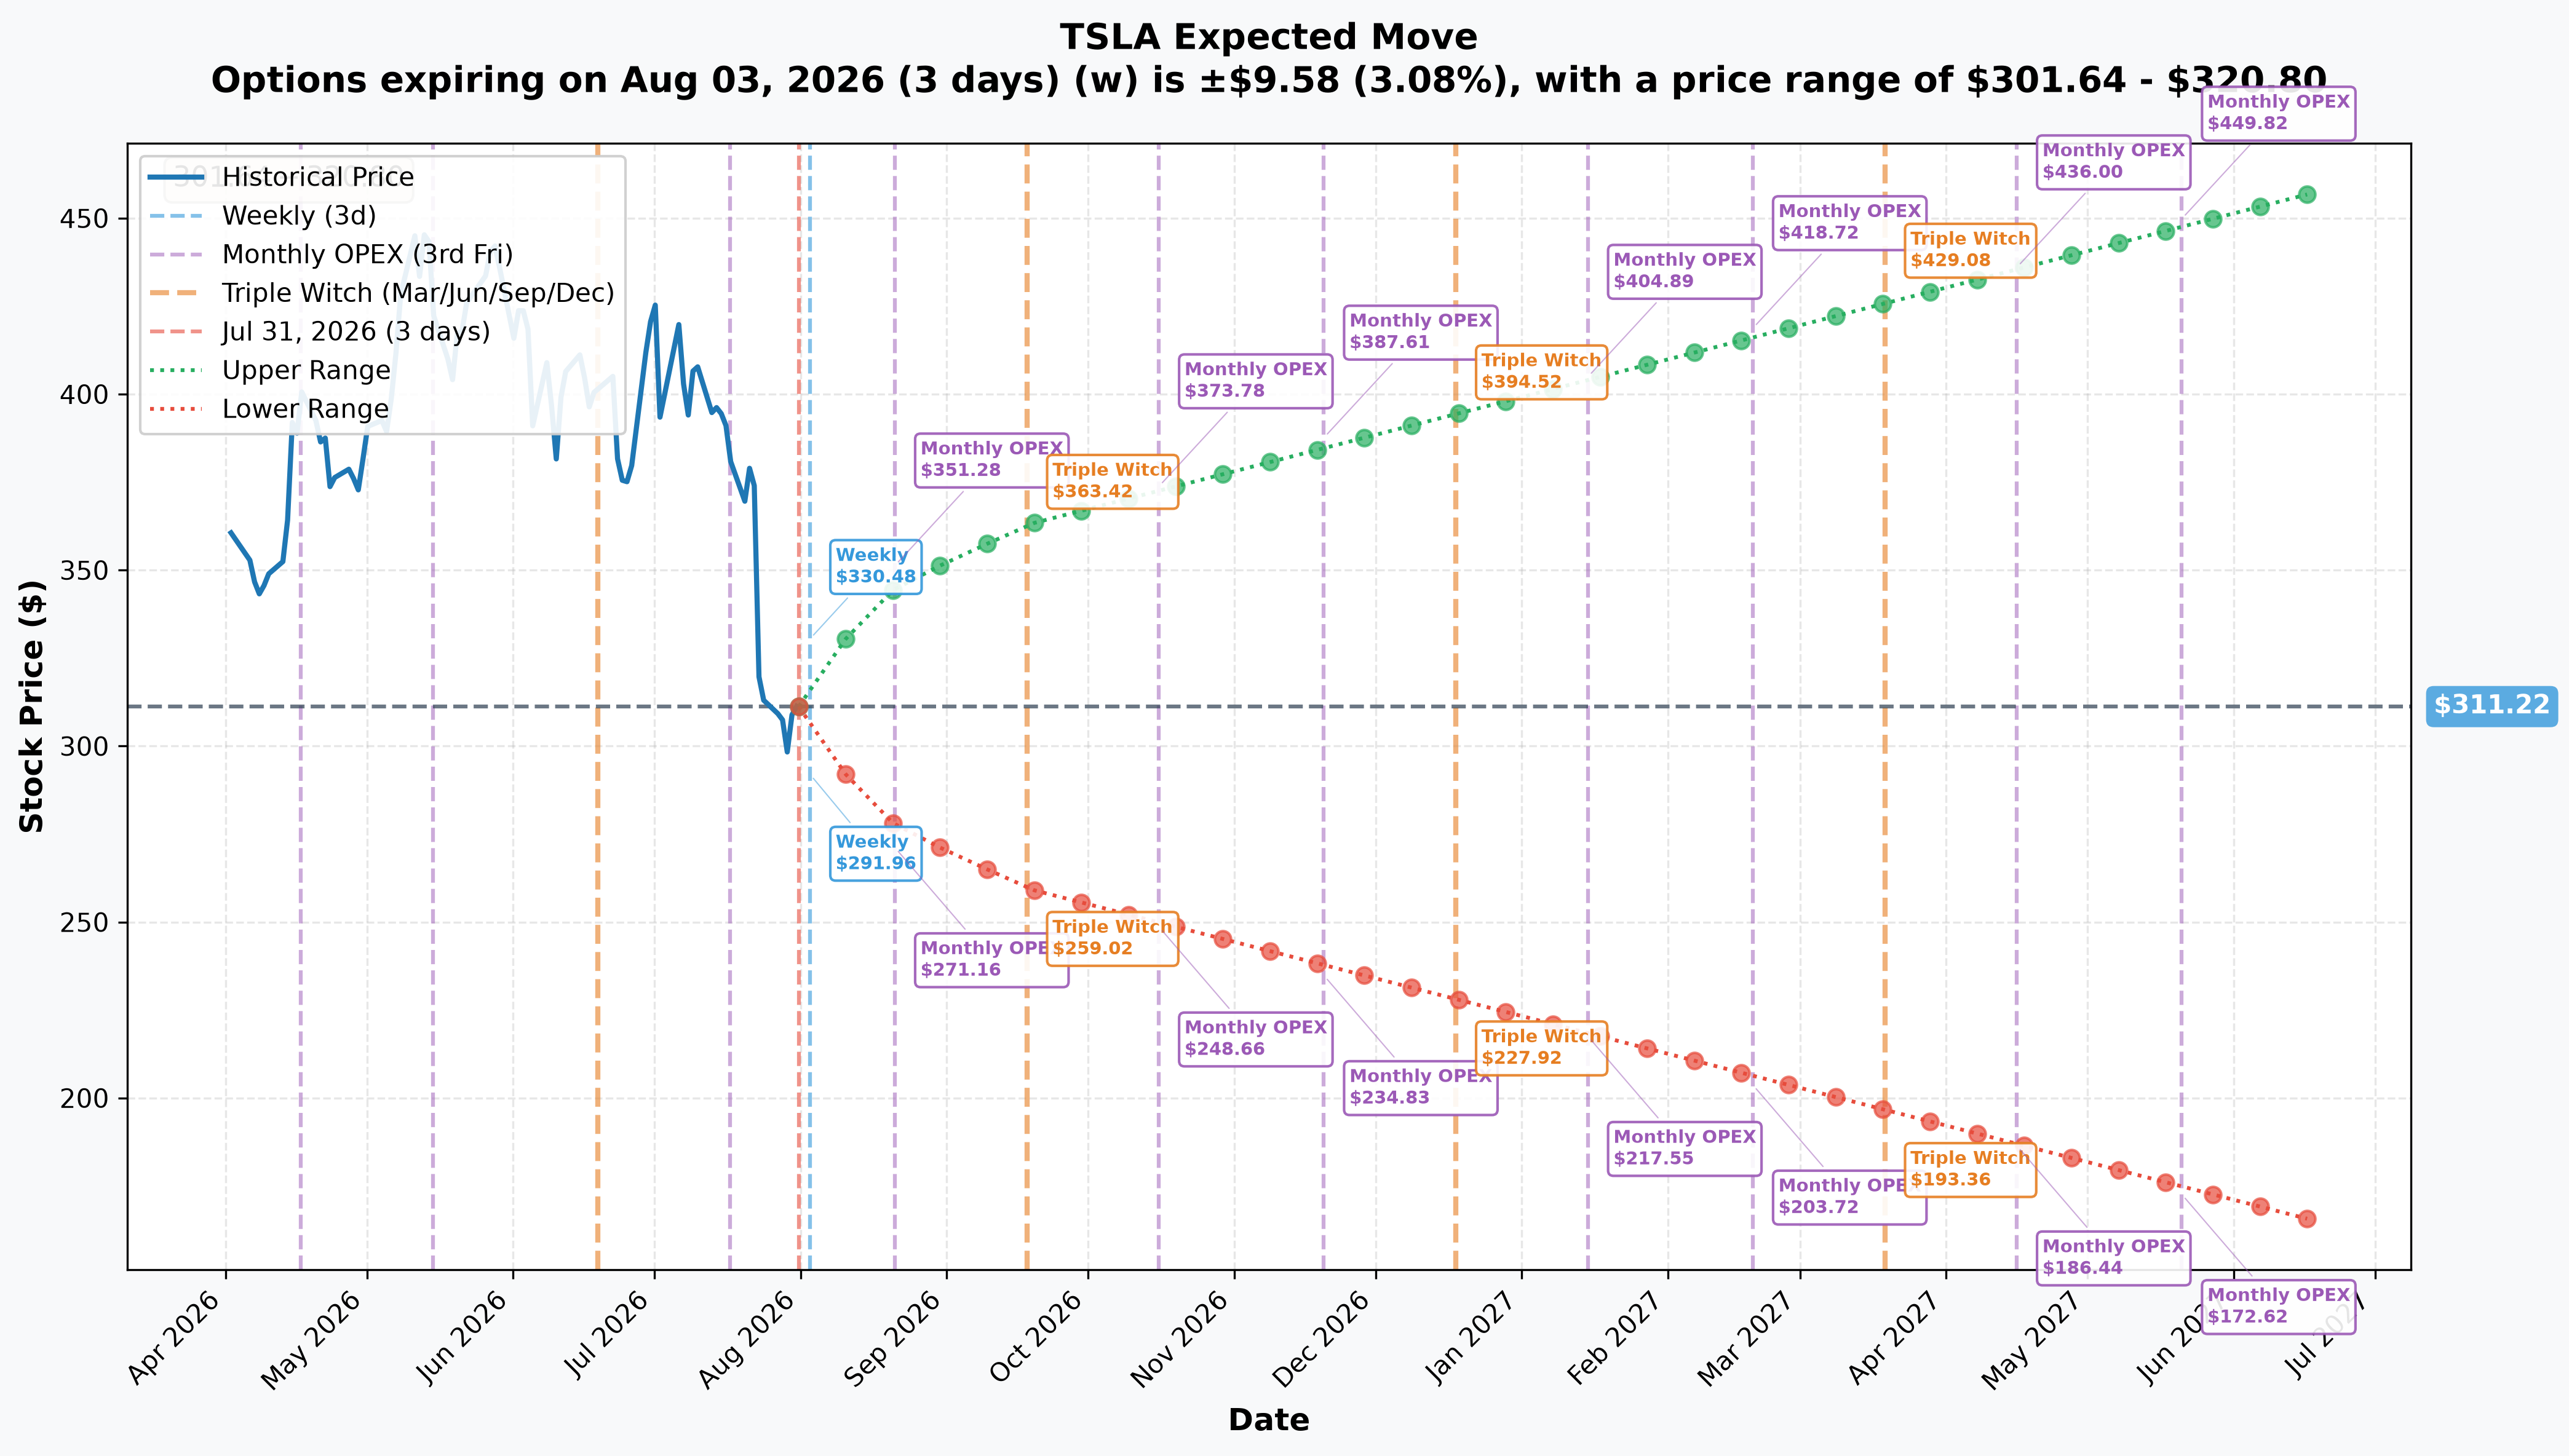
Options pricing today for the standard expirations:
- Weekly (2026-08-03, 3 DTE): ±3.08% (±$9.58) → range $301.64 – $320.80
- Monthly OPEX (2026-08-21, 21 DTE): ±11.08% (±$34.47) → range $276.75 – $345.69
- Quarterly triple witch (2026-09-18, 49 DTE): ±16.66% (±$51.85) → range $259.37 – $363.07
- Longest-dated LEAPS priced (2027-06-17, 321 DTE): ±46.87% (±$145.86) → range $165.36 – $457.08
Here's the useful detail: the collar's short strikes are $175 and $400 — and even the market's longest-priced implied-move curve today (321 days out, June 2027) already spans $165.36 to $457.08. Both of the collar's strikes fall inside that one-year-ish statistical range. The Dec-2028 contract in this trade runs roughly 550 days beyond that curve — meaning the protection band and the cap were anchored to strikes well within a single year's worth of priced volatility, not arbitrary round numbers, even though the position itself runs much longer.
🎪 Catalysts
📌 Already Happened (Last 3 Months)
- Q2 2026 earnings (2026-07-22): revenue beat at $28.24B (+26% YoY), but non-GAAP EPS missed at $0.33 vs. $0.53 consensus, operating income fell 57% YoY to $398M (1.4% margin), and free cash flow went negative at −$1.09B as capex jumped +142% to $5.79B, per Electrek and Investing.com.
- Stock reaction: -14.5% on 2026-07-23 to an 11-month low, then six straight red days for a cumulative ≈-21% by 2026-07-30, wiping out ≈$261B of market value, per TECHi and Trefis.
- Guidance: Tesla said FY2026 capex will be "more than $25 billion," rising further in H2 and for "the next two or three years," while arranging up to $30 billion of new debt capacity, per Seeking Alpha.
- Analyst reaction was violently split: post-earnings price targets now range from $130 (Wells Fargo, Underweight/Sell) to $600 (Wedbush, Bullish) — a ≈4.6× spread — with JPMorgan's $145 implying more than 50% downside, per TECHi and TipRanks. This isn't a normal target dispersion — TECHi frames it as two incompatible theses being priced on the same stock at once: Tesla as a margin-eroding cyclical automaker versus Tesla as a pre-revenue AI company whose autonomy payoff justifies the capex burn. That kind of dispersion is exactly the regime where long-dated optionality gets bought, in either direction.
- NHTSA escalation (2026-07-21): regulators formally demanded Tesla's internal "Radar Saves Us" document in the FSD reduced-visibility crash probe, per Electrek — this sits inside a broader Engineering Analysis covering ≈3.2 million vehicles, the final procedural step before a mandated recall, opened 2026-03-18, per FinancialContent.
🔮 Ahead — Both Inside and Far Beyond a Dec-2028 Contract
The next few quarterly catalysts sit deep inside this position, and the Dec-2028 expiry is deliberately built to shrug off any single one of them:
- Q3 2026 delivery report: ≈2026-10-02, per Tesla's usual first-business-days-of-month pattern (Electrek).
- Q3 2026 earnings: 2026-10-28 — provider-listed, not yet Tesla-confirmed — per Investing.com and TipRanks.
- FSD v15 (a 1B→10B parameter rewrite) targeted late 2026/early 2027 — Tesla has said it won't scale robotaxi fleets aggressively before it ships, per Electrek.
- Robotaxi scale, today: Tesla runs ≈44 unsupervised vehicles across seven metros with 380,000+ miles, per Investing.com — against Waymo's ≈3,000 vehicles and ≈500,000 paid rides/week targeting ≈1 million/week by end-2026, per EVDance. By December 2028, the market will know whether Tesla closed that gap.
- The Musk pay-tranche ladder as a 2028 scoreboard: tranche 1 of Musk's approved ≈$1 trillion pay package requires a $2 trillion market cap — ≈63% above today's ≈$1.23T — per CBS News. Progress (or visible failure) toward that number is a recurring re-rating driver right through this contract's life.
- Leverage regime change: up to $30B of new borrowing capacity plus multi-year rising capex means Tesla enters 2028 far more levered than at any point since 2019, per Seeking Alpha — this is the mechanism by which a long-dated put ultimately gets paid, if it does.
- The NHTSA Engineering Analysis outcome on 3.2 million vehicles remains pending and unresolved at any time between now and expiry, per FinancialContent — the cleanest identified tail-risk catalyst for a downside structure like this one.
None of these single dates is the point of a December-2028 contract. This structure is deliberately indifferent to any one quarter — it's a multi-year bet on where the robotaxi/Optimus/FSD story and Tesla's balance sheet land, not a Q3 earnings play.
🎲 Scenarios Through December 2028
Because we're two-plus years out, near-term gamma and implied-move data can only inform the first leg of this journey — the picture from here to 2028 is dominated by the catalysts above, not this week's dealer positioning.
📈 Bull Scenario
Tesla executes on robotaxi scale-up (FSD v15 ships close to schedule, fleet grows well beyond today's ≈44 vehicles), Optimus reaches meaningful production, and the ≈$25B+/year capex program starts converting into earnings rather than just cash burn. In this world, TSLA pushes well past $400 by 2028, the short call caps the trade's upside participation, but the $9.17M outlay was cheap insurance that simply expired worthless — the "cost of doing business" for someone who stayed long the stock through the volatility.
⚖️ Base Scenario
Tesla continues its current pattern: solid delivery growth, thin near-term profitability, heavy capex, and a stock that chops in a wide band as the market re-prices the AI/robotaxi bet quarter to quarter. TSLA lands somewhere between $175 and $400 at expiry — the exact zone where this collar's protection is calibrated. The long puts and short puts largely offset each other, the short call caps nothing, and the position behaves as designed: a bounded cost for bounded protection.
📉 Bear Scenario
The robotaxi/Optimus bull case stalls (FSD v15 slips further, the NHTSA Engineering Analysis triggers a recall, leverage strains the balance sheet), and TSLA falls meaningfully below $250. This is where the $250 long puts pay off — but only down to $175. Below $175, the short put's losses cancel the long put's gains dollar-for-dollar, and the position is unprotected again. JPMorgan's post-earnings $145 target (implying >50% downside from spot) sits below that floor — worth remembering when sizing any similar structure.
👥 Four-Reader Interpretation
🎰 YOLO Trader: This isn't your trade. There's no leveraged upside bet here to copy — it's a capital-preservation structure on ≈$85M of exposure that most retail accounts can't replicate at any scale. If you want directional torque on TSLA, this collar tells you nothing actionable except "someone big is nervous enough to pay for protection."
📊 Swing Trader: The real signal here is the timing and the strikes chosen, not a trade to mirror outright. A hedge put on nine days after a -21% drawdown, structured with $250/$175 puts and a $400 call cap, tells you a sophisticated player thinks $175-$250 is a meaningful floor zone and $400 a meaningful ceiling over a multi-year horizon — useful context for your own shorter-dated levels, especially since $250 and $400 line up with today's actual gamma walls.
💰 Premium Collector: There's a lesson in the mechanics, not the trade itself: this package collected $36.30M by selling the $175 put and $400 call to finance $45.47M of long-put protection. If you're running covered calls or cash-secured puts on TSLA, the fact that professional money sold a $400 call against shares (implying they think $400 upside is a reasonable place to cap gains from here) and a $175 put (implying they're comfortable owning more TSLA there) is a data point worth weighing against your own strikes.
🌱 Beginner: This is a great real-world example of what a "collar" actually is — buy protection, sell some upside to help pay for it, accept that the protection only works within a defined band. The one-sentence takeaway: insurance has a deductible and a ceiling. If you ever build a collar on a stock you own, know exactly where your protection stops (here, $175) before you need it.
⚠️ Risk Factors & Honest Limits
What the tape cannot tell us:
- Whether the trader owns TSLA shares. This is the single fact that separates a hedge from an outright bearish bet, and OPRA data simply does not show it. Everything in the "hedge" reading is inference from structure (selling a call typically implies owning shares to cap), not proof.
- Broker or counterparty identity, customer intent, or any invisible stock/futures position beyond the 273,706-share block we can see.
- Whether the $400 call leg is a new short or a partial close — size (2,500) came in below prior OI (6,041), so tomorrow's OI print is the definitive test, not today's tape.
What could go wrong with the underlying thesis:
- Tesla trades at ≈286× trailing / ≈160× forward earnings — a valuation that leaves little room for execution slippage on robotaxi, Optimus, or FSD v15 timelines that have already slipped repeatedly.
- Free cash flow just turned negative (−$1.09B) while capex is set to keep rising for "two or three more years" — a genuine balance-sheet regime change funded partly by up to $30B of new debt.
- The NHTSA Engineering Analysis on 3.2 million vehicles remains open and unresolved — a real, specific, dated tail risk that could strike directly at the FSD thesis this whole multi-year bet depends on.
- A retail trader cannot replicate this trade's scale, financing, or delta-hedged construction — this is presented for what it reveals about institutional positioning and risk framing, not as a template to copy dollar-for-dollar.
Options trading involves substantial risk of loss and may not be suitable for all investors. This analysis is for educational purposes and is not financial advice. Nothing here proves the trader's motive, and readers should not assume a hedge is bearish or a directional bet is proven — the tape shows exposure, not intent.
🎯 The Bottom Line
Real talk: Someone built a $9.17M net collar on Tesla that protects roughly $85M of downside between $250 and $175, capped above $400, running out to December 2028 — and the same-second stock block proves it was delta-neutral the moment it printed. That's most consistent with a large holder buying peace of mind after Tesla's worst week since 2022, but the tape can only prove the exposure, not the motive. Mark tomorrow morning (≈06:30 ET) on your calendar — next-day OI will tell us whether the $400 call leg was a fresh short or a partial close, and we'll update this piece if the picture flips.
If you own TSLA and are watching this kind of structure for inspiration: know that "protection" in a collar like this has both a floor and a ceiling — below $175, this trader's hedge stops working just like yours would.
Last updated: 2026-08-03 — next-day OPRA open interest confirmed all three legs OPEN, including the previously unprovable $400 call (6,041 → 8,484, +2,443).