🔄 TSM: A $14M Long-Call EXIT and a $1.2M Lightning Lottery Ticket, 15 Minutes Apart
📅 August 3, 2026 | 🔥 Unusual Activity Detected — Two Separate, Opposite-Direction Trades
🔄 CORRECTION — August 4, 2026 pre-market: the $14M call sale was a LONG HOLDER EXITING, not a bearish short. Open interest on the Sep-18 $400 call fell 21,661 → 16,725 (−4,936) — almost exactly the ≈16,661 we said a close would produce. Trade 1 is STC (sold to close), so the $14.00M is the proceeds of liquidating an existing position, not premium collected for taking on new risk. The Aug-7 $420 call opened as published (2,605 → 6,748). See the ✅ RESOLVED box.
🎯 The Quick Take
Two completely different TSM option trades printed 15 minutes apart, and they should NOT be read as one story. First, a $14.0M block sale of 5,000 Sep-18 $400 calls — negotiated off the open book, at-the-money, and flagged at publication as unprovable either way. The next-day open-interest snapshot has since resolved it: open interest at that strike FELL by 4,936 contracts, so this was a long holder selling to close. The $14.0M is exit proceeds from a position that already existed, not premium collected for taking on a new short — there is no new ceiling over TSM from this print. Second, a $1.2M lit, at-the-offer buy of 4,000 Aug-07 $420 calls — a small, fast, aggressive four-day lottery ticket, confirmed opening. Treat them separately: one desk was liquidating, the other initiating, and only the second carries a directional signal. (The ≈$12.80M net credit across both is an accounting sum of two unrelated participants' cash flows, not one position.)
📊 Company Overview
Taiwan Semiconductor Manufacturing Company (TSM) is the world's dominant dedicated chip foundry — it doesn't design chips, it manufactures them for everyone else, including Nvidia, Apple, AMD and Broadcom.
- Listing: NYSE, American Depositary Receipt — 1 ADR = 5 ordinary shares of 2330.TW (Taiwan Stock Exchange)
- Sector / Industry: Technology / Semiconductors
- Market Cap: ≈$1.90 trillion on an ADR basis (some data providers show ≈$2.09T using a different share-count convention — the sources disagree, so treat the figure as approximate)
- HQ: Hsinchu City, Taiwan · founded 1987 · CEO Dr. C.C. Wei
- Business: Pure-play foundry — CMOS logic, mixed-signal, RF and embedded-memory wafer fabrication, plus advanced packaging (CoWoS, SoIC). End markets: HPC/AI, smartphone, IoT, automotive
- Performance: +26.1% YTD, though the last 3 months have been rough and choppy — the stock is still ≈15.9% below its 52-week high of $479.00, trading below its 50-day average ($425.36) but well above its 200-day average ($357.82)
💰 The Option Flow — Two Trades, Read Separately
The Tape
| Time | Buy/Sell | Type | Expiration | Premium | Strike | Volume | Prior OI | Size | Spot | Option Price | Symbol | Mechanism |
|---|---|---|---|---|---|---|---|---|---|---|---|---|
| 09:47:48 | SELL | CALL $400 | 2026-09-18 | $14.00M | $400 | 5,250 | 21,661 | 5,000 | $400.60 | $28.00 | TSM20260918C400 | 🤝 BLOCK CROSS |
| 10:03:00 | BUY | CALL $420 | 2026-08-07 | $1.20M | $420 | 5,105 | 2,605 | 4,000 | $401.54 | $3.00 | TSM20260807C420 | ⚡ LIT |
Net across both legs: ≈$12.80M CREDIT ($14.00M collected − $1.20M paid).
Trade 1 (09:47:48) — a 5,000-lot block of Sep-18 $400 calls sold at the bid, printed as a single negotiated block cross — meaning a broker matched a known buyer and seller off the open book, not an anonymous sweep through displayed liquidity. The strike is essentially at-the-money (spot $400.60). Estimated share-equivalent exposure on this leg: ≈281,300 shares short delta.
Trade 2 (10:03:00) — a much smaller 4,000-lot buy of Aug-07 $420 calls at the ask, genuinely lit — meaning it took real displayed liquidity in the open market, no negotiated counterparty. The strike sits ≈4.6% above spot ($401.54), and the contract expires this Friday, August 7 — just four calendar days away. Estimated share-equivalent exposure: ≈100,800 shares long delta.
✅ RESOLVED — Next-Day OI Is In (August 4, 2026 pre-market)
The OPRA open-interest snapshot timestamped August 4, 2026 ≈06:30 ET reflects the close of business August 3 — the definitive open-vs-close test we flagged when this published. Here is what it says.
| Leg | Baseline OI (Aug-3 snap) | Resolving OI (Aug-4 snap) | Δ | Print size | Predicted | Verdict |
|---|---|---|---|---|---|---|
| Sep-18-2026 $400 call (sold) — Trade 1 | 21,661 | 16,725 | −4,936 | 5,000 | ≈16,661 if closing | 🔄 CLOSE (STC) — INVERSION |
| Aug-07-2026 $420 call (bought) — Trade 2 | 2,605 | 6,748 | +4,143 | 4,000 | up to ≈6,605 | ✅ OPEN (BTO) — confirmed |
This is as clean a resolution as the data ever gives. We published two mutually exclusive predictions for Trade 1: open interest rising toward ≈26,661 (a new short call opened) or falling toward ≈16,661 (an existing long call closed). It printed 16,725 — within 64 contracts of the closing case. Only 322 contracts traded at that strike all day outside our block, so at least ≈4,807 of the 5,000 contracts sold were closing an existing long position.
🔄 What changes — and it changes the meaning of the headline number
Trade 1 was not a bearish bet. It was a profit-taking exit. Someone who already owned 5,000 September $400 calls sold them at $28.00 and walked away. Three things follow:
- The $14.00M is not "premium collected" in the risk-taking sense. It is the sale proceeds of an asset the seller already held. A trader who sells to open carries an obligation forward; a trader who sells to close carries nothing forward. This one carries nothing forward.
- There is no new short call in the market from this print. Any framing that treats the sale as a ceiling being placed over TSM, or as a desk taking the other side of the AI trade, is wrong. Open interest at the $400 strike shrank.
- The "net $12.80M credit" across both trades is an accounting sum, not a position. It adds the proceeds of one participant's exit to another participant's small lottery-ticket purchase. As the article already argued, these are almost certainly different desks — the OI resolution reinforces that, because one was liquidating and the other was initiating.
Trade 2 is confirmed exactly as published: a genuine new long in the four-day $420 call, open interest up 4,143 against a 4,000-lot print, with additional buyers opening alongside. The lit, at-the-offer, proven-opening read stands — and it is now the only directional signal in this session's TSM flow.
🤓 What This Actually Means — Plain English
Trade 1 — the $14M call sale — is a story we can only tell half of, honestly. Someone collected $14.00M by selling 5,000 Sep-18 $400 calls, right at the current stock price. If this is a fresh short call position (STO), it's a bet that TSM stays roughly where it is (or falls) through mid-September — classic premium-selling income, not a crash bet, since it was struck at-the-money rather than far out. But because 5,000 contracts is smaller than the 21,661 already outstanding, it's equally plausible this trader already owned those $400 calls and simply sold to close (STC) — banking a profit or trimming a long position ahead of September. On a negotiated block cross like this, there's a known counterparty on the other side, which itself tells you less about aggressive market conviction than a trade that fights its way through the order book. We're marking this ⏳ provisional until tomorrow's OI print — do not read it as confirmed bearish conviction.
Trade 2 — the $1.2M Friday call — is the trade that actually tells us something today. It's lit, it paid the ask, and the size (4,000) clearly exceeds the prior open interest of 2,605 — so this is a confirmed new long position, not ambiguous at all. That combination (took real liquidity + proven opening trade) is exactly why a lit, at-the-offer print carries more signal than a cross: on a cross, the price was pre-negotiated between two known parties who already agreed on it, so the "buy" label mostly tells you a deal happened, not that someone was aggressively chasing the stock higher. Here, somebody paid up in the open market for a strike that's 4.6% away with only four days on the clock. That's a directional, time-boxed bet — closer to a lottery ticket than a core position, and readers should size it that way: if TSM doesn't move fast, this expires worthless in four trading sessions.
Why we're not merging these into one narrative: they were placed by different mechanisms, at different confidence levels, with opposite directional leanings, 15 minutes apart. A block cross seller collecting premium at the money and a lit buyer chasing a 4-day lottery ticket can easily be two unrelated desks with two unrelated theses. Forcing them into a single "smart money view" would be manufacturing a story the tape doesn't support.
📈 Technical Setup / Chart Check-Up
YTD Performance
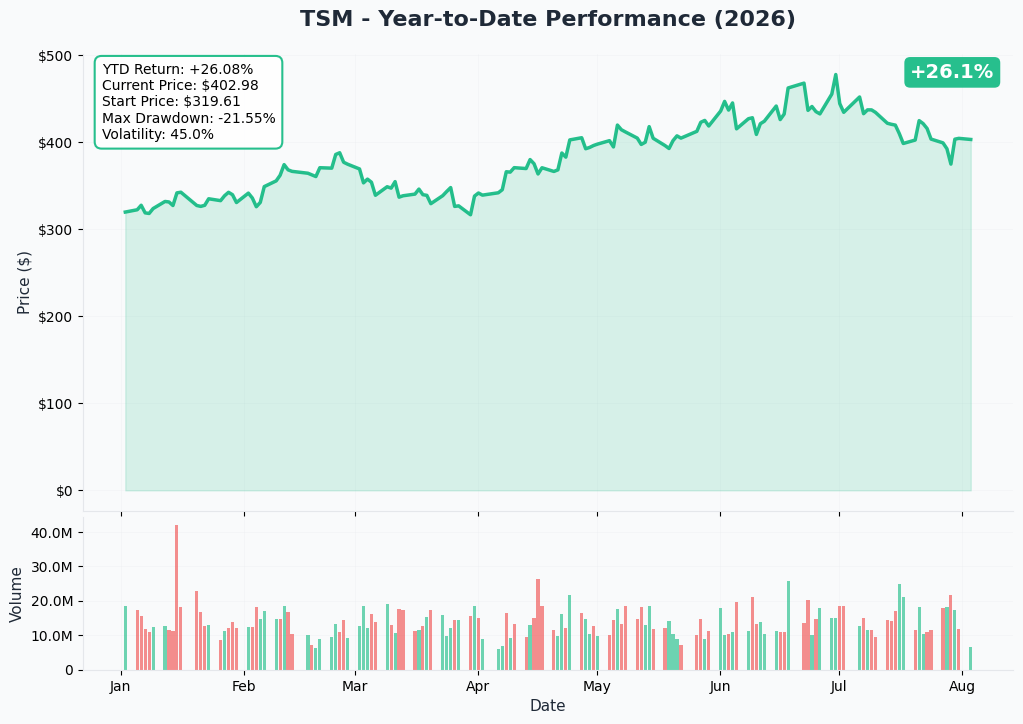
TSM is +26.1% YTD, but the last three months tell a much choppier story than the headline number suggests. The stock fell −2.32% on its beat-and-raise Q2 earnings day (July 16) and another −2.77% the next session — classic sell-the-news — then whipsawed with a −4.50% day on July 29 immediately followed by a +7.64% day on July 30 (driven by a Microsoft AI-chip capex headline, not TSMC's own news). Spot is currently trading below its 50-day average ($425.36) but comfortably above its 200-day average ($357.82), and sits ≈15.9% off its 52-week high of $479.00.
Gamma-Based Support & Resistance
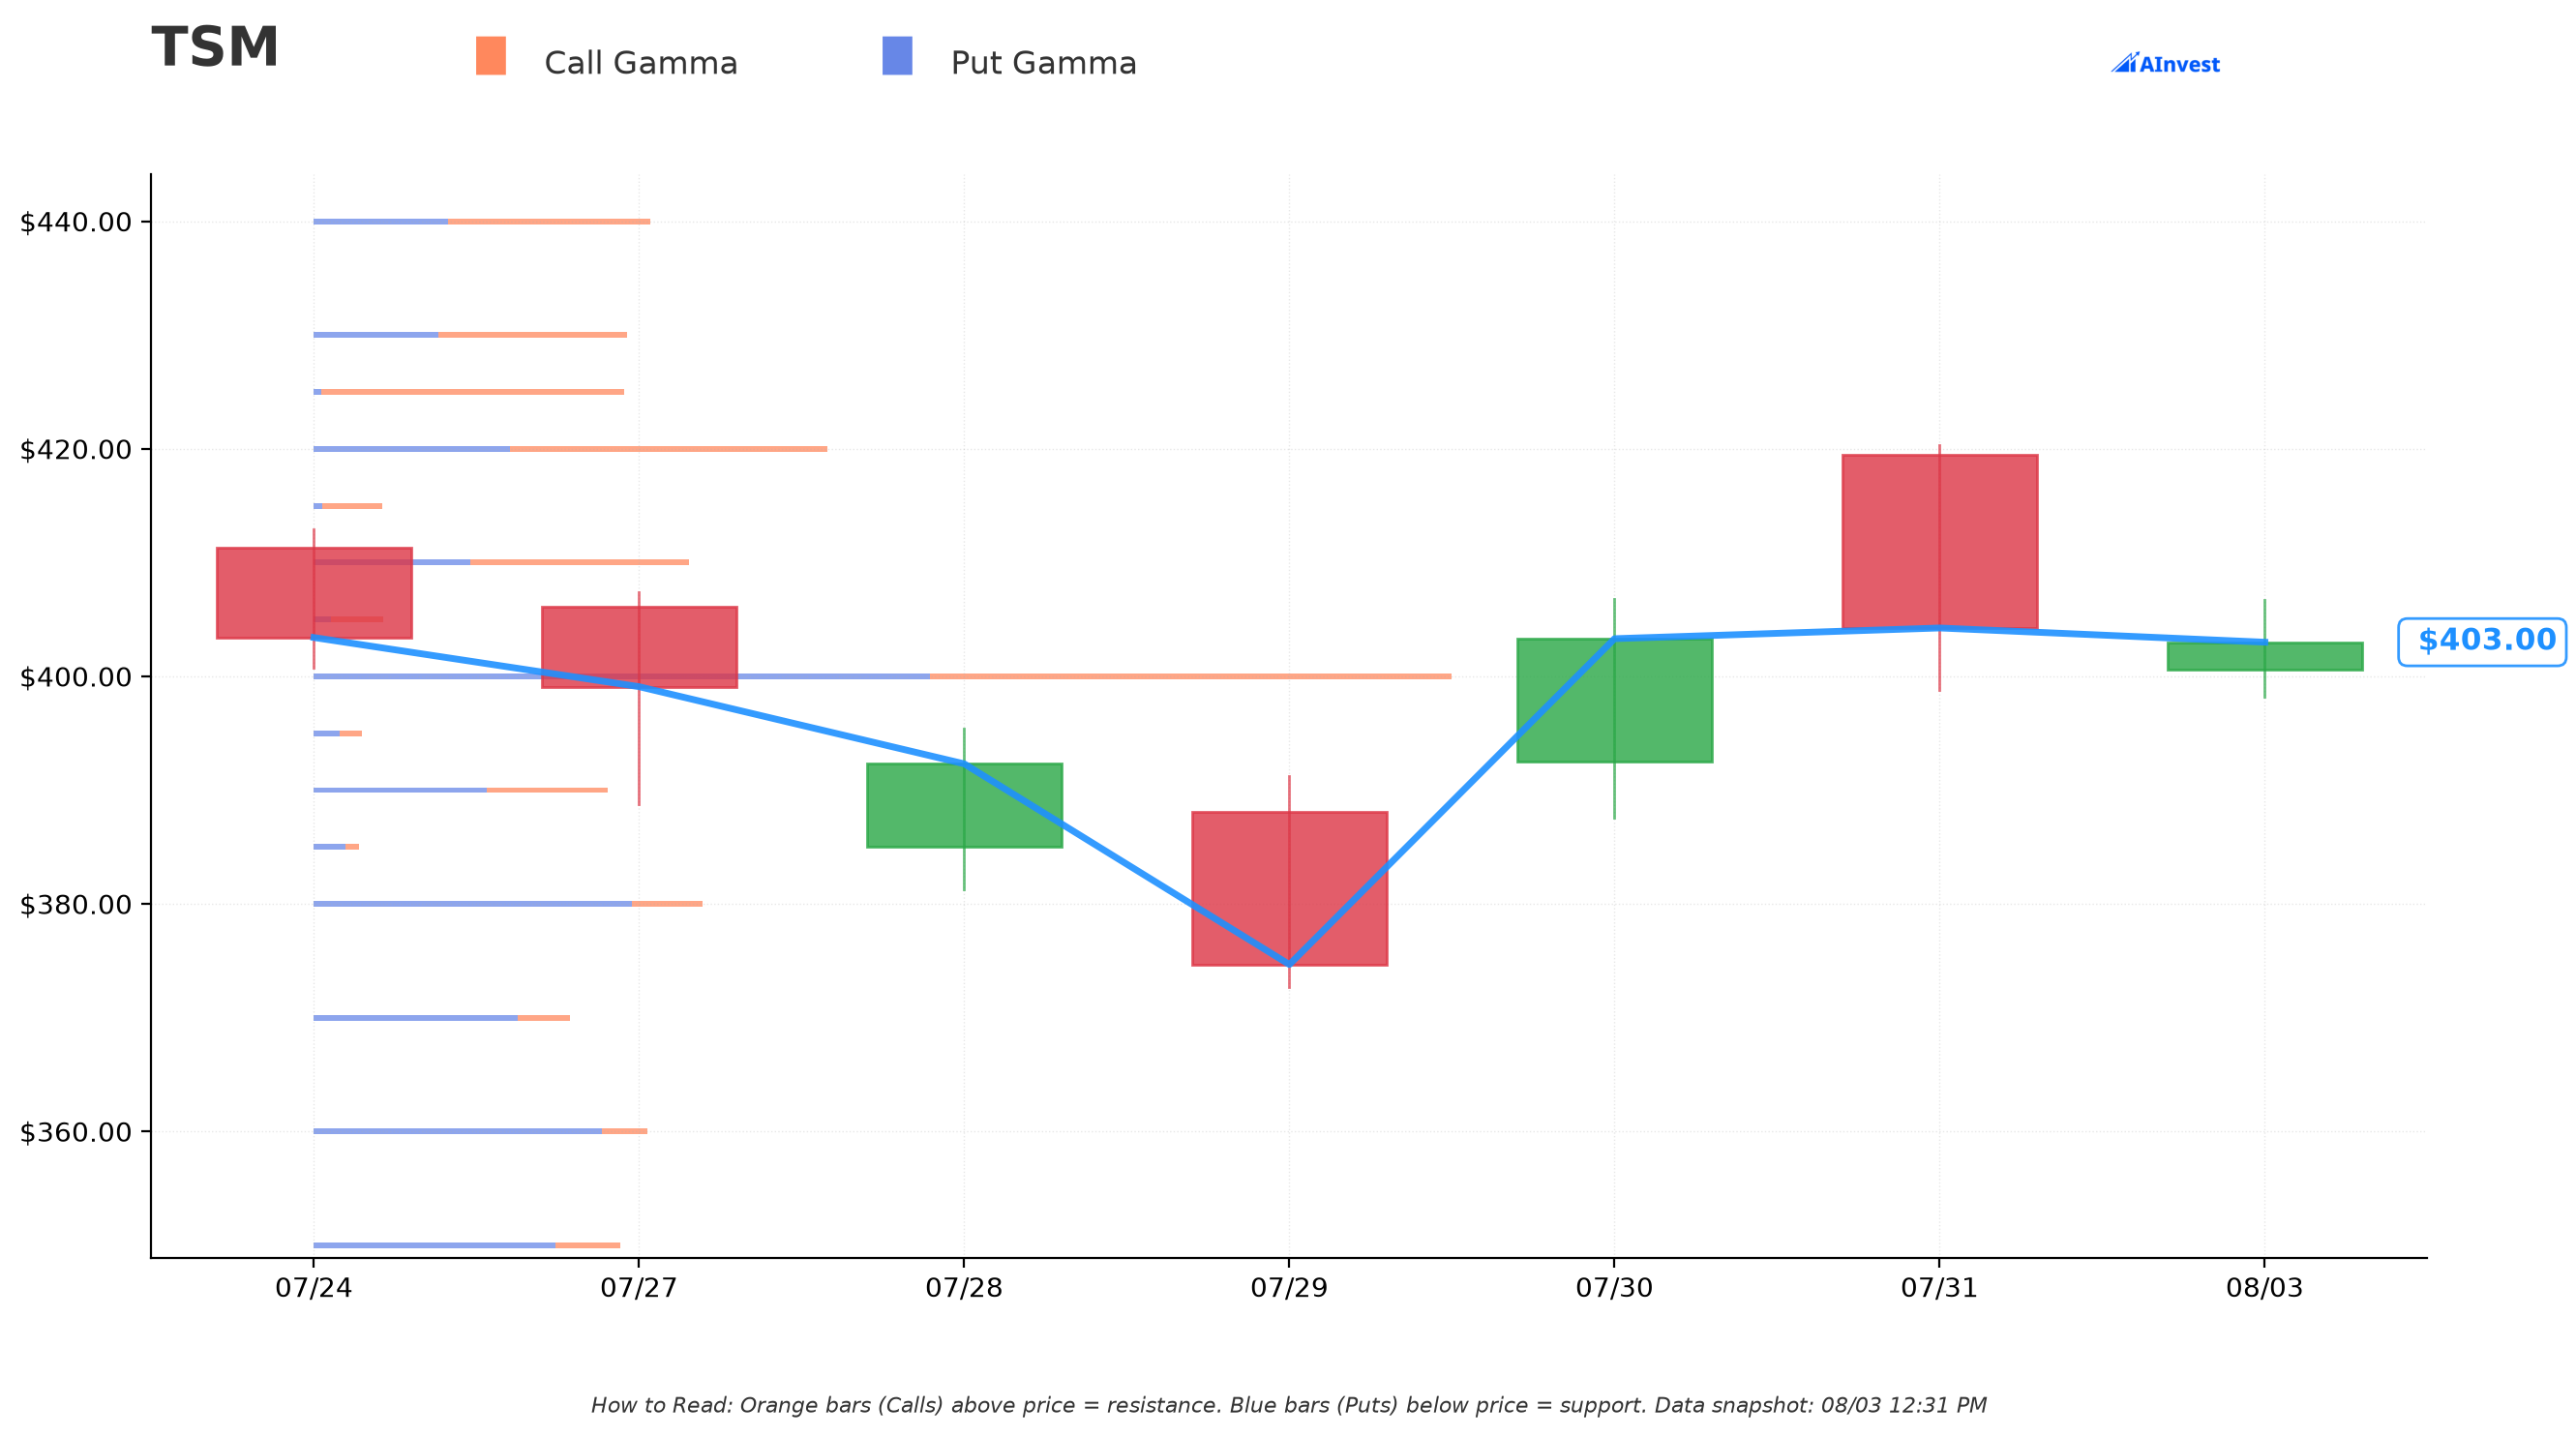
Current Price: ≈$403.00
- 🔵 $400 — Very Strong support wall (34.05B total gamma exposure, just 0.7% below spot). This is essentially the pin level right now — dealers have enormous positioning exactly where Trade 1's short call is struck.
- 🔵 $390 — Strong support (8.80B gamma, ≈3.2% below)
- 🔵 $380 — Very Strong support (11.70B gamma, ≈5.7% below)
- 🟠 $410 — Very Strong resistance (11.22B gamma, ≈1.8% above spot)
- 🟠 $420 — Very Strong resistance (15.32B gamma, ≈4.2% above spot) — this is the exact strike Trade 2 bought. The lit call buyer isn't just picking a random OTM strike; $420 is a real, heavily-populated gamma wall. Dealers have meaningful positioning to defend or amplify a move into that level by Friday.
- 🟠 $430 — Strong resistance (9.35B gamma, ≈6.7% above)
In plain terms: TSM is sitting almost exactly on top of its biggest gamma level. Dealers tend to pin price near a level like this, which argues for a grindy, range-bound tape near $400 — making Trade 2's push toward $420 by Friday a real test of whether the stock can break through dealer hedging flows in just four sessions.
Implied Move
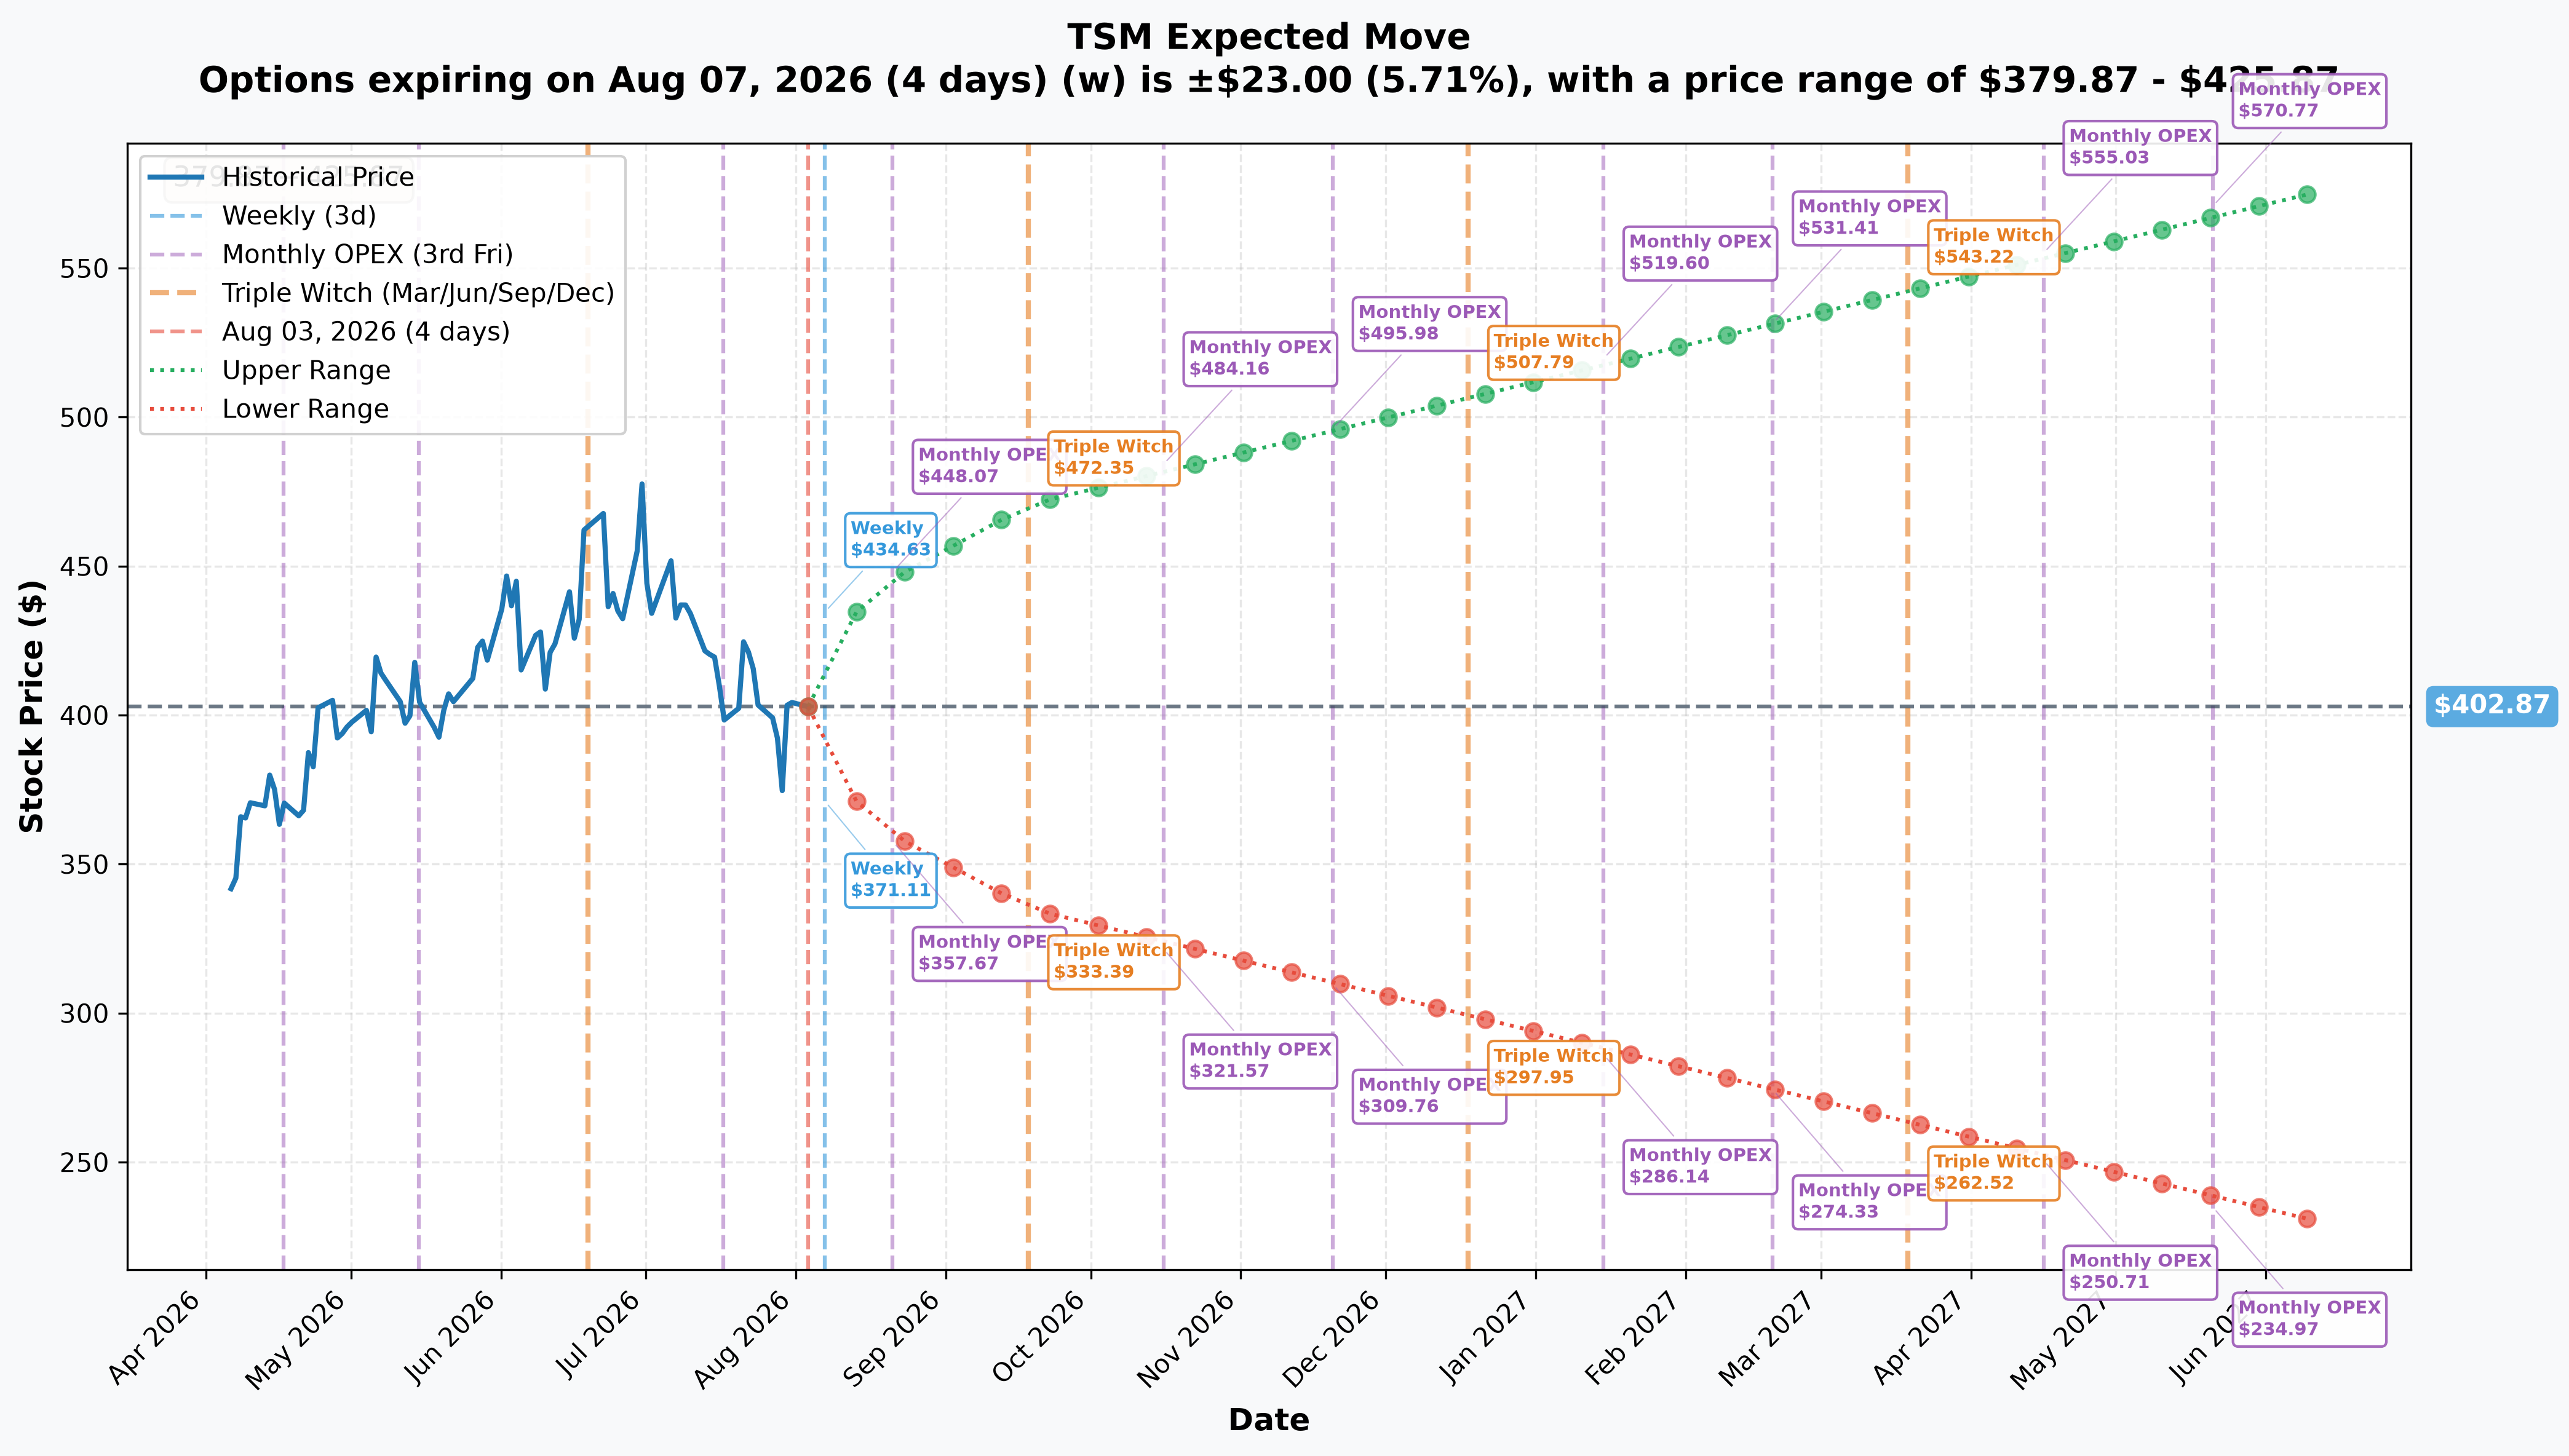
- Weekly (expires Aug-07, 4 days — Trade 2's expiry): ±5.71% / ±$23.00 → range $379.87 – $425.87
- Monthly OPEX (Aug-21, 18 days): ±10.79% / ±$43.45 → range $359.42 – $446.32
- Quarterly / Triple Witch (Sep-18, 46 days — Trade 1's expiry): ±16.86% / ±$67.91 → range $334.96 – $470.78
- LEAPS (Jun-17-2027, 318 days): ±43.44% / ±$174.99 → range $227.88 – $577.86
Does the implied move even reach $420 by Friday? Yes — barely. The options market's own pricing puts the upper edge of the "normal" weekly range at $425.87, which is above the $420 strike Trade 2 bought. So reaching $420 by Friday isn't an outlandish tail bet in volatility terms — it sits inside the market's own expected range. That said, "inside the implied move" is not the same as "likely." It still requires roughly a 4.3% move in four trading days, and the $420 gamma wall above is exactly the kind of level dealer hedging can slow a rally into. The $400 short-call strike, by contrast, is comfortably inside every single expiry's range shown — unsurprising, since it's right where the stock already sits.
🎪 Catalysts
⚠️ The Critical Expiry Mismatch
The August 7 expiry — where Trade 2's $420 call lives — contains zero scheduled TSMC-specific catalysts. The next hard-dated company event is the July 2026 monthly revenue release on Monday, August 10 — confirmed on TSMC's financial calendar — which lands one trading session AFTER the Aug-07 expiry settles. Anyone holding the $420 call into Friday is betting on macro/sector momentum (the kind of hyperscaler AI-capex headline that drove the July 30 +7.64% pop), not on any TSMC-specific news, because there isn't any scheduled.
The September 18 expiry — where Trade 1's $400 call lives — by contrast, captures both the August 10 July-revenue release and the September 10 August-revenue release (also confirmed on the TSMC financial calendar), plus an expected mid-September ex-dividend increase and standard quarterly/triple-witching mechanics. It does not capture Q3 2026 earnings, expected ≈October 15 but not yet confirmed by TSMC.
✅ Already Happened (Last 3 Months)
- Q2 2026 earnings, July 16 — beat-and-raise, but the stock fell anyway. Record revenue of $40.20 billion, +36.0% YoY, gross margin 67.7% (above the guided 65.5%–67.5% range), and management simultaneously raised 2026 capex to $60–64 billion and raised full-year 2026 revenue growth guidance to "slightly above 40%" in USD terms, per the 2Q26 earnings call transcript. Despite that, the ADR fell −2.32% then −2.77% over the following two sessions (stockanalysis.com price history) — the market punished the margin-dilution warning, not the headline numbers.
- Margin dilution is the real story. Management explicitly quantified N2 (2nm) ramp dilution of −3 to −4 percentage points to gross margin in H2 2026, plus overseas fab dilution of −2 to −3pp widening over time, per the 2Q26 transcript. Q3 gross margin is guided down to a 66% midpoint from 67.7%.
- AI/HPC demand is now the whole company. HPC hit 66% of Q2 revenue, up 20% QoQ; CEO C.C. Wei said the supply-demand gap on ≤3nm capacity is "very big," bigger than the 30–50% range analysts had assumed (2Q26 transcript).
- Advanced packaging (CoWoS) is the binding constraint. Wei, verbatim: "our packaging capacity is so tight that it limits my customers' growth" (2Q26 transcript).
- Customer concentration flagged, dismissed by management. Asked directly whether top-5 customer exposure has become historically large, Wei responded "No, that's not our concern" (2Q26 transcript) — though with HPC at 66% of revenue, that's a real concentration regardless of management's framing.
- July 30 — "TSMC Stock Jumps 7% as Microsoft Revives AI-Chip Trade" (MarketBeat news feed) — the largest single up-day of the last 3 months, driven by an external hyperscaler headline rather than TSMC's own disclosures. This is precisely the kind of catalyst that can move TSM through the Aug-07 expiry, since there's no company-specific event scheduled.
- 2027 pricing action reported (not company-confirmed): trade press reports 5–10% base price increases plus a 10–15% HPC surcharge effective early 2027 (MarketBeat, July 24) — a potential offset to the margin dilution above, though TSMC itself has not published a schedule.
⏳ Upcoming
- August 10 (Mon) — July 2026 monthly revenue release, per the TSMC financial calendar. Falls just after the Aug-07 expiry; inside the Sep-18 expiry. First hard read on whether TSMC is tracking to its Q3 guide of $44.6–45.8B.
- September 10 (Thu) — August 2026 monthly revenue release, also inside the Sep-18 expiry.
- Mid-September — expected ADR ex-dividend, with the payout increasing as TSMC's 2026 dividend rises to NT$24/share (+33% YoY) confirmed on the 2Q26 transcript.
- Q3 2026 earnings — expected ≈October 15, NOT yet confirmed by TSMC — sits outside both the Aug-07 and Sep-18 expiries entirely.
👥 How Four Different Readers Should Think About This
🎰 YOLO Trader: Trade 2 is the one that's actually built for you — a cheap, defined-risk, lit, opening $420 call expiring Friday. But be honest with yourself: it needs roughly a 4.3% move in four trading days, right into a Very Strong gamma resistance wall at $420, with zero scheduled company catalyst to drive it. This is a volatility/momentum bet on the broader AI-chip trade, not a TSMC-specific thesis. Size it like a lottery ticket, because that's what the tape says it is.
📈 Swing Trader: Trade 1 is more your speed conceptually, but it's ambiguous today. If tomorrow's OI print shows the Sep-18 $400 calls opened fresh (OI up toward ≈26,661), that reads as institutional money betting TSM stalls near $400 through mid-September — worth watching for confirmation before doing anything. If OI falls instead, it was someone closing a long, and the signal evaporates. Don't front-run this one; wait for the OI resolution.
💰 Premium Collector: The at-the-money $400 call sale for $28.00 (≈7% of spot) is the interesting structure here — if it's confirmed as a fresh short next-day, it's a textbook large-scale covered-call-style income trade at the current price. You could study the strike/premium ratio as a reference for your own $400-area TSM call sales, but don't copy the trade itself before the open/close question resolves.
🌱 Beginner: The most important lesson from today's TSM flow: two trades on the same stock, printed 15 minutes apart, can mean completely opposite things. A block cross (known counterparty, negotiated price) and a lit sweep (real market aggression) are not the same kind of signal, even when both show up as "options flow." Before you ever copy an options trade, ask: was it lit or negotiated, did it open or close, and does the size actually exceed existing open interest? If you can't answer those, you don't have enough information yet — which, honestly, describes half of today's TSM flow.
⚠️ Risk Factors & Honest Limits
- We do not know if Trade 1 opened or closed. 5,000 contracts against 21,661 prior open interest is genuinely unprovable from today's tape. Anyone telling you with confidence that this is a new bearish/neutral bet is over-asserting. Wait for tomorrow's OI.
- Trade 2 is confirmed opening, but that only tells you positioning, not outcome. A 4-day, 4.6%-OTM call is a real bet that can go to zero. The lit, at-the-offer execution proves someone wanted it badly enough to pay the ask — it does not prove they're right.
- These may be two unrelated participants. We have not found any equity hedge or paired structure linking the two trades. Treat them as independent data points, not a coordinated position.
- What the tape cannot tell us at all: the identity of either trader, whether either position is part of a larger portfolio hedge, the broker or clearing firm involved, or whether Trade 1's seller already held the calls being sold. OPRA data proves execution mechanics — not motive.
- Margin/capex/FCF risk is real and ongoing regardless of today's flow. TSMC's own guidance shows gross margin peaking behind it (67.7% → 66% Q3 midpoint) with $60–64B of 2026 capex against $35.22B of trailing free cash flow (per stockanalysis.com statistics) — a structural headwind independent of any single day's options print.
- Positioning is one-sided among analysts — zero sell ratings across the retrieved coverage, with the lowest published price target still above spot (stockanalysis.com forecast, MarketBeat). A crowded consensus is itself a contrarian risk worth weighing.
- Realized volatility is elevated right now (−4.50% then +7.64% on consecutive sessions in late July) — options priced off that recent volatility will look expensive relative to TSM's flatter 3-month net change. Both trades here are exposed to that vol regime.
Disclaimer: Options trading involves substantial risk of loss and is not suitable for all investors. This analysis is for educational purposes only and is not financial advice. Past performance does not guarantee future results. Neither trade discussed here has a confirmed motive, and the Sep-18 $400 call's open/close status is genuinely unresolved as of this writing — treat all directional framing as provisional until the next-day OI snapshot confirms it. Always do your own research and consider consulting a licensed financial advisor before trading.
Last updated: August 4, 2026 — next-day OPRA open-interest resolution added (✅ RESOLVED box above). Original analysis published August 3, 2026.