🐋 TSM $30.2M Net Credit — Not a New Bear Bet: Both Packages Were Existing Positions Being Unwound
2026-08-04 | Unusual Activity Detected 🔄 Last updated: 2026-08-05 — the next-day OI snapshot inverted the read on Package 2. See the ✅ RESOLVED box below.
The Quick Take
Taiwan Semiconductor's options tape printed two unrelated packages on August 4 totaling $30,168,750 in net premium collected, both structured as sales of upside calls rather than purchases. The next-day open-interest snapshot has now resolved all three legs, and it changed the story on the second package.
The first — another 5,000-lot sale of the September $400 call — lines up almost exactly with Monday's trade, and it confirmed as a close: open interest fell 5,078, essentially the full print. The second was written up as a freshly opened bear call spread with $11.87M of credit against a $44.4M maximum loss. Open interest fell on both of its legs too — which is the opposite of what opening a spread does. That package was not a new bearish position at all: it was an existing Aug-21 $425/$475 bull call spread being closed out, roughly 5,000–6,000 contracts of it.
Read the day correctly: this was a desk taking risk off, not a desk putting a bearish bet on. The "$44.4M tail risk" framing below is corrected accordingly.
Company Overview
Taiwan Semiconductor Manufacturing Company (NYSE: TSM) is the world's largest pure-play semiconductor foundry — it manufactures chips designed by other companies rather than selling its own branded products. TSMC operates in the Information Technology sector, Semiconductors industry, and reported $139.57B in trailing-twelve-month revenue with a 49.9% net margin. Market capitalization stands at ≈$1.85 trillion. Roughly two-thirds of TSMC's revenue now comes from High-Performance Computing (AI accelerators, CPUs, GPUs), a share that grew 20% quarter-over-quarter in Q2 2026.
💰 The Option Flow Breakdown — Two Separate Packages
📊 Package 1 — 10:19:37 ET: Another Sale of the Sep-18 $400 Call
| Field | Value |
|---|---|
| Time | 10:19:37 ET |
| Buy/Sell | SELL |
| Call/Put | CALL |
| Expiration | 2026-09-18 |
| Strike | $400 |
| Size | 5,000 contracts |
| Volume (day) | 5,100 |
| Prior OI | 16,725 |
| Spot at print | $414.84 |
| Option price | $36.60 |
| Premium | $18,300,000 |
| Option symbol | TSM20260918C400 |
| Delta | 0.6341 |
| Mechanism | 🤝 Block cross (single-leg cross) |
📊 Package 2 — 10:32:33 ET: Bear Call Spread, Aug-21 $425/$475
| Field | Leg 1 (SELL $425C) | Leg 2 (BUY $475C) |
|---|---|---|
| Time | 10:32:33 ET | 10:32:33 ET |
| Buy/Sell | SELL | BUY |
| Call/Put | CALL | CALL |
| Expiration | 2026-08-21 | 2026-08-21 |
| Strike | $425 | $475 |
| Size | 11,250 contracts | 11,250 contracts |
| Volume (day) | 11,000 | 11,000 |
| Prior OI | 11,575 | 12,289 |
| Spot at print | $414.47 | $414.47 |
| Option price | $12.90 | $2.35 |
| Premium | $14,512,500 | $2,643,750 |
| Option symbol | TSM20260821C425 | TSM20260821C475 |
| Mechanism | 🤝 Multi-leg floor trade | 🤝 Multi-leg floor trade |
Package 2 net credit: $11,868,750. Both legs printed the same second as one worked structure on the exchange floor — this is a negotiated block with a known counterparty, not two separate lit trades.
Combined total across both packages: $30,168,750 net credit. Package net delta: ≈−684,588 shares (roughly $284M of short-delta exposure at today's $415 spot) — a bearish-leaning tilt from the position as a whole. The $400 call sale alone accounts for about −317,050 shares of that (5,000 contracts × 100 × 0.6341 delta); backing that out leaves the bear call spread contributing roughly −367,538 shares of net short delta, which makes sense — the short $425 strike sits much closer to the money than the long $475 strike, so it carries more delta.
🔄 ✅ RESOLVED — All Three Legs Closed. The "New Bear Call Spread" Read Is Refuted.
Updated 2026-08-05 pre-market. The ≈06:30 ET OPRA open-interest snapshot (reflecting the August 4 close) has published, and it went against the article's inference on Package 2.
| Leg | Baseline OI (Aug-4 snap) | Resolving OI (Aug-5 snap) | Δ | Print size | Day volume | Verdict |
|---|---|---|---|---|---|---|
| Sep-18-2026 $400 C (sold) | 16,725 | 11,647 | −5,078 | 5,000 | 5,198 | ✅ CLOSE (STC) — as expected |
| Aug-21-2026 $425 C (sold) | 11,575 | 6,553 | −5,022 | 11,250 | 11,434 | 🔄 CLOSE (STC) — INVERSION |
| Aug-21-2026 $475 C (bought) | 12,289 | 6,271 | −6,018 | 11,250 | 11,379 | 🔄 CLOSE (BTC) — INVERSION |
Package 1 — confirmed exactly as read. Open interest at the September $400 strike fell 5,078 against a 5,000-lot print, with almost no other volume at the strike (day volume 5,198). That is as clean as this test gets: the sale closed an existing long call position. It was the third such close in the same strike this week — Monday's trade took OI from 21,661 to 16,725, and this one took it to 11,647. A position is being methodically dismantled, not a bearish view being expressed.
Package 2 — this is the inversion. The article inferred that both legs of the Aug-21 $425/$475 structure would open together, because that's what establishing a spread looks like. Open interest fell on both legs instead — 5,022 contracts destroyed at the $425 strike, 6,018 at the $475. Only ≈180 and ≈130 contracts of non-package volume traded at those strikes all day, so the package itself is unambiguously responsible for the decline.
Work backwards from that and the pre-existing position is forced: selling the $425 call closed a long; buying the $475 call closed a short. Long the lower strike, short the higher strike, same expiry — that is a bull call spread. This desk was not opening a bearish structure. It was closing an existing bullish one, and collecting $11.87M in the process.
Magnitude: roughly 5,000–6,000 contracts of the 11,250-lot provably unwound (the remainder paired against opening counterparties, which nets to zero OI change and can't be attributed either way). So call it about half the print, definitively closing.
What this corrects, plainly:
- ❌ The $44,381,250 "maximum loss" figure does not describe a risk anyone newly took on today. No fresh 11,250-contract short spread was created. That number described a hypothetical new position; the actual trade was retiring exposure, not adding it.
- ❌ The package net delta of ≈−684,588 shares is not a bearish tilt being established. It is the removal of long delta from an existing book — the mirror image of what a new short position would mean.
- ✅ What holds: the mechanism (negotiated floor/cross blocks, known counterparty, no lit aggression), the premium figures, the strike geometry, and the gamma/implied-move levels are all unchanged and still useful.
The honest lesson. The article's reasoning — "spreads are typically established, not partially closed, in one worked print" — is a sound prior that was simply wrong here. Both legs sat at size ≤ prior open interest, which is exactly the condition under which we say a read is provisional and wait for the next-day number. This is what waiting for it is for.
🤓 What This Actually Means — Plain English
Package 1 — a confirmed STC (Sell-to-Close), not a new bearish bet. Selling a call can mean two very different things. If it's STO (Sell-to-Open), someone is establishing a brand-new short call — a bet that TSM stays below $400, or a covered-call income trade against existing shares. If it's STC (Sell-to-Close), someone who already owned this call is simply taking profit and walking away — it says nothing about their view on where TSM goes next.
The next-day open-interest snapshot confirmed the second one: OI at the September $400 strike fell 5,078 against the 5,000-lot print. This exact sale had happened once before, on Monday, and that trade also resolved as a close (OI 21,661 → 16,725); this one carried it to 11,647. A long call position is being worked off in pieces — that is now proven, not inferred.
Package 2 — NOT a new bear call spread. An existing bull call spread being closed. This is the part the next-day OI snapshot inverted, so read the corrected version rather than the original inference.
Selling a $425 call and buying a $475 call at the same time looks like a bear call spread on paper — collect premium up front, cap your gain at the credit, and carry a maximum loss of the $50 strike gap minus that credit: ($50 − $10.55) × 11,250 × 100 = $44,381,250. That is a real and important calculation for anyone opening such a spread. It is not what happened here.
Open interest fell on both legs, which only happens when both sides of the trade are closing. That forces the pre-existing position to have been long the $425 call and short the $475 call — a bull call spread — and today's print took roughly 5,000–6,000 contracts of it off. So the $44.4M figure describes a risk that was retired, not created. Nobody put on $44.4M of new tail exposure on August 4; somebody walked away from a bullish position and collected $11.87M doing it.
Why this distinction is worth the paragraph. "Desk opens $44M-tail bearish spread on TSM" and "desk closes out its bullish TSM spread" are opposite signals built from the identical trade print. The only thing that separates them is the next morning's open-interest number — which is exactly why every leg where size sits at or below prior open interest gets flagged provisional until that number lands.
📈 Technical Setup
YTD Chart
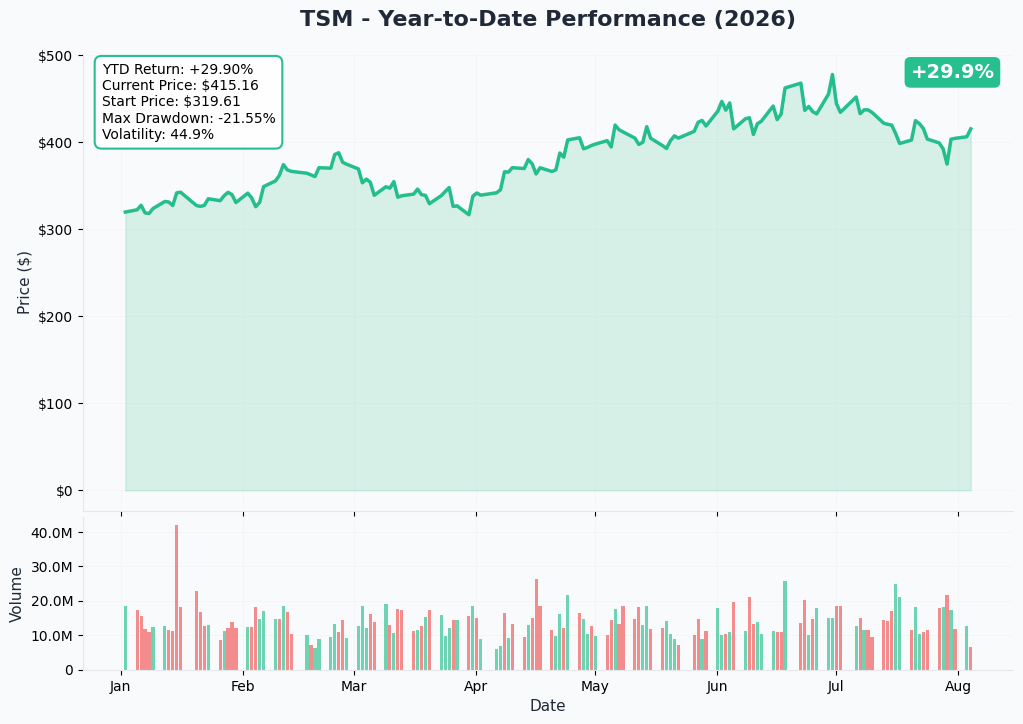
TSM is +29.9% over the past year, but the path has not been smooth. The stock printed a 52-week high of $479.00 at the end of June and then fell 15.3% in July — its worst month of the past year — even as sell-side analysts raised targets across the board. Spot today (≈$415-418) sits below the 50-day moving average ($425.60) but well above the 200-day ($358.39): an intact long-term uptrend with broken short-term momentum.
Gamma-Based Support & Resistance
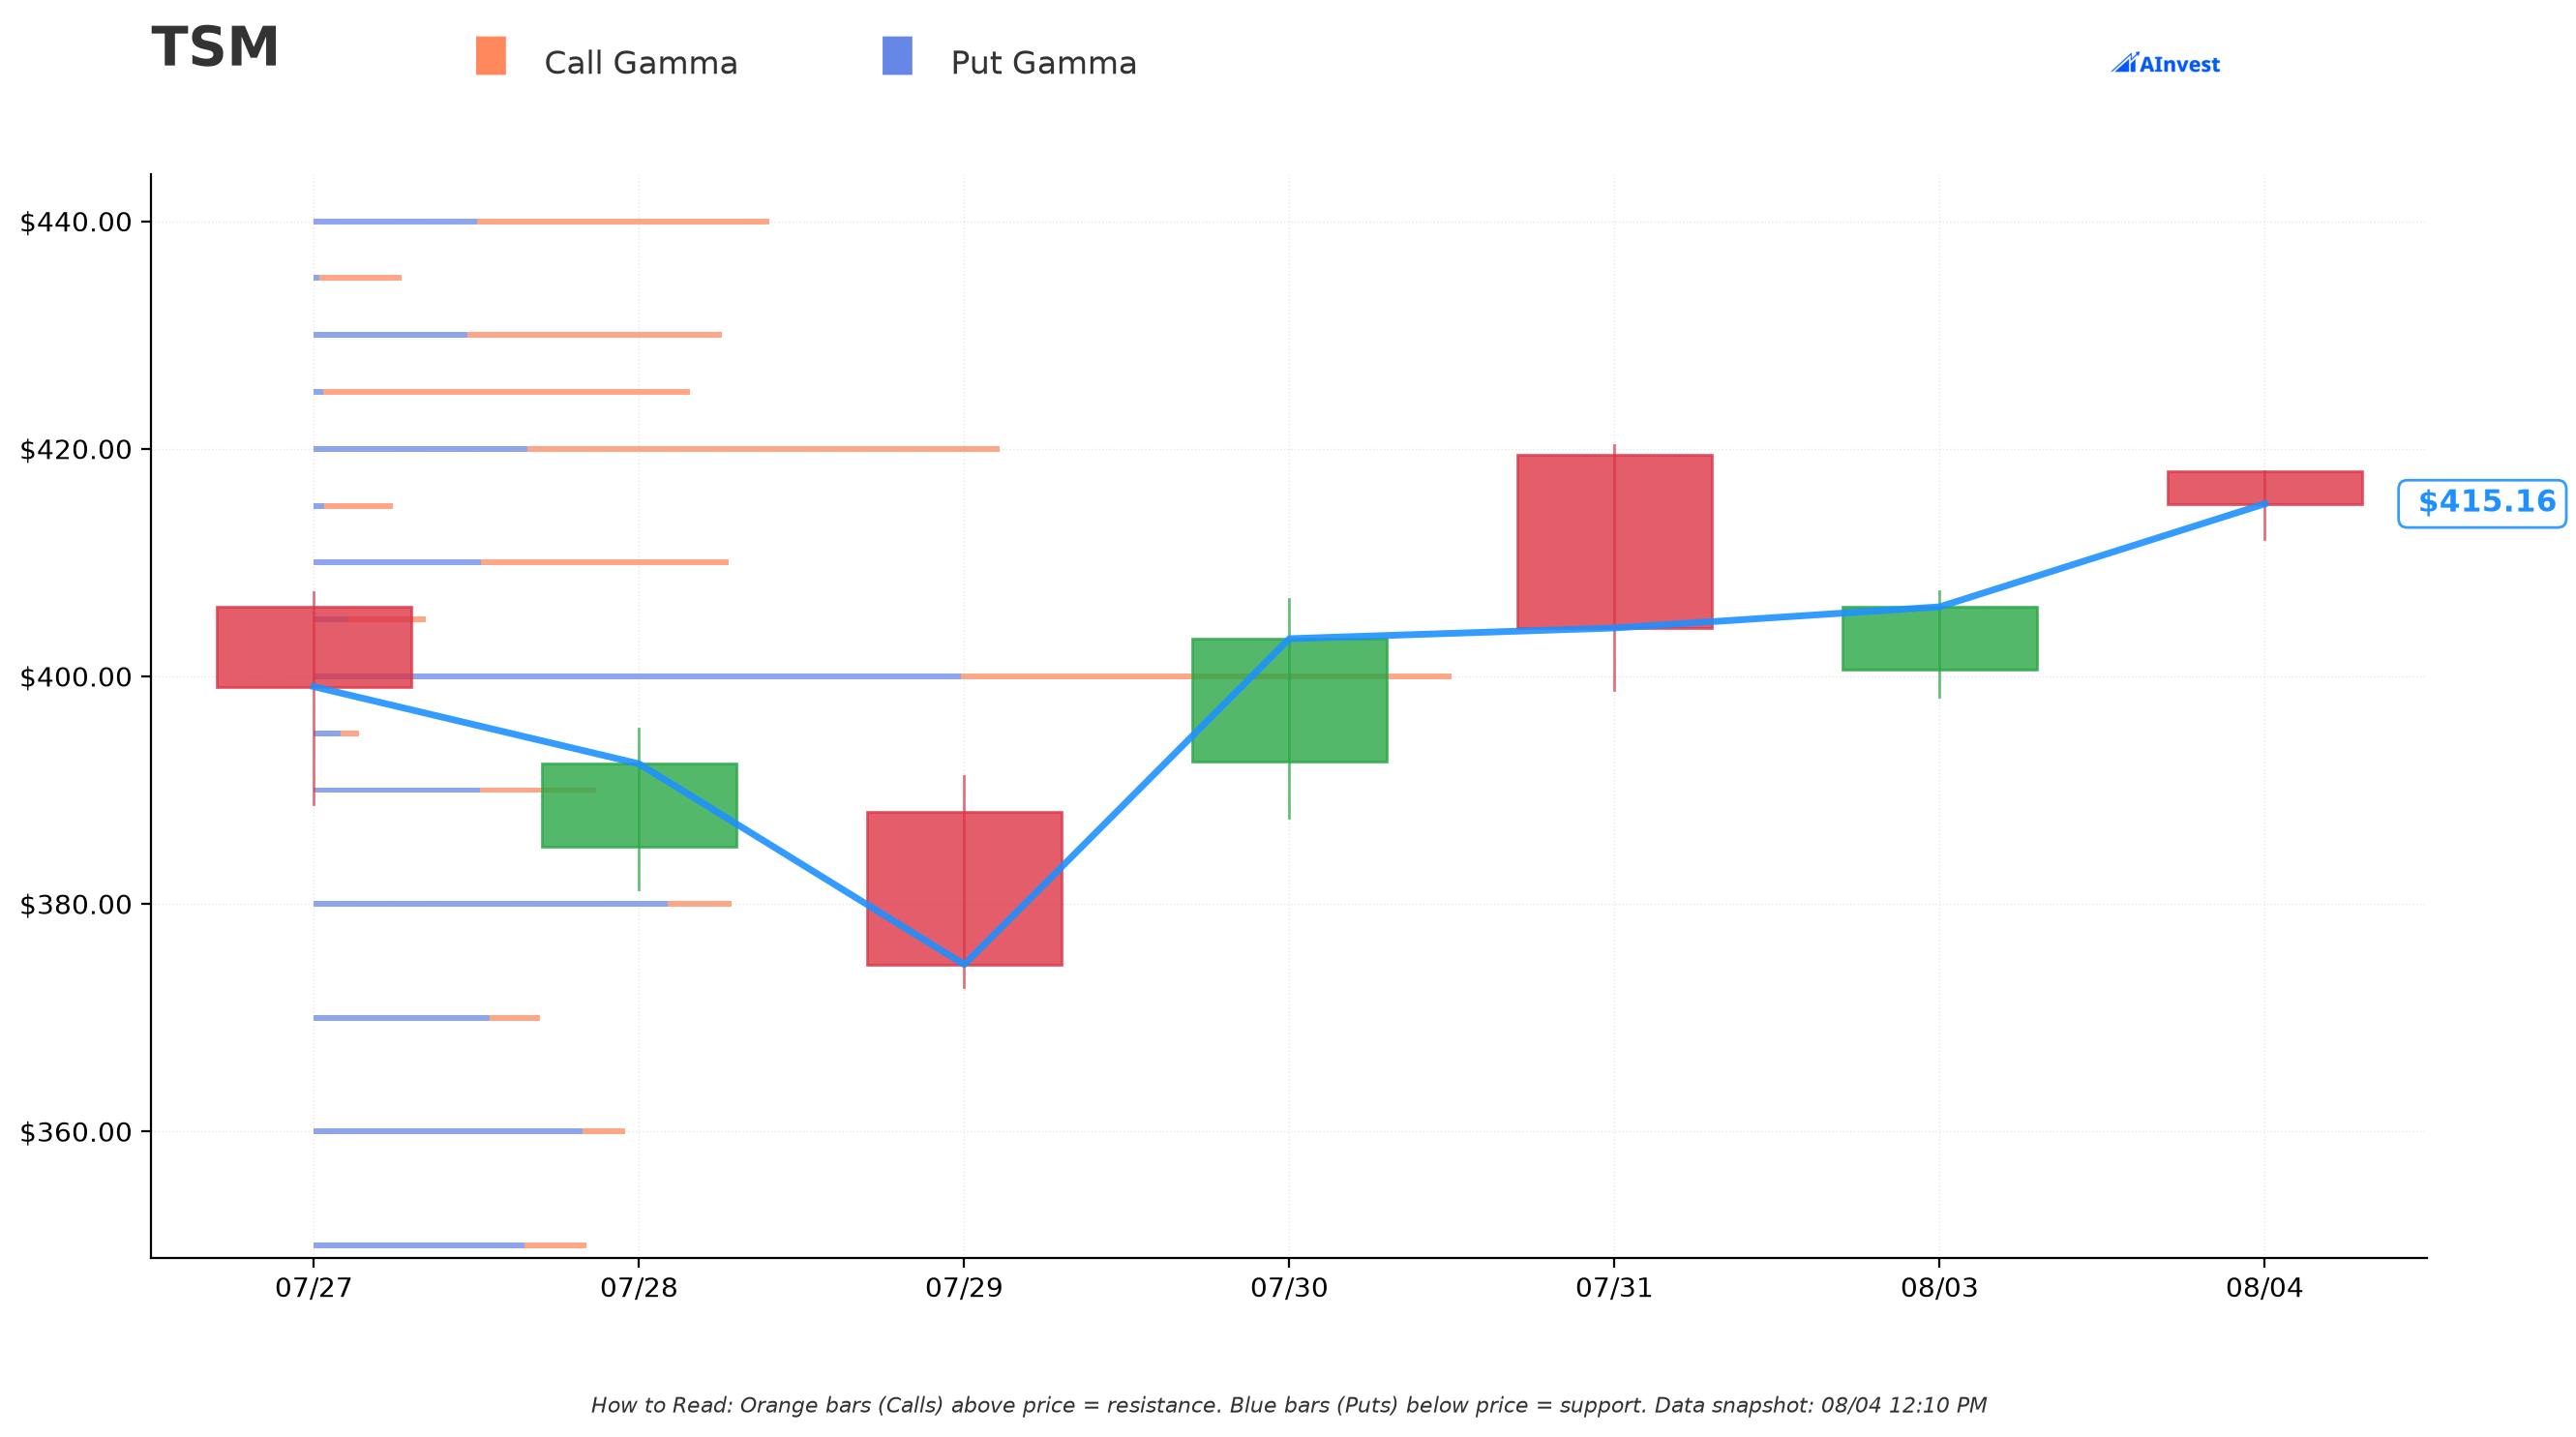
Reading the actual dealer gamma positioning (current price $415.14 in this snapshot):
Resistance above spot:
- $420 — Very Strong resistance wall, net gamma +7.39, just 1.2% above spot
- $425 — the strongest single-strike concentration on the board, net gamma +10.17, almost entirely call gamma (call gex 10.44 vs put gex only 0.27). This is exactly where the bear call spread sold its short leg. Dealers are already heavily positioned around $425, which reinforces it as a level where upside can stall.
- $430 — net gamma +2.85
- $440 — net gamma +3.66
- $450 — net gamma +8.02, another Very Strong wall
Support below spot:
- $410 — Very Strong, 1.2% below spot, net gamma +2.29
- $400 — the largest total gamma concentration in the chain (32.4), split between calls (13.99) and puts (18.43). This is exactly the strike the $400 call sale targeted. A heavy two-sided strike like this tends to act as a magnet/support zone into expiration.
- $390 / $380 / $360 / $350 — successively weaker support walls further down
The takeaway: both trades today sold calls at strikes ($400 and $425) that already carry some of the heaviest dealer gamma concentration on the board. That's not necessarily meaningful for direction, but it does mean these levels already matter to market-maker hedging flows independent of today's trade.
Implied Move
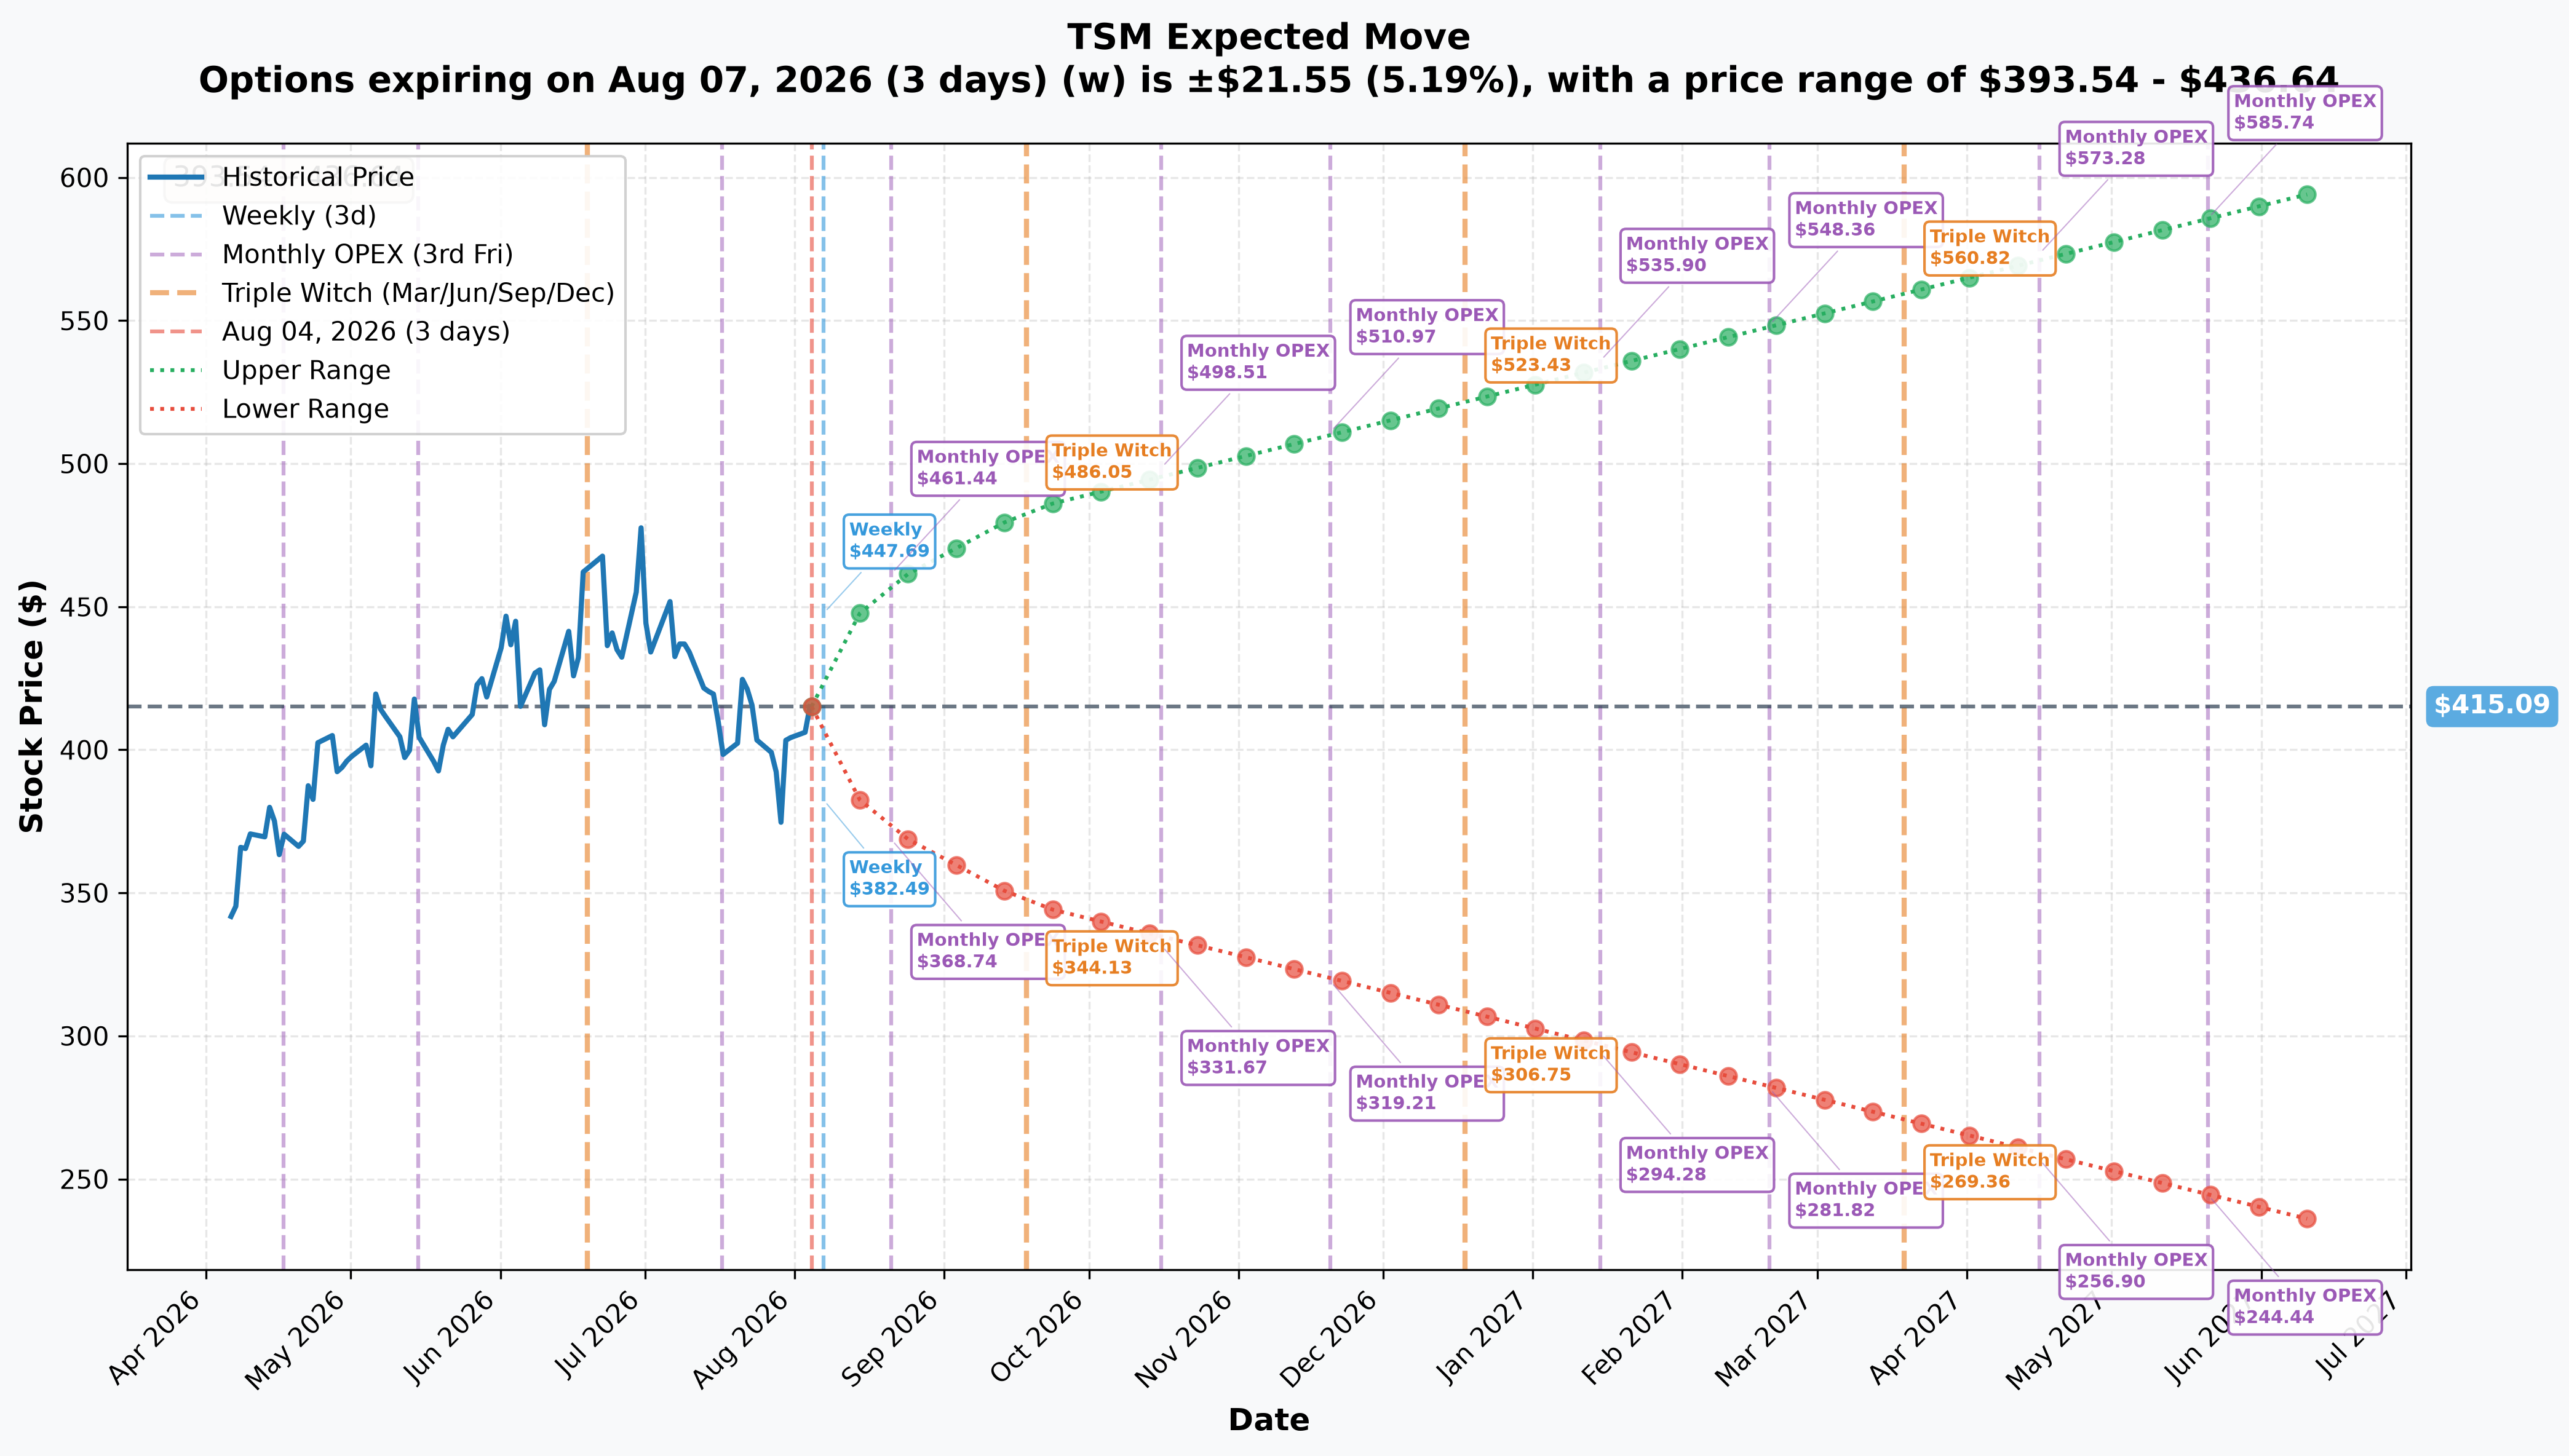
Reading the options market's own pricing of expected movement (spot $415.09):
| Expiry | Days | Implied Move | Range |
|---|---|---|---|
| Weekly (Aug 7) | 3 | ±5.19% (±$21.55) | $393.54 – $436.64 |
| Monthly OPEX (Aug 21) — Package 2's expiry | 17 | ±10.52% (±$43.65) | $371.44 – $458.74 |
| Triple Witch (Sep 18) — Package 1's expiry | 45 | ±16.59% (±$68.88) | $346.21 – $483.97 |
| Yearly LEAPS (Jun 2027) | 317 | ±43.81% (±$181.87) | $233.22 – $596.96 |
The bear call spread's short strike, $425, sits comfortably inside the implied move range for its own expiration ($371.44–$458.74) — meaning the market is already pricing a real chance of TSM trading through it before Aug-21. Its long strike, $475, sits above the top of that same implied-move range — so the trade's full $44.4M loss scenario requires a move the options market currently treats as a tail event, not the base case. For the $400 call sale's expiration (Sep-18), the $400 strike sits well within a much wider $346–$484 range, underscoring how much room the stock has to move either direction over 45 days.
🎪 Catalysts
Already Happened
Q2 2026 blowout, but 8.2% of the EPS was a one-off gain (July 16, 2026). TSMC reported $40.20B in revenue, +33.7% year-over-year, with gross margin at 67.7%, beating consensus EPS of $3.82 by $0.49. But CFO Wendell Huang told analysts on the earnings call that NT$2.24 of the NT$27.25 EPS print — about 8.2%, roughly $0.35 per ADR — came from a mark-to-market/disposal gain on Vanguard International Semiconductor shares TSMC sold in May. Strip that out and the headline beat is meaningfully smaller than it looks.
Capex raised to $60-64B — the third raise in seven months. From $52-56B in January, to "closer to $56B" in April, to $60-64B on the July 16 call, driven by what management called "the newly emerging agentic AI market." CFO Huang went further: "the CapEx in the next three years will be even more significantly higher than the past three years."
Wafer prices raised on 7nm and below (July 2026). TSMC confirmed a price increase on 7nm-and-more-advanced processes, corroborated by TrendForce reporting Aug 4 that it's contributing to NVIDIA RTX 50-series price hikes in South Korea. A separately reported "up to 10%" magnitude is a media estimate, not a TSMC disclosure.
CoWoS packaging is the binding constraint on TSMC's own growth. CEO C.C. Wei on the Q2 call: "Our packaging capacity is so tight that now it limits my customers' growth." TSMC is directing 10-20% of its 2026 capex to advanced packaging and has a 10-year US packaging partnership with Amkor (announced June 16, no dollar figure disclosed).
Arizona commitment raised to $265B total. Announced on the Q2 call: an additional $100B for 2nm-and-below fabs plus advanced packaging — but management was explicit there's no firm schedule for that spending.
TSM fell 15.3% in July despite the guidance raise. Monthly close data shows TSM closing June at $477.57 and July at $404.25 — the worst month of the trailing year, even as sell-side firms raised price targets through the same window.
Still Ahead
July 2026 monthly revenue — estimated Monday, August 10 (window August 7-12). TSMC does not pre-announce this date. It's worth noting June's report slipped to July 13 even though Friday July 10 was a business day — the reliable window is the 8th through the 13th, not "the 10th." The August 21 expiration used in the bear call spread captures this release.
Q3 2026 earnings — estimated Thursday, October 15, but NOT company-confirmed. MarketBeat explicitly labels this date as estimated, and as of today TSMC's own investor relations events page still shows only the July 16 Q2 event. This event falls outside both of today's option expirations — neither the Aug-21 spread nor the Sep-18 call sale captures Q3 earnings.
Ex-dividend, September 16, 2026 — company-confirmed. TSMC's board approved a NT$7.00-per-share dividend with a confirmed ex-date of September 16, record date September 22, and distribution October 8. This lands inside the Sep-18 expiration used in the $400 call sale.
MarketBeat's Q3 EPS consensus of $2.98 is very likely stale. That figure sits below Q1 2026's actual $3.49 and far below Q2's $4.31 — despite TSMC guiding Q3 revenue to +12% quarter-over-quarter. If you see $2.98 quoted elsewhere as "the" Q3 estimate, treat it with real skepticism.
🎲 Reading the Setup by Trader Type
🚀 YOLO Trader
There's no lottery-ticket long premium here to chase, and after the OI resolution there's no new position to follow at all — both packages turned out to be existing positions being unwound. There is no desk on the other side of this expressing a fresh view you could piggyback on. If the cheap far-OTM $475 call interests you as a standalone idea ($2.35, well outside the Aug-21 implied-move range), evaluate it on its own merits — just don't tell yourself you're following smart money into it, because the smart money was selling its exposure here, not building it.
⚖️ Swing Trader
The $425 gamma wall lines up with where Package 2 sold its short call — worth watching as a real resistance zone into August 21, especially with the July revenue print (est. Aug 10) landing inside that window. If TSM struggles to clear $420-425 on the print, that's consistent with both the options positioning and the gamma structure. A break and hold above $425 would argue the wall is getting overwhelmed, not just tested.
🛡️ Premium Collector
The lesson here changed once the OI landed, and it's a better one. A bear call spread at these strikes would collect $11.87M against $44.4M of tail risk — roughly 1:3.7 reward-to-risk, with a breakeven at $435.55 (short strike plus net credit) on a name that has moved 15%+ in a single month twice in the past two months. That math is worth internalizing if you sell call spreads. But nobody actually put that trade on here — the print was an institution closing a bullish spread. The takeaway for an income trader isn't "a big desk likes this short-call structure"; it's that an identical-looking print can be an entry or an exit, and copying the shape without knowing which is how you end up short vol in a name someone else just decided to stop being long.
🔰 Beginner
Skip trying to trade off either of these prints directly — they're both large, negotiated block trades that retail-size accounts can't replicate the terms of. The useful lesson here is structural: a "sold call" headline can mean either a new bearish bet or someone closing an old position, and only the next-day open interest tells you which. This board is the proof. All three legs resolved as closes — including the pair we had written up as a freshly opened bear call spread. Same print, opposite meaning, and the only thing that separated them was one number published the next morning. That's the whole game.
⚠️ Risk Factors & Honest Limits
- Open/close is now proven for all three legs — and one package resolved against the original read. As first published, every number here was an inference from size-vs-prior-OI. The 2026-08-05 open-interest snapshot settled it: all three legs closed. Package 2's "new bear call spread" framing was wrong and has been corrected above. What the tape still cannot tell us is why the desk unwound, or what else it holds.
- The tape cannot see hedges. We don't know if the $400 call sale is covered by existing TSM shares, offset by other option positions, or part of a larger multi-account book. And note the corrected sign: the net delta of −684,588 shares is long exposure being removed from someone's book, not short exposure being added — so it does not imply the desk behind it is net short TSM.
- We don't know the counterparty, the broker, or the account's identity or motive. Both packages were negotiated blocks (cross and floor trade) with a known counterparty on the other side of each print — that's a fact from the tape. Why either side wanted the trade is not.
- TSM is a crowded, one-sided stock right now. Zero sell ratings across both major analyst panels, the lowest published target only ≈3.4% above spot, and short interest at just 0.69% of float. That means there's little short-covering buffer on the way down and little skepticism priced in on the way up — positioning risk cuts both ways.
- Gross margin has already peaked for a few quarters. Q3 guidance calls for margin down 1.7 points, with the 2nm ramp diluting margin by 3-4 points through the second half of 2026, on top of widening overseas-fab dilution. None of today's trades directly reference this, but it's relevant background for anyone holding TSM calls into Q3.
- No verified 2026 tariff development exists for TSM. Tariffs were not mentioned once by management or any analyst on the July 16 earnings call. Do not treat any tariff narrative around this stock as confirmed.
This article is for informational purposes only and does not constitute investment advice. Options trading involves substantial risk of loss and is not suitable for all investors. The trades described above are large institutional block prints; retail traders cannot replicate their exact terms, pricing, or margin treatment. Always verify open interest and current pricing before acting on any options strategy, and consider your own risk tolerance and account size before trading.