🐋 TSM $40M, Now Resolved: the $19.75M Call Cross Closed a Short — Only the $20.5M Risk Reversal Is a New Bullish Bet
📅 2026-08-05 | 🔥 Unusual Activity Detected
🔄 Updated 2026-08-06 pre-market — this article's lead has been corrected. The resolving OPRA open-interest snapshot is in, and it inverted our provisional read on Trade 1. The Sep-18 $400 call strike lost 3,936 contracts of open interest against a 5,000-lot buy — meaning that $19.75M was a buy-to-close of an existing short call, not a fresh bullish position. Trade 2, the risk reversal, did open. See the ✅ RESOLVED box below.
🎯 The Quick Take
Two separate trades hit Taiwan Semiconductor (TSM) on the tape on August 5 totaling $40.29 million in net premium paid — but the next-day open-interest print shows they were not the same kind of trade at all.
Trade 1 ($19.75M, Sep-18 $400 calls) was an exit, not an entry. Open interest at that strike fell by 3,936 contracts, confirming the buyer was closing a short call position it already had — and it is the fourth consecutive session that strike has been unwound. Buying back a short call does remove a cap on upside, so it is a bullish-leaning adjustment, but it is emphatically not a new $19.75M bet that TSM clears $400.
Trade 2 ($20.54M net debit) is the real new position — a risk reversal in which a trader sold downside puts to help pay for upside calls, betting TSM holds above roughly $400 through the August 21 expiration while accepting the obligation to buy shares at $380 if it doesn't. The next-day OI confirms it opened (the $400 call leg added 6,997 contracts, ≈70% of the print). Both of its strikes cluster right around $400, exactly where the options market's own dealer positioning shows the heaviest gamma in the chain.
🏢 Company Overview
Taiwan Semiconductor Manufacturing Company (TSM) is the world's largest dedicated semiconductor foundry — it makes chips for customers like Apple, Nvidia, and AMD rather than designing and selling its own. Headquartered in Hsinchu City, Taiwan and led by CEO C.C. Wei, TSM employs roughly 90,557 people, trades on the NYSE as an ADR, and sits in the Technology / Semiconductors sector with a $1.93 trillion market cap. Shares have run +74.17% over the past 52 weeks ($223.70–$479.00 range) and carry a Strong Buy consensus across 19 analysts with an average price target of $540.20 (+29.71% upside from spot).
💰 The Option Flow Breakdown
📊 What Just Happened
Both prints came in as block trades — negotiated off the lit order book with a known counterparty on the other side, not aggressive sweeps lifting offers. Trade 1 crossed as a single-leg block; both legs of Trade 2 printed as a multi-leg floor trade (the two legs paired together at the same timestamp, price, and size — textbook risk reversal execution).
| # | Time (ET) | Buy/Sell | Call/Put | Expiration | Strike | Size | Option Price | Premium | Day Volume | Prior OI | Spot | Delta | Option Symbol | Flow Type |
|---|---|---|---|---|---|---|---|---|---|---|---|---|---|---|
| 1 | 10:04:13 | BUY | CALL | 2026-09-18 | $400 | 5,000 | $39.50 | $19,750,000 | 6,084 | 11,647 → 7,711 ✅ BTC | $421.44 | ≈0.64 | TSM260918C00400000 | 🤝 BLOCK CROSS |
| 2a | 11:06:04 | SELL | PUT | 2026-08-21 | $380 | 10,000 | $3.93 | $3,930,000 (credit) | 12,262 | 25,095 → 27,142 ⚠️ partial STO | $414.16 | ≈−0.159 | TSM260821P00380000 | 🤝 MULTI-LEG FLOOR TRADE |
| 2b | 11:06:04 | BUY | CALL | 2026-08-21 | $400 | 10,000 | $24.47 | $24,470,000 (debit) | 10,113 | 18,052 → 25,049 ✅ BTO | $414.16 | ≈0.6842 | TSM260821C00400000 | 🤝 MULTI-LEG FLOOR TRADE |
Trade 2 net cost: $24,470,000 paid − $3,930,000 collected = $20,540,000 net debit for the risk reversal package.
Combined TSM premium on the day: $40,290,000 net debit. Note, however, that the next-day OI resolution (below) shows only Trade 2 established a new position — the ≈+479,250-share combined delta figure counts Trade 1's short-call cover as if it were fresh long exposure, which it is not. The new bullish delta from August 5 is Trade 2's risk reversal alone.
Links: TSM ticker page · Sep-18 $400 call · Aug-21 $380 put · Aug-21 $400 call
✅ RESOLVED — the Next-Day OI Print Is In, and It Split the Two Trades Apart
Updated 2026-08-06 pre-market. The ≈06:30 ET OPRA open-interest snapshot (reflecting the August 5 close) has published. All three legs are now settled — and Trade 1 resolved against our provisional read.
| Leg | Baseline OI (Aug-5 snap) | Resolving OI (Aug-6 snap) | Δ | Print size | Δ as % of print | Day vol | Verdict |
|---|---|---|---|---|---|---|---|
| Sep-18 $400 C (bought 5,000) | 11,647 | 7,711 | −3,936 | 5,000 | ≈−78.7% | 6,134 | 🔄 CLOSE (BTC) — INVERSION |
| Aug-21 $380 P (sold 10,000) | 25,095 | 27,142 | +2,047 | 10,000 | ≈+20.5% | 12,287 | ⚠️ PARTIAL OPEN (STO ≈20%) |
| Aug-21 $400 C (bought 10,000) | 18,052 | 25,049 | +6,997 | 10,000 | ≈+70.0% | 10,130 | ✅ OPEN (BTO ≈70%) |
Leg 1 — the inversion. We published the two possible outcomes: OI rising toward ≈16,647 would mean opening; falling toward ≈6,647 would mean closing. It fell, to 7,711 — squarely the closing case. So the $19.75M did not buy new upside; it bought back an existing short call. The multi-day context makes this unmistakable: that strike's open interest has fallen four sessions in a row — 21,661 → 16,725 → 11,647 → 7,711 — a steady ≈4,000-to-5,000-contract-per-session unwind, of which August 5's print is one tranche. This is a desk retiring an obligation on a schedule, not a desk placing a bet.
Legs 2a/2b — the risk reversal did open, partially. The $400 call added 6,997 contracts on a 10,000 print (≈70%), so the bullish leg is genuinely new. The $380 put added only 2,047 (≈20%), meaning roughly four-fifths of that put sale was matched against open interest that already existed — a transfer between holders rather than fresh short-put supply. The structure is real and opening; its short-put side is smaller in new-position terms than the headline 10,000 implies.
What did not change: the premium figures, the strikes, and the fact that both prints were negotiated blocks. What changed is which of the two is a position and which is an exit.
🤓 What This Actually Means — Plain English
Trade 1 is an exit — and this is the part we got wrong on the day. Someone paid $19.75M for 5,000 September $400 calls, already in-the-money with TSM at $421.44 (delta ≈0.64). On the tape that looks like a bullish purchase. The next-day open interest says otherwise: the strike shrank by 3,936 contracts, which only happens when the buyer is closing rather than opening — it was a buy-to-close (BTC) of a short call the desk was already carrying.
Here's the plain-English version of what that means. If you have sold a call, you have taken money up front in exchange for an obligation: if the stock rises above the strike, you owe the difference. TSM at $421 is $21 above the $400 strike, so that obligation had already turned expensive. Paying $39.50 per contract to buy the call back is how you make the obligation go away — you are cutting a losing short, not starting a winning long. It removes a ceiling on the desk's upside, so it leans mildly bullish in effect, but it creates no new bullish exposure and there is no "$439.50 breakeven" to track, because there is no long position. The four-session unwind pattern at that strike (21,661 → 16,725 → 11,647 → 7,711) says this is a scheduled reduction, not a view being expressed.
Trade 2 is a risk reversal, and it's worth slowing down on because it's a different animal than "buying calls." A risk reversal means:
- Sell an out-of-the-money put (here, the $380 strike, below spot) to collect premium.
- Use that premium to help pay for an out-of-the-money call (here, the $400 strike, above spot).
Think of it like this: the trader is saying "I don't want to pay full price for upside exposure, so I'll fund part of it by promising to buy TSM stock at $380 if it falls that far." That's why the put sale isn't "bearish" — collecting premium on a put you're comfortable getting assigned on is a bullish-to-neutral stance, not a bet on TSM falling. The net effect replicates being long the stock above $400, with a defined floor obligation at $380, for a fraction of the cost of buying 1 million shares outright (10,000 contracts × 100 shares = a 1-million-share-equivalent package).
Both legs are now confirmed opening (the $400 call by ≈70% of its print, the $380 put by ≈20%), so the risk-reversal math below stands:
- Below $380 at Aug 21 expiration: the trader is likely assigned stock at $380, effectively lowering the cost basis to ≈$376.07 ($380 strike − $3.93 credit collected).
- Between $380 and $400: both options expire worthless; the trader keeps the $3.93 credit as a small consolation on an otherwise "wrong" bet, still down the $20.54M-minus-credit spent on the position's optionality.
- Above $400: the call goes in the money and gains dollar-for-dollar with the stock past a breakeven of roughly $420.54 (call strike $400 + net premium paid of ≈$20.54 per share across the combined package).
Bottom line in plain English: Trade 2 is a leveraged, stock-replacement bullish bet, financed by giving up downside protection rather than paying full price for it — not a hedge, and not a bearish signal from the put sale. It is now the only genuinely new directional position of the day at TSM. Trade 1 sits in a different category entirely: an obligation being retired, not a bet being placed. Netting the two into one "$40M bullish combo," as the day-of read did, overstates the bullish commitment by roughly half.
📈 Technical Setup / Chart Check-Up
YTD chart
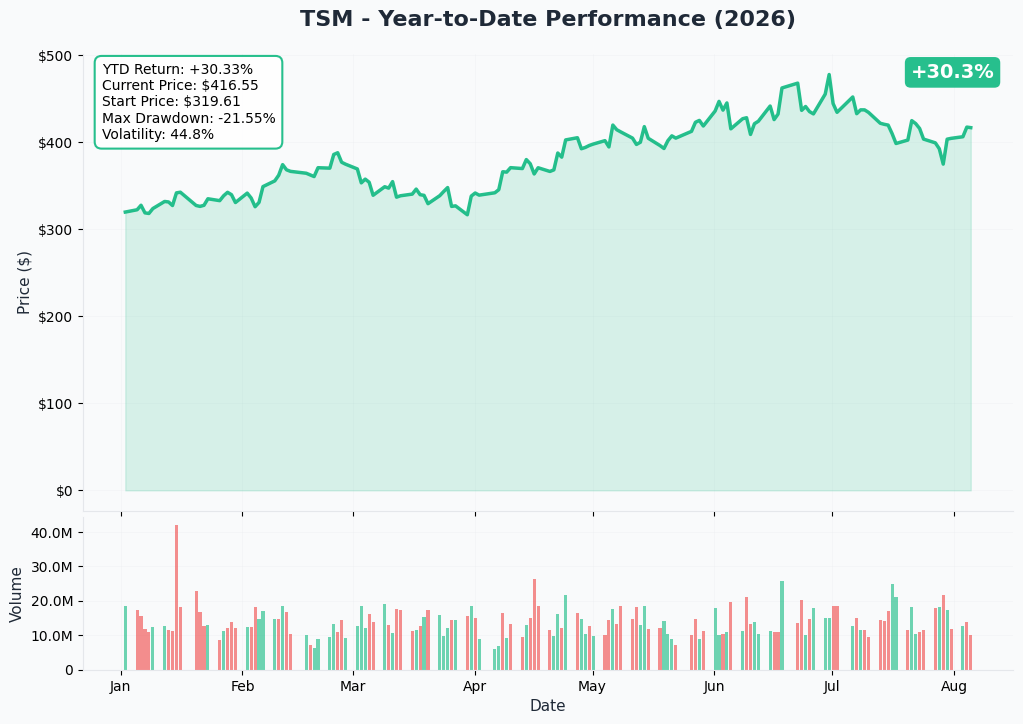
TSM has been in a strong uptrend over the past year (+74.17% on a 52-week basis), currently trading in the low-$400s versus a 52-week high of $479.00 — meaning both of today's structures are positioned for a continuation move back toward the highs rather than a fresh breakout into uncharted territory.
Gamma-Based Support & Resistance Analysis
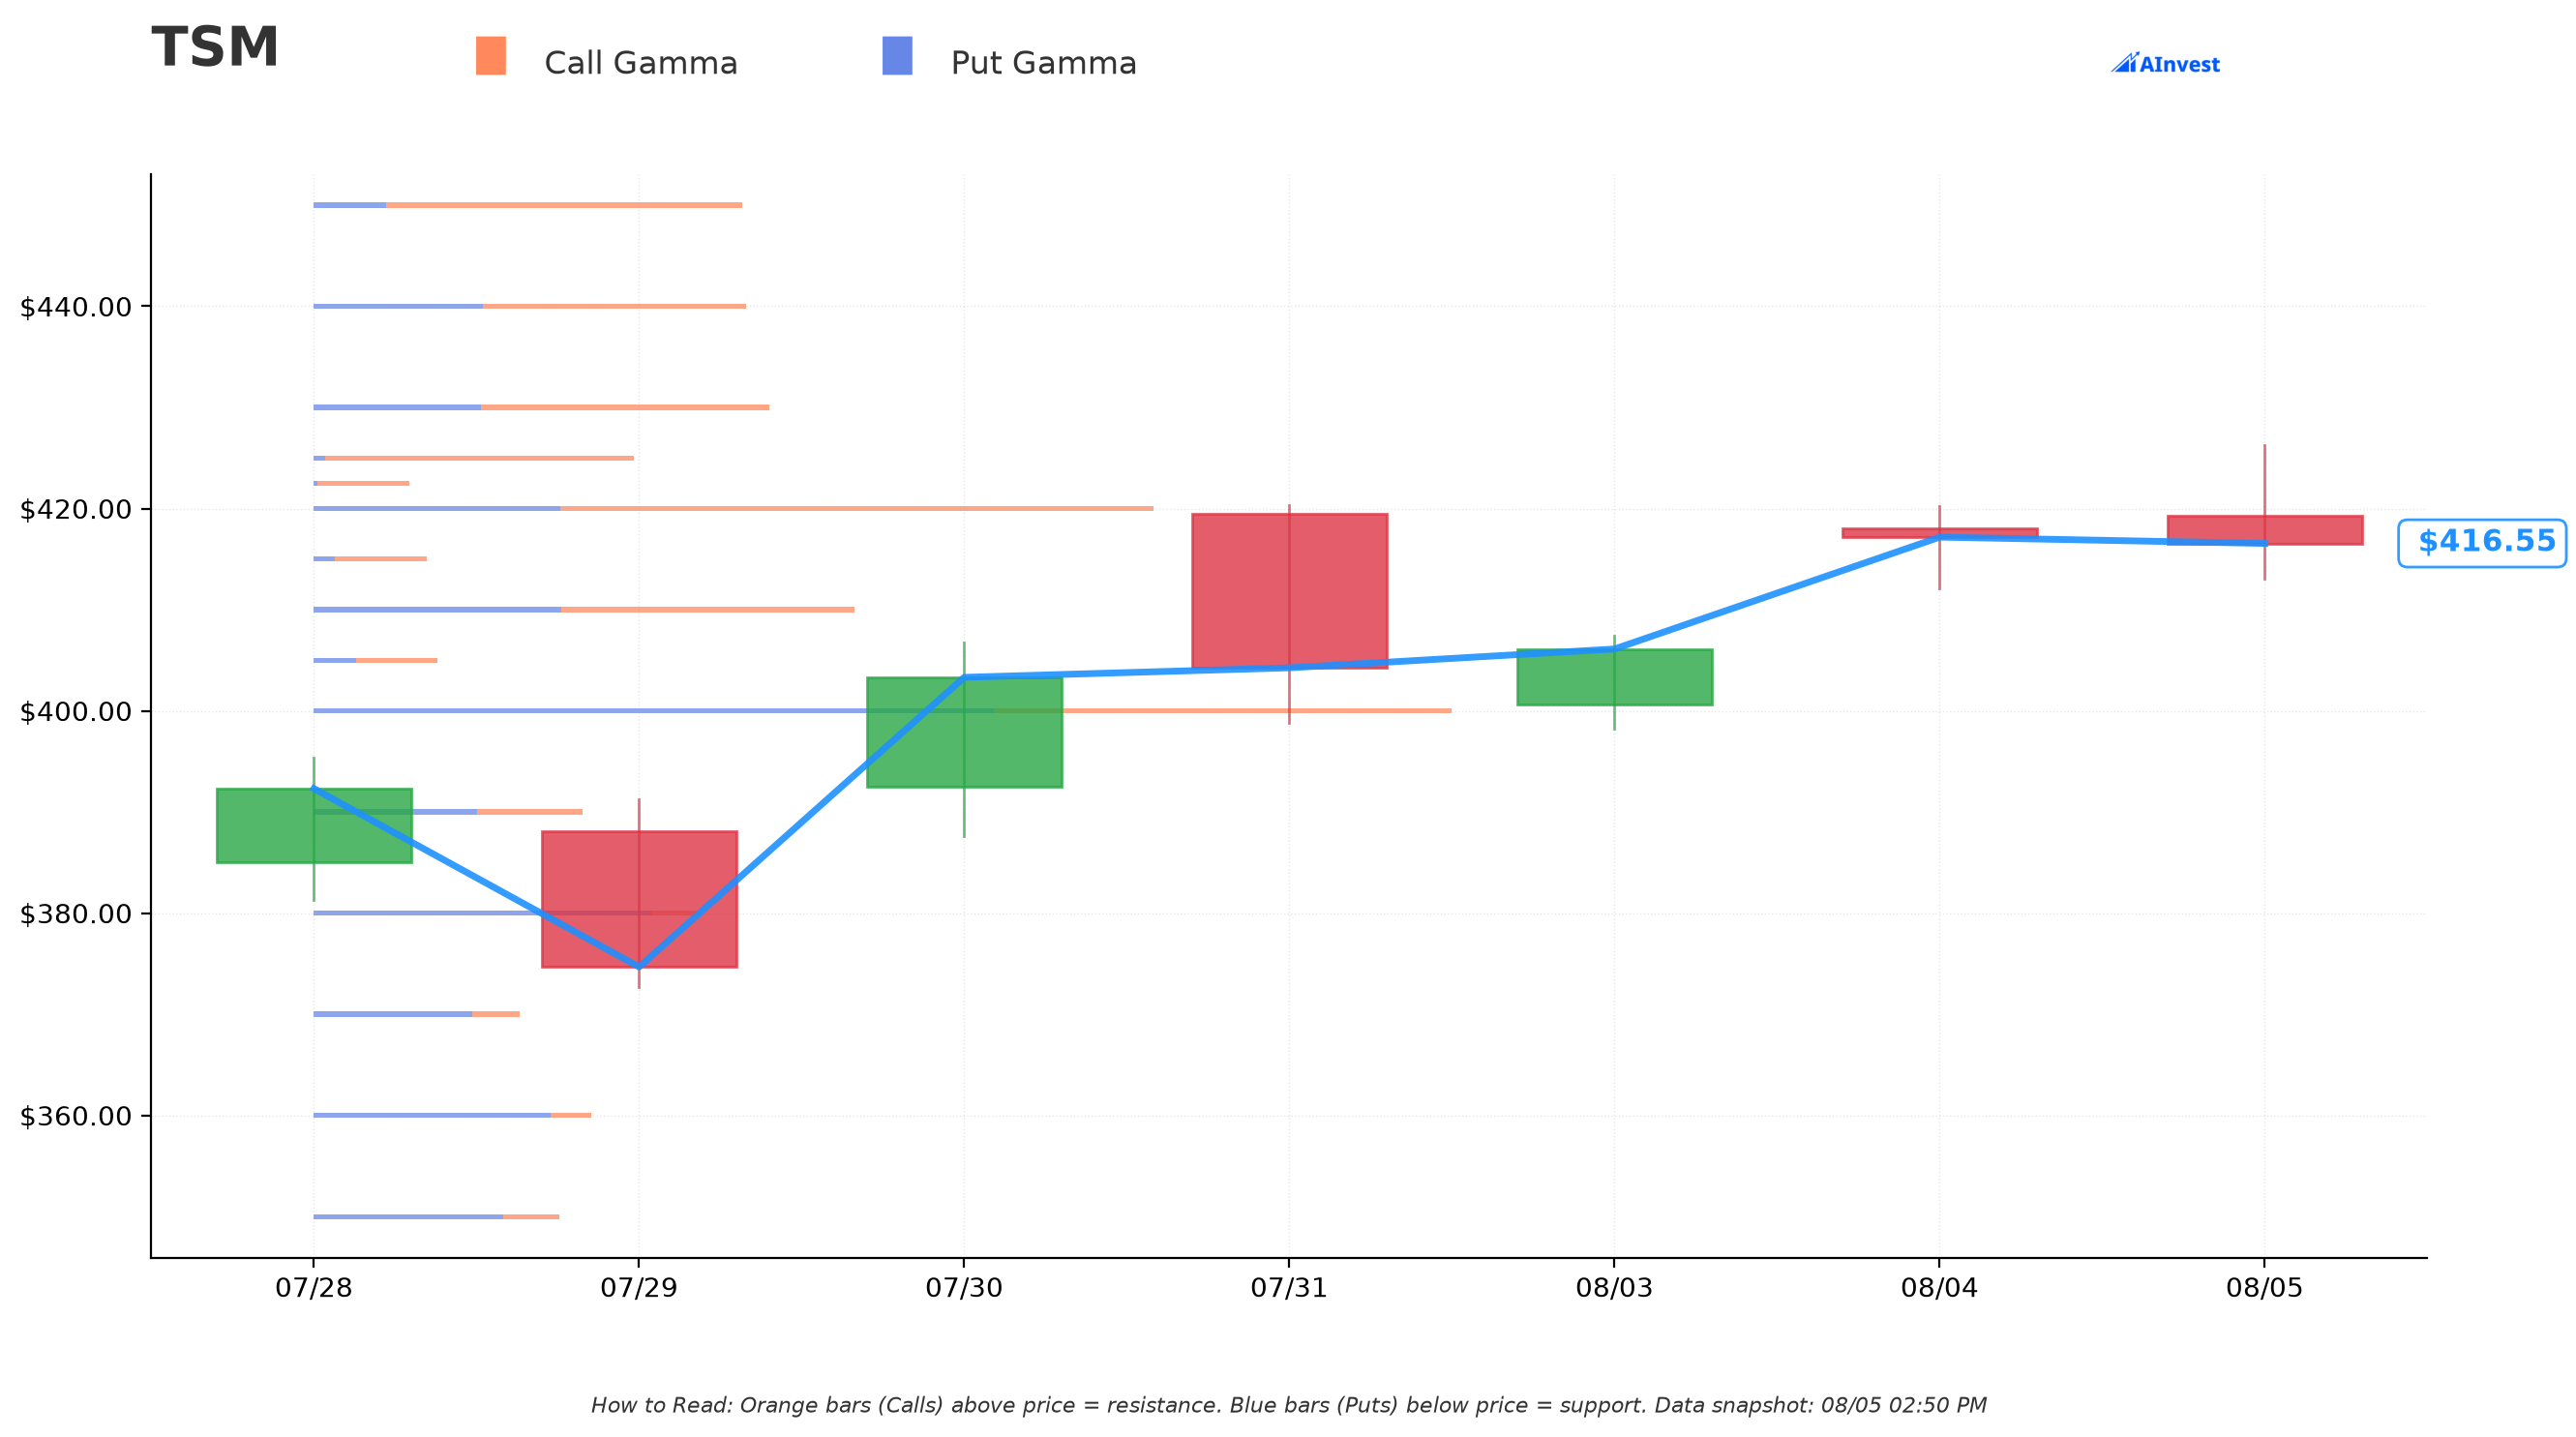
With TSM at $416.76 in this snapshot, the dealer gamma map shows:
- 🟠 $420 — Very Strong resistance wall, the single largest positive-gamma strike on the board (net gamma +10.39, call gamma nearly 2.4x put gamma), just 0.78% above spot. This is the first wall price needs to clear.
- 🟠 $425 — another call-heavy wall (net gamma +8.90), 1.98% above spot.
- 🟠 $430 / $440 / $450 — a ladder of resistance walls stacking up toward the 52-week high.
- 🔵 $410 — a "Very Strong" level right under spot, but interestingly call-gamma-heavy (net +1.41), suggesting dealers are more short calls than puts there.
- 🔵 $400 — the single biggest total-gamma strike in the entire chain (total gex 34.10, but net gamma −6.69, meaning put gamma actually dominates there at 20.40 vs 13.70 call gamma). This is exactly the strike both Trade 1's call and Trade 2's call are anchored to — a huge concentration of dealer hedging sits right where these bulls need price to hold.
- 🔵 $380 — a "Strong" put-heavy support wall (net gamma −8.70, put gamma 10.13 vs call gamma 1.43 — by far the most lopsided put concentration on the chart), 8.82% below spot. This is the exact strike Trade 2 sold its put at — the trader picked a strike where dealers already carry heavy put gamma, i.e., a level the market structure itself tends to defend.
Translation for retail traders: today's bullish bets are stacked directly against the $400 gamma wall (resistance-turned-target) and use $380 (a real structural put-support level) as their downside floor. That's not a random pick — it lines up with where the options market's own positioning already concentrates.
Implied Move Analysis
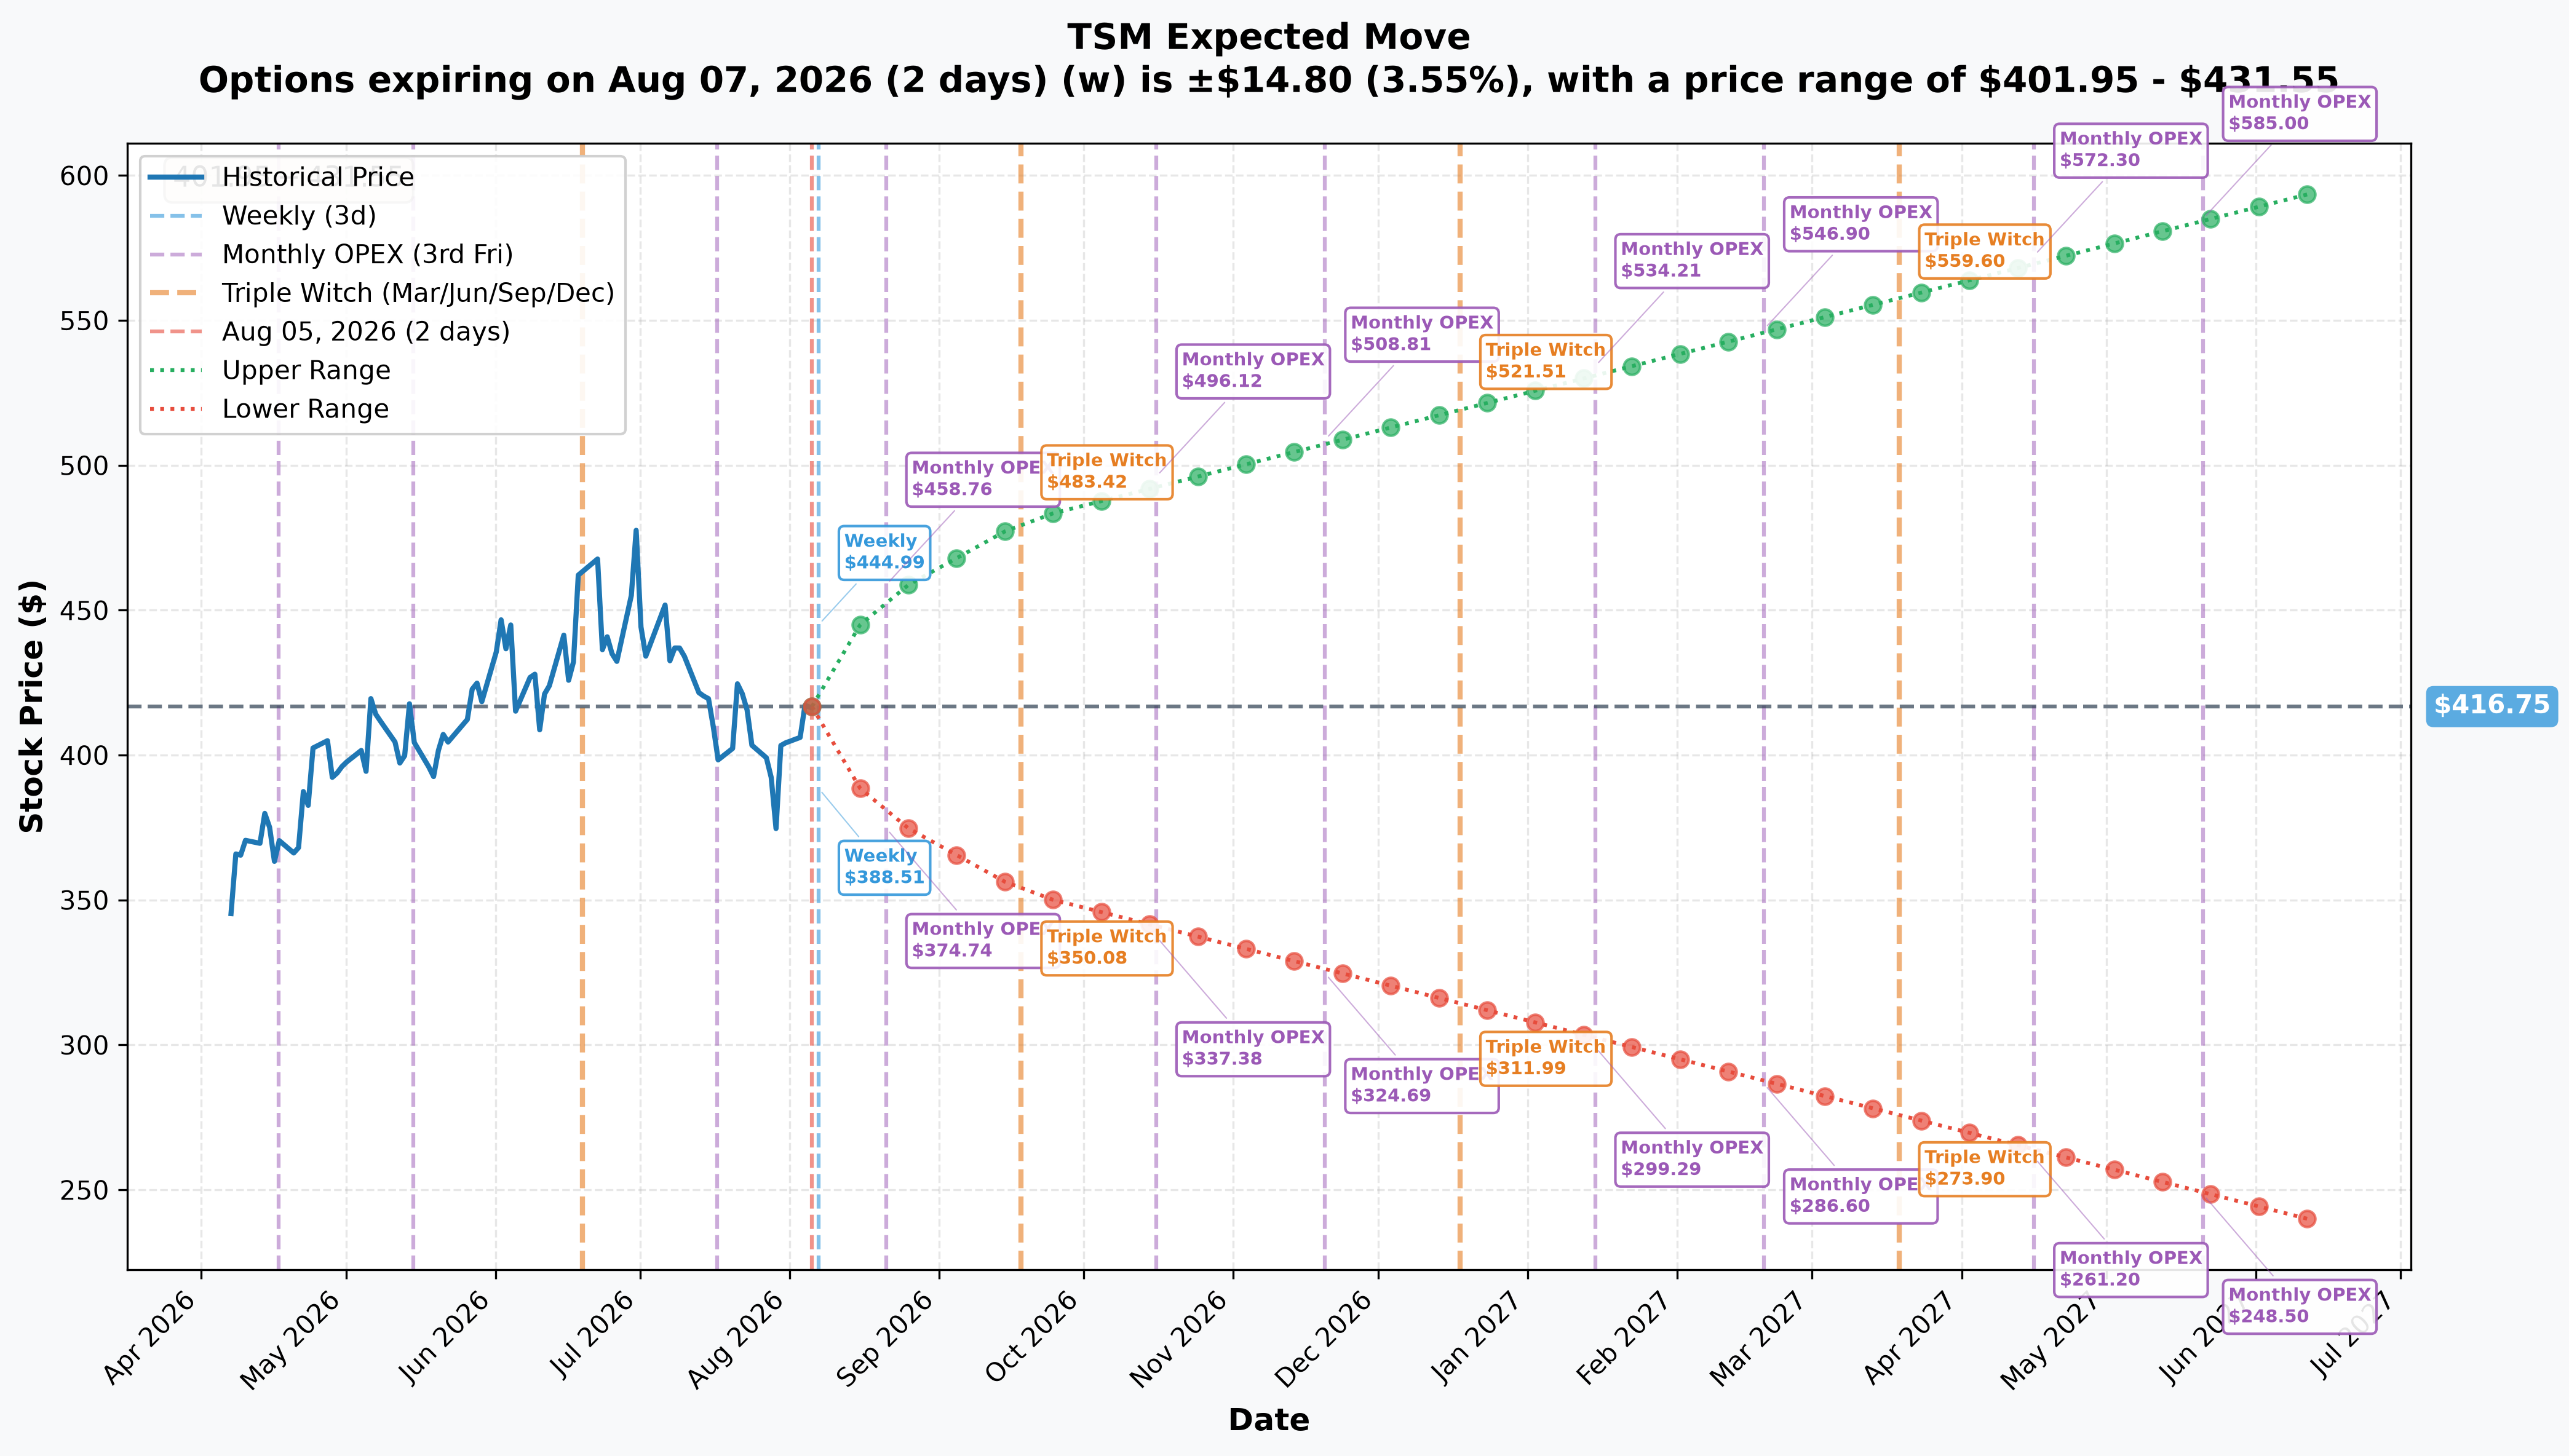
Reading implied_move.json for TSM at $416.75:
| Expiration | Days to expiry | Implied move | Range |
|---|---|---|---|
| Weekly (2026-08-07) | 2 | ±3.55% (±$14.80) | $401.95 – $431.55 |
| Monthly OPEX (2026-08-21) — matches Trade 2 | 16 | ±9.19% (±$38.32) | $378.43 – $455.07 |
| Quarterly triple witch (2026-09-18) — matches Trade 1 | 44 | ±15.39% (±$64.13) | $352.62 – $480.88 |
| Yearly LEAPS (2027-06-17) | 316 | ±43.01% (±$179.25) | $237.50 – $596.00 |
The standout: the options market's own 1-standard-deviation downside boundary for the August 21 expiration is $378.43 — almost exactly on top of the $380 strike where Trade 2 sold its put. In other words, the risk reversal's downside floor sits just above where the market is already pricing a "normal" bad move by that date, not deep into tail-risk territory. On the upside, $455.07 sits comfortably above the $400 call strike, leaving real room for the call to run before the priced-in move is exhausted. For Trade 1's September expiration, the $352.62–$480.88 implied range comfortably brackets the $400 strike near its lower-middle, consistent with the call's already-elevated ≈0.64 delta.
🎪 Catalysts
Imminent (before Trade 2's Aug 21 expiration)
July 2026 monthly revenue — due in the standard 8th–13th window, estimated ≈August 10–13, 2026. This is the single nearest, highest-frequency catalyst in play. As of this research, TSMC's investor relations monthly revenue page shows January through June posted, with July still blank — the release has not happened yet. June printed NT$442,680M, +67.9% YoY, the strongest month of the year, so the July number lands as the market's first real-time check on whether TSMC's above-consensus Q3 guide is tracking. It falls squarely inside Trade 2's Aug 21 expiration window.
Delivering on the Q3 guide. TSMC's Q2 2026 report on July 16 beat on both lines — revenue of $40.20B (+36% YoY) versus $39.83B consensus, and EPS of $4.31 versus $3.82 consensus (a $0.49 beat). The real headline was the guide: Q3 revenue of $44.6B–$45.8B against a $42.8B Street consensus, roughly 5.6% above at the midpoint. That guide is now baked into the stock, and August/September monthly revenue prints are the drip-feed of evidence for or against it.
Later (after Trade 2 expires, before/around Trade 1's expiration)
August monthly revenue — estimated ≈September 8–11, 2026 and September monthly revenue — estimated ≈October 8–13, 2026 (same recurring mechanism), both per the TSMC IR schedule.
Q3 2026 earnings call — estimated Thursday, October 15, 2026 (MarketBeat notes this date is modeled from historical patterns; TSMC's own IR events pages did not confirm it directly). This lands after both today's expirations, so neither trade is a direct earnings play — but it's the event that will validate or break the Q3 guide these positions are implicitly leaning on.
Next dividend ex-date — no forward date currently announced. The last ADR ex-date was June 11, 2026 ($0.74207/share); the pattern (Sep→Dec→Mar→Jun) points to a next ex-date around mid-September 2026, but this is an estimate, not a confirmed date.
Also on the radar: TSMC and Amkor Technology's 10-year Arizona advanced-packaging partnership, announced June 16, 2026 — any milestone updates over the next six months serve as a slower-moving tariff/onshoring-hedge catalyst.
🎲 Price Targets & Probabilities
Using the gamma map and implied move together:
- Bull case / upside target: $455 area by Aug 21, the top of the monthly implied-move range and well past the $420–$425 gamma resistance wall. This is roughly the zone where Trade 2's call leg is deeply profitable.
- Base case: the $400–$420 zone — the largest gamma concentration in the chain on both sides, where price has tended to gravitate. A grind here would leave both trades near breakeven.
- Bear case / downside floor: $378–$380, where the implied-move lower bound and the put-heavy gamma support wall both sit almost on top of the risk reversal's short put strike. A close below this level is where Trade 2's downside obligation kicks in.
💡 Trading Ideas
🛡️ Conservative
The OI confirmation is now in, and it says only the Aug-21 risk reversal is real opening flow — so ignore Trade 1 entirely as a signal. If you want to express the same directional lean as Trade 2, a defined-risk bull call spread (e.g., buy the $400 call / sell the $420 call, both Aug 21) is the conservative expression — same direction, capped risk, no obligation to buy stock at $380.
⚖️ Balanced
A smaller-size long Aug-21 $400 call on its own, sized to a breakeven near $424 (strike + premium), captures the same directional thesis as Trade 2's bullish leg without taking on the assignment risk of the short put.
🚀 Aggressive
Mirror the structure in miniature: sell one Aug-21 $380 put / buy one Aug-21 $400 call as a 1-lot risk reversal. This only makes sense if you're genuinely comfortable owning 100 shares of TSM at an effective $376 cost basis if it goes wrong — treat the "aggressive" label literally, this carries real assignment risk, not just a defined-loss options bet.
⚠️ Risk Factors — What The Tape Cannot Prove
- Open vs. close is now resolved on all three legs — and it inverted Trade 1. The August 6 OI snapshot proved the Sep-18 $400 call buy was a close, not an open. This is exactly the failure mode the day-of tape cannot catch: a large in-the-money call purchase looks bullish and is sometimes a short being retired. What OI still cannot tell us is why the desk is unwinding — profit-taking on a winning short, risk-limit reduction, or a position being moved elsewhere all look identical.
- "Partial open" is a real category, not a rounding error. The $380 put added only ≈20% of its print to open interest. OI cannot identify which fifth was new, so the size of the desk's genuinely fresh short-put exposure is bounded, not known.
- No visibility into hedges. OPRA cannot show us whether this trader (or these two separate traders — Trade 1 and Trade 2 hit 62 minutes apart and are not confirmed to be the same desk) holds an offsetting stock or futures position that changes the real net exposure.
- No counterparty identity. We know these were negotiated blocks with a known counterparty on the other side — we don't know who either side is, their cost basis, or their motive (a market maker facilitating flow looks identical on the tape to a directional trader).
- Valuation and positioning risk independent of this flow: TSM trades at 27.64x trailing earnings after a +74.17% run, with a one-sided Strong Buy consensus and only 0.69% short interest — there's little bearish cushion if the July monthly revenue number or the eventual Q3 print disappoints.
- Assignment risk on the short put leg is real if this position stands: a close below $380 by August 21 means potential stock assignment, not just a worthless option.
🎯 The Bottom Line
Real talk: $40.29M in premium changed hands at TSM on August 5, but only about half of it was a bet. Both prints clustered around the $400 strike — right where the dealer gamma map shows the heaviest concentration in the chain — and on the day both looked bullish. The resolving open-interest snapshot separated them:
- Trade 1 ($19.75M, Sep-18 $400 calls) was a short being covered, the fourth consecutive session of an unwind at that strike. It retires an obligation. It is not a new long call, and it carries no breakeven to track.
- Trade 2 ($20.54M net, the Aug-21 risk reversal) is the genuine new position — a stock-replacement bet financed by selling downside protection at $380, a level that lines up closely with the options market's own priced-in downside for that expiration. Its bullish call leg opened by ≈70% of the print.
The honest lesson here is the one the tape keeps teaching: a big in-the-money call purchase is not automatically a bullish bet. Size below prior open interest meant we flagged it as unproven on the day, and it resolved the other way. The next real catalyst is TSMC's July monthly revenue release in the ≈August 10–13 window, which lands right inside the risk reversal's expiration.
Last updated: 2026-08-06 (pre-market) — next-day OPRA open interest resolved all three legs. Trade 1 inverted from a provisional bullish open to a confirmed buy-to-close; the title, lead, plain-English section, risk factors and bottom line were corrected accordingly.
This is options flow analysis, not investment advice. Options trading involves substantial risk of loss and is not suitable for all investors. Position sizes, strikes, and structures discussed here reflect institutional-scale flow observed on the tape; retail traders should size any position to their own risk tolerance and account size.