🍰 TSM $12.25M Call Sale — A Desk Collected Premium Selling the $550 Strike, Not Betting Against the Stock
📅 August 10, 2026 | 🤝 Block Cross Detected
🎯 The Quick Take
A desk sold 8,000 Taiwan Semiconductor Jan-15-2027 $550 calls for ≈$12.25M in collected premium this morning at 10:21:33, when TSM was trading at $421.80 — a strike sitting roughly 30% above the current price. This printed as a negotiated block cross (🤝, a known counterparty on the other side, not a lit sweep), and the size clears prior open interest, so at least ≈1,769 of these contracts are provably new. The headline number is big, but selling a call this far out of the money is most often income against existing shares or a bet that TSM won't run 30% higher in five months — not a bearish trade. We'll walk through exactly why below, and what the tape genuinely cannot tell us.
📊 Company Overview
Taiwan Semiconductor Manufacturing Company (TSM) is the world's largest dedicated semiconductor foundry — it doesn't sell its own branded chips, it manufactures leading-edge logic chips to order for customers like Nvidia, Apple, and AMD, and also supplies the advanced packaging (CoWoS) that stitches those chips together with high-bandwidth memory for AI accelerators.
- Market cap: ≈US$2.20 trillion, the 6th most valuable company in the world (providers disagree on the exact figure; ≈$1.91T also appears in some data — treat ≈$2.2T as the whole-company basis)
- Sector / industry (GICS): Information Technology → Semiconductors & Semiconductor Equipment → Semiconductors
- Trailing P/E: ≈27.4 | 52-week range: $223.70 – $479.00
- TSM is an American Depositary Receipt, not the ordinary share. The ordinary share trades in Taipei as 2330.TW; each ADR represents five TSMC common shares. That matters here in two ways: TSMC discloses revenue monthly (twelve extra scheduled disclosures a year most US semis don't have), and the ADR embeds NT$/US$ FX risk on top of the business itself.
💰 The Option Flow Breakdown
📊 What Actually Happened
| Field | Detail |
|---|---|
| Time | 10:21:33 ET |
| Buy/Sell | SELL |
| Call/Put | CALL |
| Expiration | 2027-01-15 |
| Premium | $12.25M (credit collected) |
| Strike | $550 |
| Volume | 8,000 |
| Prior OI | 6,231 |
| Size | 8,000 |
| Spot at print | $421.80 |
| Option Price | $15.31 |
| Option Symbol | TSM20270115C550 |
| Order Type | STO (opening confirmed for ≥1,769 contracts) |
| Strategy | Short OTM Call — Premium Collection |
| Mechanism | 🤝 BLOCK CROSS — negotiated off-book, known counterparty. No urgency, no sweep. |
This was one leg, one print, no paired stock leg visible on the tape. The strike is ≈30% above where TSM traded at the moment of the print, and it's also ≈14.8% above TSM's own 52-week high of $479 — meaning the stock has literally never traded at this strike. Because the option price ($15.31) sits entirely above the strike with zero intrinsic value, the full $12.25M is pure time value — money paid purely for the chance TSM gets there, nothing else.
✅ RESOLVED — A Full Open, Not a Transfer
Updated 2026-08-11 pre-market. Resolving OPRA snapshot timestamped August 11 (reflects the August 10 close); baseline is the August 10 snapshot (reflects August 7 — before these prints).
| Leg | Baseline (Aug-10) | Resolving (Aug-11) | Δ | Print size | Δ as % | Day vol | Our published prediction | Verdict |
|---|---|---|---|---|---|---|---|---|
| Jan-15-2027 $550 call (sold) | 6,231 | 14,272 | +8,041 | 8,000 | +100.5% | 8,058 | ≈14,231 if fully opening | ✅ OPEN (STO) — exact |
We laid out three branches and the most bullish-for-the-open one won. Predicted ≈14,231 if this was mostly fresh opening; it printed 14,272. Open interest rose by 8,041 against an 8,000-lot sale — 100.5% of the print size, meaning the transfer scenario (a rise of only ≈1,769 to a few thousand) is ruled out entirely, and the "flat or falling OI would be the surprise" case did not materialize.
The full 8,000-contract short call position is new. Despite printing as a block cross with a known counterparty on both sides — the mechanism that most often produces transfers rather than opens — every contract here created new open interest. The premium-collection read in this article stands on proven, not inferred, opening size.
🤓 What This Actually Means — Plain English
Selling a call means collecting premium upfront in exchange for an obligation: if TSM is above $550 on January 15, 2027, the seller owes the buyer the difference (or the shares). Two very different people sell calls, and the tape alone can't tell us which one this was:
- A covered call. If the seller already owns TSM shares (or ADRs), selling this $550 call is a classic income strategy — pocket $12.25M in premium, and if the stock stays below $550 by expiration, keep the shares AND the premium. If TSM does rocket past $550, the shares get called away at a price the seller was presumably happy to sell at anyway. This is one of the most conservative, retail-familiar options strategies there is, just executed at institutional scale.
- A naked (uncovered) short call. If there are no shares behind it, this is a pure bet that TSM stays below $550 through mid-January 2027 — and it carries theoretically unlimited risk. There is no ceiling on how high a stock can go, so a naked short call has no cap on the loss if the thesis is wrong. That risk profile is fundamentally different from the covered version, and the tape cannot distinguish between the two — it shows the option leg only, not any stock position sitting behind it.
The interesting tension today: this call sale happened on the same day TSMC reported July 2026 revenue of NT$467.58B (≈US$14.5B), up 44.7% year over year — a record month. A seller capping upside at $550 on a day the company just printed its best month ever is worth noting, but it doesn't automatically mean anyone doubts the business. It's just as consistent with "I'm long the stock, thrilled about the fundamentals, and happy to get paid extra income while I wait for a ≈30% move that I don't think happens in the next five months." We are not calling this bearish — the tape doesn't support that read, and neither does the structure.
📈 Technical Setup / Chart Check-Up
YTD Chart
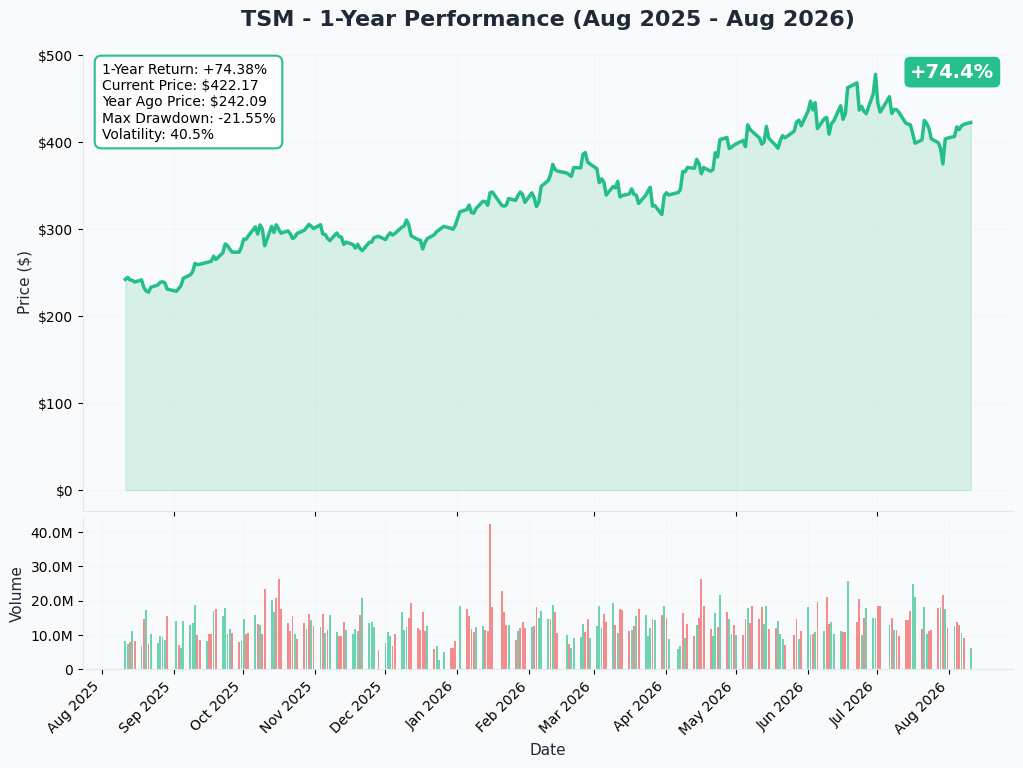
TSM is up roughly ≈32–33% year-to-date in 2026 (FinanceCharts), after a ≈55% run in 2025. The path wasn't a straight line: the stock was up as much as +44% YTD in late June before a post-Q2-earnings selloff — triggered by the higher capex guide, not a miss — took roughly 20% off the high. At $423.55 the ADR sits ≈11.6% below its 52-week high of $479.00.
Gamma-Based Support & Resistance Analysis
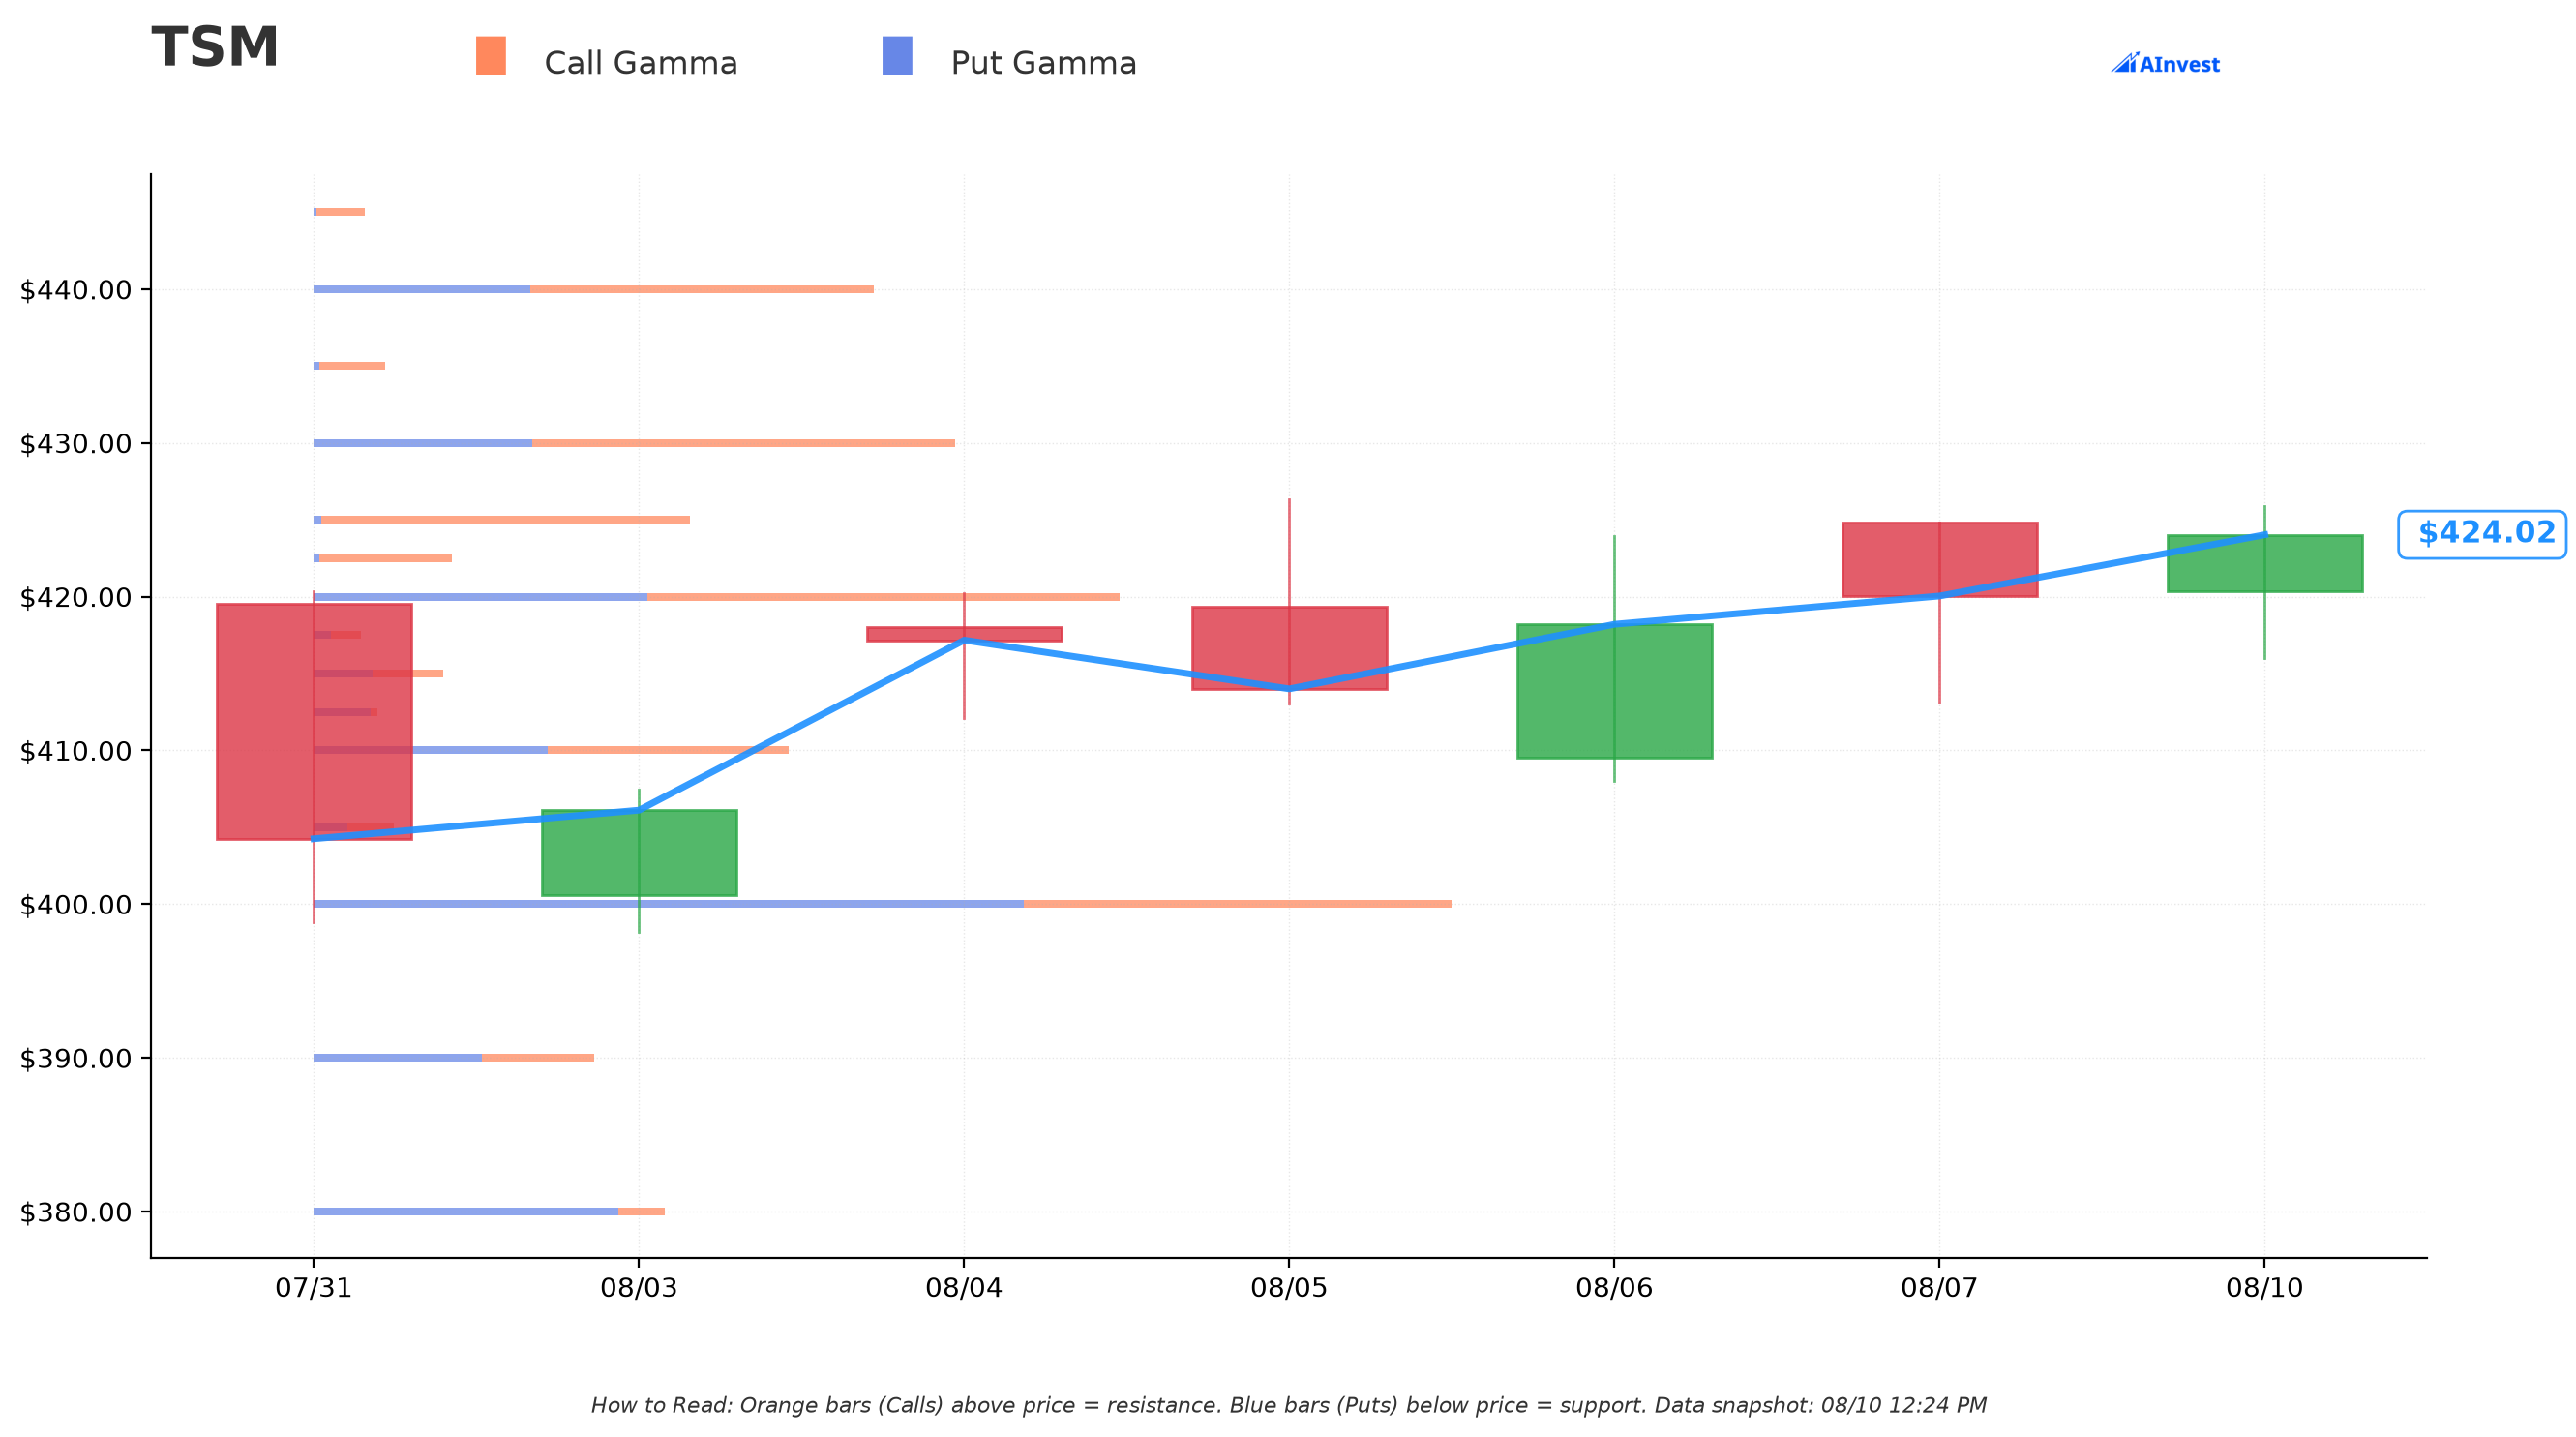
Current price: $423.86 (spot has ticked up slightly since the 10:21:33 print at $421.80)
🔵 Support levels (put gamma below price):
- $420 — very strong, only ≈0.9% below spot, total gamma exposure ≈22.9B
- $410 — very strong, ≈3.3% below, ≈13.5B gamma
- $400 — the biggest nearby floor, ≈5.6% below, ≈32.4B gamma (put-heavy: ≈20.2B put vs ≈12.2B call)
🟠 Resistance levels (call gamma above price):
- $425 — right on top of spot (≈0.3% away), ≈10.7B gamma, almost entirely calls (≈10.5B call vs ≈0.2B put) — this is the nearest ceiling
- $430 — very strong, ≈1.4% above, ≈18.2B gamma
- $440 — ≈3.8% above, ≈15.9B gamma
- $450 — ≈6.2% above, ≈15.6B gamma
Where does $550 sit in this map? Far outside the dense zone. Total gamma exposure at the $550 strike is only ≈1.82B — a small fraction of the ≈15–32B seen at the nearby $400–$450 walls — meaning dealers are carrying comparatively little positioning there today. That's consistent with $550 being viewed by the market as a low-probability tail strike rather than a contested near-term battleground.
Implied Move Analysis
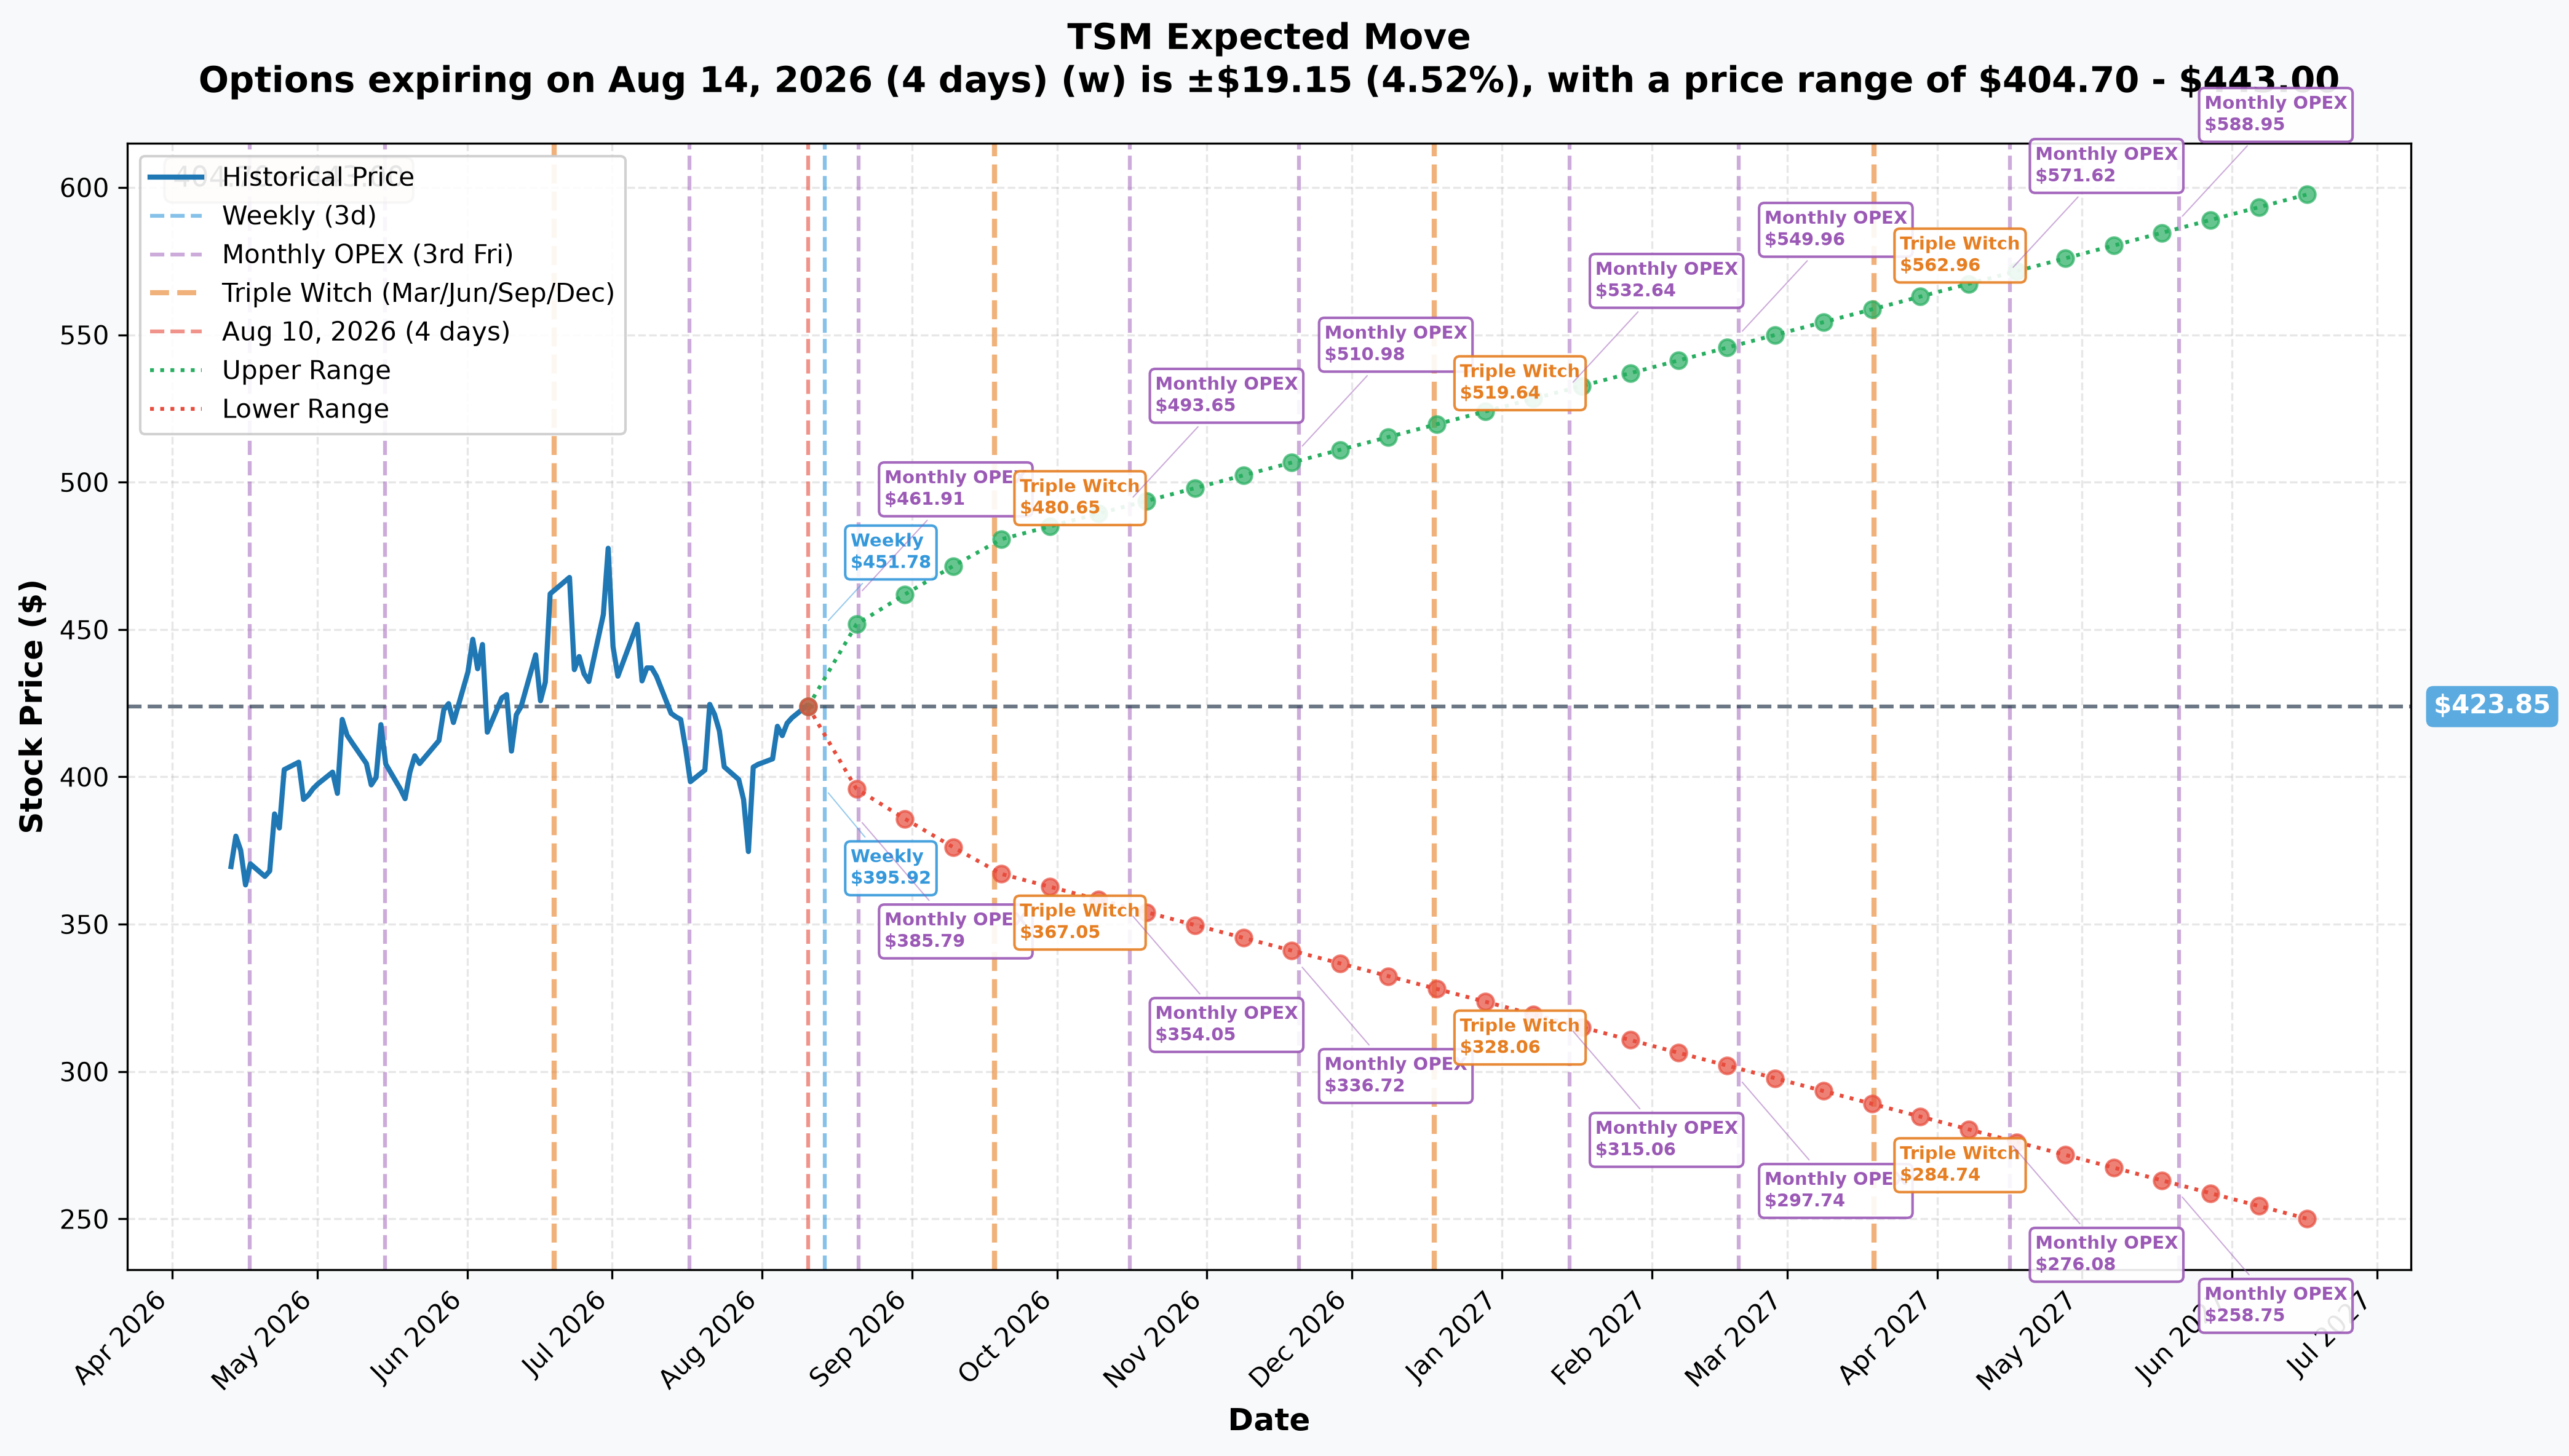
- Weekly (Aug 14, 4 days): ±4.5% → range $404.70 – $443.00
- Monthly OPEX (Aug 21, 11 days): ±6.9% → range $394.46 – $453.24
- Quarterly triple witch (Sep 18, 39 days): ±13.3% → range $367.48 – $480.22
- The matching January 15, 2027 monthly OPEX (the exact expiration of this trade, ≈158 days out): implied range $315.06 – $532.64
Here's the number that matters most for this trade: the options market's own priced-in range for January 15, 2027 tops out at $532.64 — still ≈$17 below the $550 strike this desk sold. In other words, the implied-volatility market itself is pricing the $550 strike as sitting outside its expected range. That's a data-driven way of confirming what the structure already suggested: this looks far more like a call collecting the "tail premium" for an unlikely move than a bet that the move happens.
🎪 Catalysts
What's already happened (last 3 months)
TSMC reported Q2 2026 results on July 16: revenue of NT$1,270.38B (+36% YoY), net income +77.4% YoY, and raised full-year 2026 revenue growth guidance to "slightly above 40%." The same release raised 2026 capex to $60B–$64B and announced an additional $100B for Arizona. Despite the beat, the stock fell ≈20% from its post-earnings high as the chip complex shed more than $1 trillion in value on the margin-dilution and capex commentary — a reminder that even record results don't guarantee the stock goes up.
Today, August 10, 2026, TSMC reported July 2026 revenue of NT$467.58B (≈US$14.5B), up 44.7% year over year — a record month, already tracking ahead of the full-year 40%+ growth target.
What's still to come before this option expires
TSMC's unique monthly-revenue cadence means five more company-confirmed sales releases land before January 15, 2027, per TSMC's official financial calendar:
| # | Date | Data released |
|---|---|---|
| 1 | Sep 10, 2026 | August 2026 sales |
| 2 | Oct 8, 2026 | September 2026 sales |
| 3 | Nov 10, 2026 | October 2026 sales |
| 4 | Dec 10, 2026 | November 2026 sales |
| 5 | Jan 8, 2027 | December 2026 sales — closes out FY2026 |
There's also one quarterly earnings report expected before expiration: Q3 2026 results, likely ≈October 15, 2026 — but that date is not company-confirmed, only a pattern inference from four consecutive third-Thursday reports (Wall Street Horizon).
A structurally important detail: the call the desk sold expires January 15, 2027 — that is an option-contract settlement date, not a TSMC event. The Q4 2026 / full-year earnings call, which historically carries the first FY2027 capex guidance (the single number most likely to move the stock on a multi-month view), has no confirmed date yet, but applying TSMC's own third-Thursday pattern points to ≈January 21, 2027 — about six days AFTER this option expires. A holder of this position is exposed to six confirmed/likely information events, but very likely misses the one event (FY2027 capex guidance) that would most reprice the 2027 thesis.
🎲 Price Targets & Scenarios
Using the gamma map and implied-move data above:
- Base case: TSM continues to oscillate in the $400–$450 gamma-dense zone through the next few monthly revenue prints, well inside even the weekly implied range, let alone the $550 strike.
- Bull case: A strong Q3 print (≈Oct 15, unconfirmed) plus continued record monthly sales pushes TSM toward the $480–$500 area (the 52-week high plus the next visible resistance wall) — still well short of $550.
- Tail case: For TSM to actually reach $550 by Jan 15, 2027, it would need to rally ≈30% in ≈5 months, moving past its own all-time high by nearly 15% and beyond the options market's own priced-in range. It's not impossible — TSM has had double-digit-percent months before — but it is, by the market's own volatility pricing, a low-probability outcome, which is exactly why $15.31 (rather than a much higher number) was the price someone was willing to sell it for.
💡 Trading Ideas — Four Reader Lenses
🎰 YOLO Trader
If you want to bet TSM makes a genuinely explosive move toward $550, the retail-appropriate way to express that view is to buy this same Jan 2027 $550 call (or a call spread) for a small, defined amount you can afford to lose completely — not to sell it naked. Buying caps your loss at the premium paid; selling it uncovered, as this desk did at institutional scale, exposes you to unlimited loss if TSM overshoots. At $15.31 per share ($1,531 per contract), this is an expensive lotto ticket for a strike the implied-move data itself says is outside the expected range — go in knowing the odds are stacked against you and size accordingly (a few percent of a speculative account, no more).
📊 Swing Trader
This specific trade has a ≈5-month horizon and isn't really swing-trade territory, but the gamma map is directly useful for shorter setups: $420 and $425 are the immediate battle lines (support and resistance within ≈1% of spot), with $400 and $430–$450 as the next tiers out. Watch how price behaves around the five upcoming monthly revenue prints (Sep 10, Oct 8, Nov 10, Dec 10, Jan 8) — each is a real, dated catalyst that can push TSM through one of these gamma levels, unlike the $550 strike itself, which sits well outside any near-term battleground.
🛡️ Premium Collector — this is the trade's natural home
This is where today's trade actually lives. If you own TSM shares (or a comparable long exposure) and want to generate income, selling a far-OTM call against your position is a textbook covered call: you collect premium now, keep the upside up to your strike, and only give up shares if the stock rallies past it — which, per the implied-move data above, this specific strike says has less than even odds by January 2027. At retail size, you'd typically sell closer to 1 contract per 100 shares held, likely at a nearer strike and shorter duration than this ≈5-month, 30%-OTM structure, to collect more meaningful premium relative to time. The critical rule: only do this against shares you actually own. Selling calls you can't cover is the naked-risk scenario above, and it belongs to a different risk category entirely — never conflate the two, and never size a short call position as if the loss is capped when it isn't (for a naked call, it is not).
🎓 Beginner
"Selling a call" sounds aggressive, but it just means you're getting paid now for a promise to sell your shares later at a set price if the stock gets there. It is NOT the same as buying a put or shorting the stock — the seller here isn't necessarily betting TSM falls, just that it doesn't rocket ≈30% higher in five months. The single most important thing to internalize before you ever sell a call yourself: if you don't already own the shares, selling a call has no maximum loss. Start by paper-trading covered calls against a stock you already own before ever considering an uncovered position, and never assume a big institutional trade like this one means "smart money says bearish" — as we've shown here, it usually doesn't mean that at all.
⚠️ Honest Limits — What the Tape Cannot Prove
- We cannot tell whether shares are held against this call. That single fact is the difference between a routine covered-call income trade and a naked position carrying unlimited risk. The option tape shows the leg; it does not show any stock or ADR position sitting behind it.
- We cannot fully prove open vs. close on the entire 8,000-contract size. Only ≈1,769 contracts are provably new (size minus prior OI of 6,231). The rest overlaps with existing open interest and could be a transfer between parties rather than a pure net increase — the next-morning OPRA OI snapshot is the only thing that resolves this cleanly.
- We cannot know the seller's broader portfolio, identity, or true motive. A block cross means a known counterparty took the other side off the open book — but OPRA does not disclose broker, customer identity, or order ID. Whether this is one desk hedging a concentrated position, an income overlay on a diversified book, or something else entirely is not knowable from the tape.
- We are not asserting this is bearish, and nothing above should be read that way. The structure, the block-cross mechanism, and the implied-move data all point toward premium collection on a low-probability strike — but "probably not a directional bear bet" is different from "proven not bearish." Treat this as a measured read, not a certainty.
Disclaimer: Options trading involves substantial risk of loss and may not be suitable for all investors. This analysis is for educational purposes only and is not financial advice. A naked short call carries theoretically unlimited risk — never sell calls against shares you don't own without fully understanding that exposure. The OPRA open-interest update that resolves the open/close question on this trade has now published — it confirmed a full open (see the ✅ RESOLVED box above) — and you should always verify current levels before acting on anything above.
Last updated: 2026-08-11 (pre-market) — the next-day OPRA open-interest snapshot resolved this session's provisional flags. Jan-15-2027 $550C 6,231 → 14,272 (+8,041 on an 8,000-lot sale): OPEN (STO) at 100.5% of print size, matching the published ≈14,231 fully-opening branch and ruling out the transfer scenario despite the block-cross mechanism. The ⏳ callout was replaced with the ✅ RESOLVED box.