🛡️ XLB $0.56M Net Credit — Ratioed Bull Put Spread Collects Income While Buying a Crash Wing
Materials Select Sector SPDR (XLB) | June 16, 2026 · Last updated: 2026-06-17 | Spot ≈$52.9
✅ Updated 2026-06-17 — both legs OPEN confirmed: Next-day OPRA OI confirms a clean fresh spread — the short $47 put rose 0 → 45,000 (Δ +45,000) and the long $40 put rose 0 → 54,003 (Δ +54,003), both matching the sizes traded. The ratioed bull put spread is a genuine new position, exactly as predicted.
Quick Take
At 12:55 ET today, a desk executed a two-leg ratioed bull put spread on XLB through a facilitated multi-leg auction — a broker-worked spread order, not a lit-market sweep. The net credit collected is ≈$0.56M (headline number; the gross sell-leg of ≈$1.5M overstates the spread, which is standard for put spreads). The structure is bullish-to-neutral income: collect premium so long as XLB stays above $47 into Jul 31, while the extra long $40 puts (more longs than shorts) provide a near-zero-cost crash wing — if XLB collapses below $40, the position becomes net-long puts and profits in the disaster scenario. This is not a naked put write.
Company Overview
XLB is the Materials Select Sector SPDR ETF, launched in 1998 and the dominant, lowest-cost (0.08% expense ratio) liquid expression of the S&P 500 materials sleeve. It holds ≈26 names, market-cap-weighted and heavily concentrated:
- Linde (LIN) ≈14–15% — industrial gases, defensive earnings, AI/datacenter hydrogen exposure
- Newmont (NEM) ≈8% — gold miner, prime beneficiary of record gold prices
- Freeport-McMoRan (FCX) ≈5–6% — copper/gold miner
- Sherwin-Williams (SHW) ≈5% — paints/coatings, housing- and renovation-levered
- CRH plc ≈5% — aggregates/cement, US infrastructure exposure
XLB is up ≈16% YTD in 2026, lifted primarily by precious and strategic metals, though the broader industrial-demand picture (China property, US housing, construction) remains soft. The 52-week range is $42.04–$54.14 and the 12-month average analyst target sits at ≈$56.67, implying modest further upside from current levels — TipRanks.
The Trade
| Field | Leg 1 (Short) | Leg 2 (Long) |
|---|---|---|
| Time | 12:55:36 ET | 12:55:36 ET |
| Buy/Sell | SELL | BUY |
| Order Type | STO (fresh open) | BTO (fresh open) |
| Call/Put | PUT | PUT |
| Expiration | Jul 31, 2026 | Jul 31, 2026 |
| Strike | $47.00 | $40.00 |
| Volume | 45,000 contracts | 54,000 contracts |
| Prior OI | 0 | 0 |
| Option Price | ≈$0.34 | ≈$0.18 |
| Leg Premium | ≈$1.53M collected | ≈$0.97M paid |
| Net Credit | ≈$0.56M | |
| Spot at Print | ≈$52.9 | ≈$52.9 |
| Option Symbol | $47P Jul-31 | $40P Jul-31 |
| Flow Type | 🛡️ Multi-Leg Auction | 🛡️ Multi-Leg Auction |
Structure: Ratioed bull put spread — 45,000 short $47 puts / 54,000 long $40 puts. Ratio ≈1.20:1 (more long contracts than short). Executed as a facilitated multi-leg auction (a broker-worked complex order; both legs printed simultaneously; a known counterparty is on the other side of the negotiated fill — this is not urgent lit-market aggression).
✅ RESOLVED — Next-Day OI Confirms Both Legs Opened (2026-06-17)
| Leg | Pre-print baseline (EOD 2026-06-15) | Resolving (EOD 2026-06-16) | Δ | Verdict |
|---|---|---|---|---|
| Jul-31 $47P (short) | 0 | 45,000 | +45,000 | OPEN — sell-to-open (STO) confirmed |
| Jul-31 $40P (long) | 0 | 54,003 | +54,003 | OPEN — buy-to-open (BTO) confirmed |
The next-morning OPRA snapshot lands exactly on the prediction: the $47 short-put leg rose 0 → 45,000 and the $40 long-put wing rose 0 → 54,003, both matching the sizes traded. With no prior OI on either strike, there was nothing to close — the ratioed bull put spread is a genuine, brand-new structure.
🤓 What This Actually Means — Plain English
What kind of order is this?
Two legs, two directions, two purposes:
-
Leg 1 — STO (Sell to Open) the $47 Puts: The desk sold 45,000 Jul-31 $47 puts for ≈$0.34 each, collecting ≈$1.53M in premium. Selling a put means you are obligated to buy XLB at $47 if it falls there by expiration. The seller profits as long as XLB stays above $47. This is a premium-collection, income-oriented position — not a bearish bet. The "$47P Jul-31" is the short income leg.
-
Leg 2 — BTO (Buy to Open) the $40 Puts: The desk simultaneously bought 54,000 Jul-31 $40 puts for ≈$0.18 each, paying ≈$0.97M. Buying a put gives you the right to sell XLB at $40. This leg costs money and profits only if XLB drops to or below $40. This is the disaster hedge — the "crash wing."
Why more longs than shorts? The ratio is the key.
Standard bull put spreads sell one put and buy one put at a lower strike. Here the desk bought 9,000 extra contracts on the long side (54,000 vs 45,000). That turns the structure into a ratioed bull put spread with a crucial asymmetry:
- Between $47 and $40: the short $47 puts are exposed but capped — maximum loss is the $7 strike width minus the net credit, multiplied by the 45,000 short contracts (≈$31.4M theoretical max on the short leg alone, before the long leg offsets).
- Below $40: the 54,000 long $40 puts exceed the 45,000 short $47 puts by 9,000 contracts. The position flips net-long 9,000 puts below $40, meaning a catastrophic drop actually generates profit on those excess long contracts. The crash wing is not just protection — it is a small tail-long bet on a deep selloff.
- Above $47: both put legs expire worthless, the desk keeps the full ≈$0.56M net credit. Maximum profit scenario.
Plain English summary: "Get paid ≈$0.56M to be moderately bullish on materials through July 31. If XLB holds above $47 — ≈11% below today's spot — you win. If it gaps below $40 in a genuine crash, you also win on the excess long puts. The only scenario that hurts is a controlled grind down into the $40–$47 zone — bad enough to trigger the short puts, not bad enough to overwhelm them with the long wing."
Net credit, not net debit: this trade collected premium. The ≈$0.56M net is what the desk received. The gross sell-leg figure of ≈$1.53M overstates the cost to the trade — that number is offset by the ≈$0.97M spent on the long wing. Always use the net when sizing the income story.
Technical Setup
XLB Year-to-Date
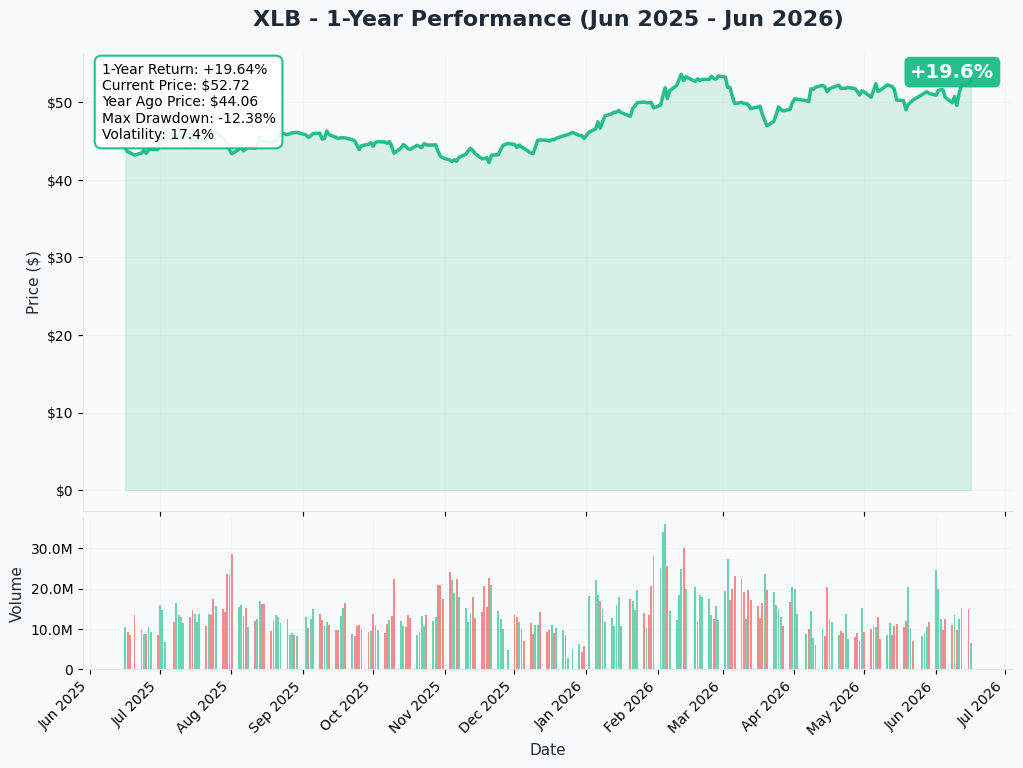
XLB has rallied ≈16% YTD, trading within a well-defined uptrend from the 52-week low of $42.04. Spot at the print was ≈$52.9, just below the 52-week high of $54.14. The trend is intact, and the short $47 strike sits ≈11% below spot — well outside the recent realized-volatility range.
Gamma Support and Resistance
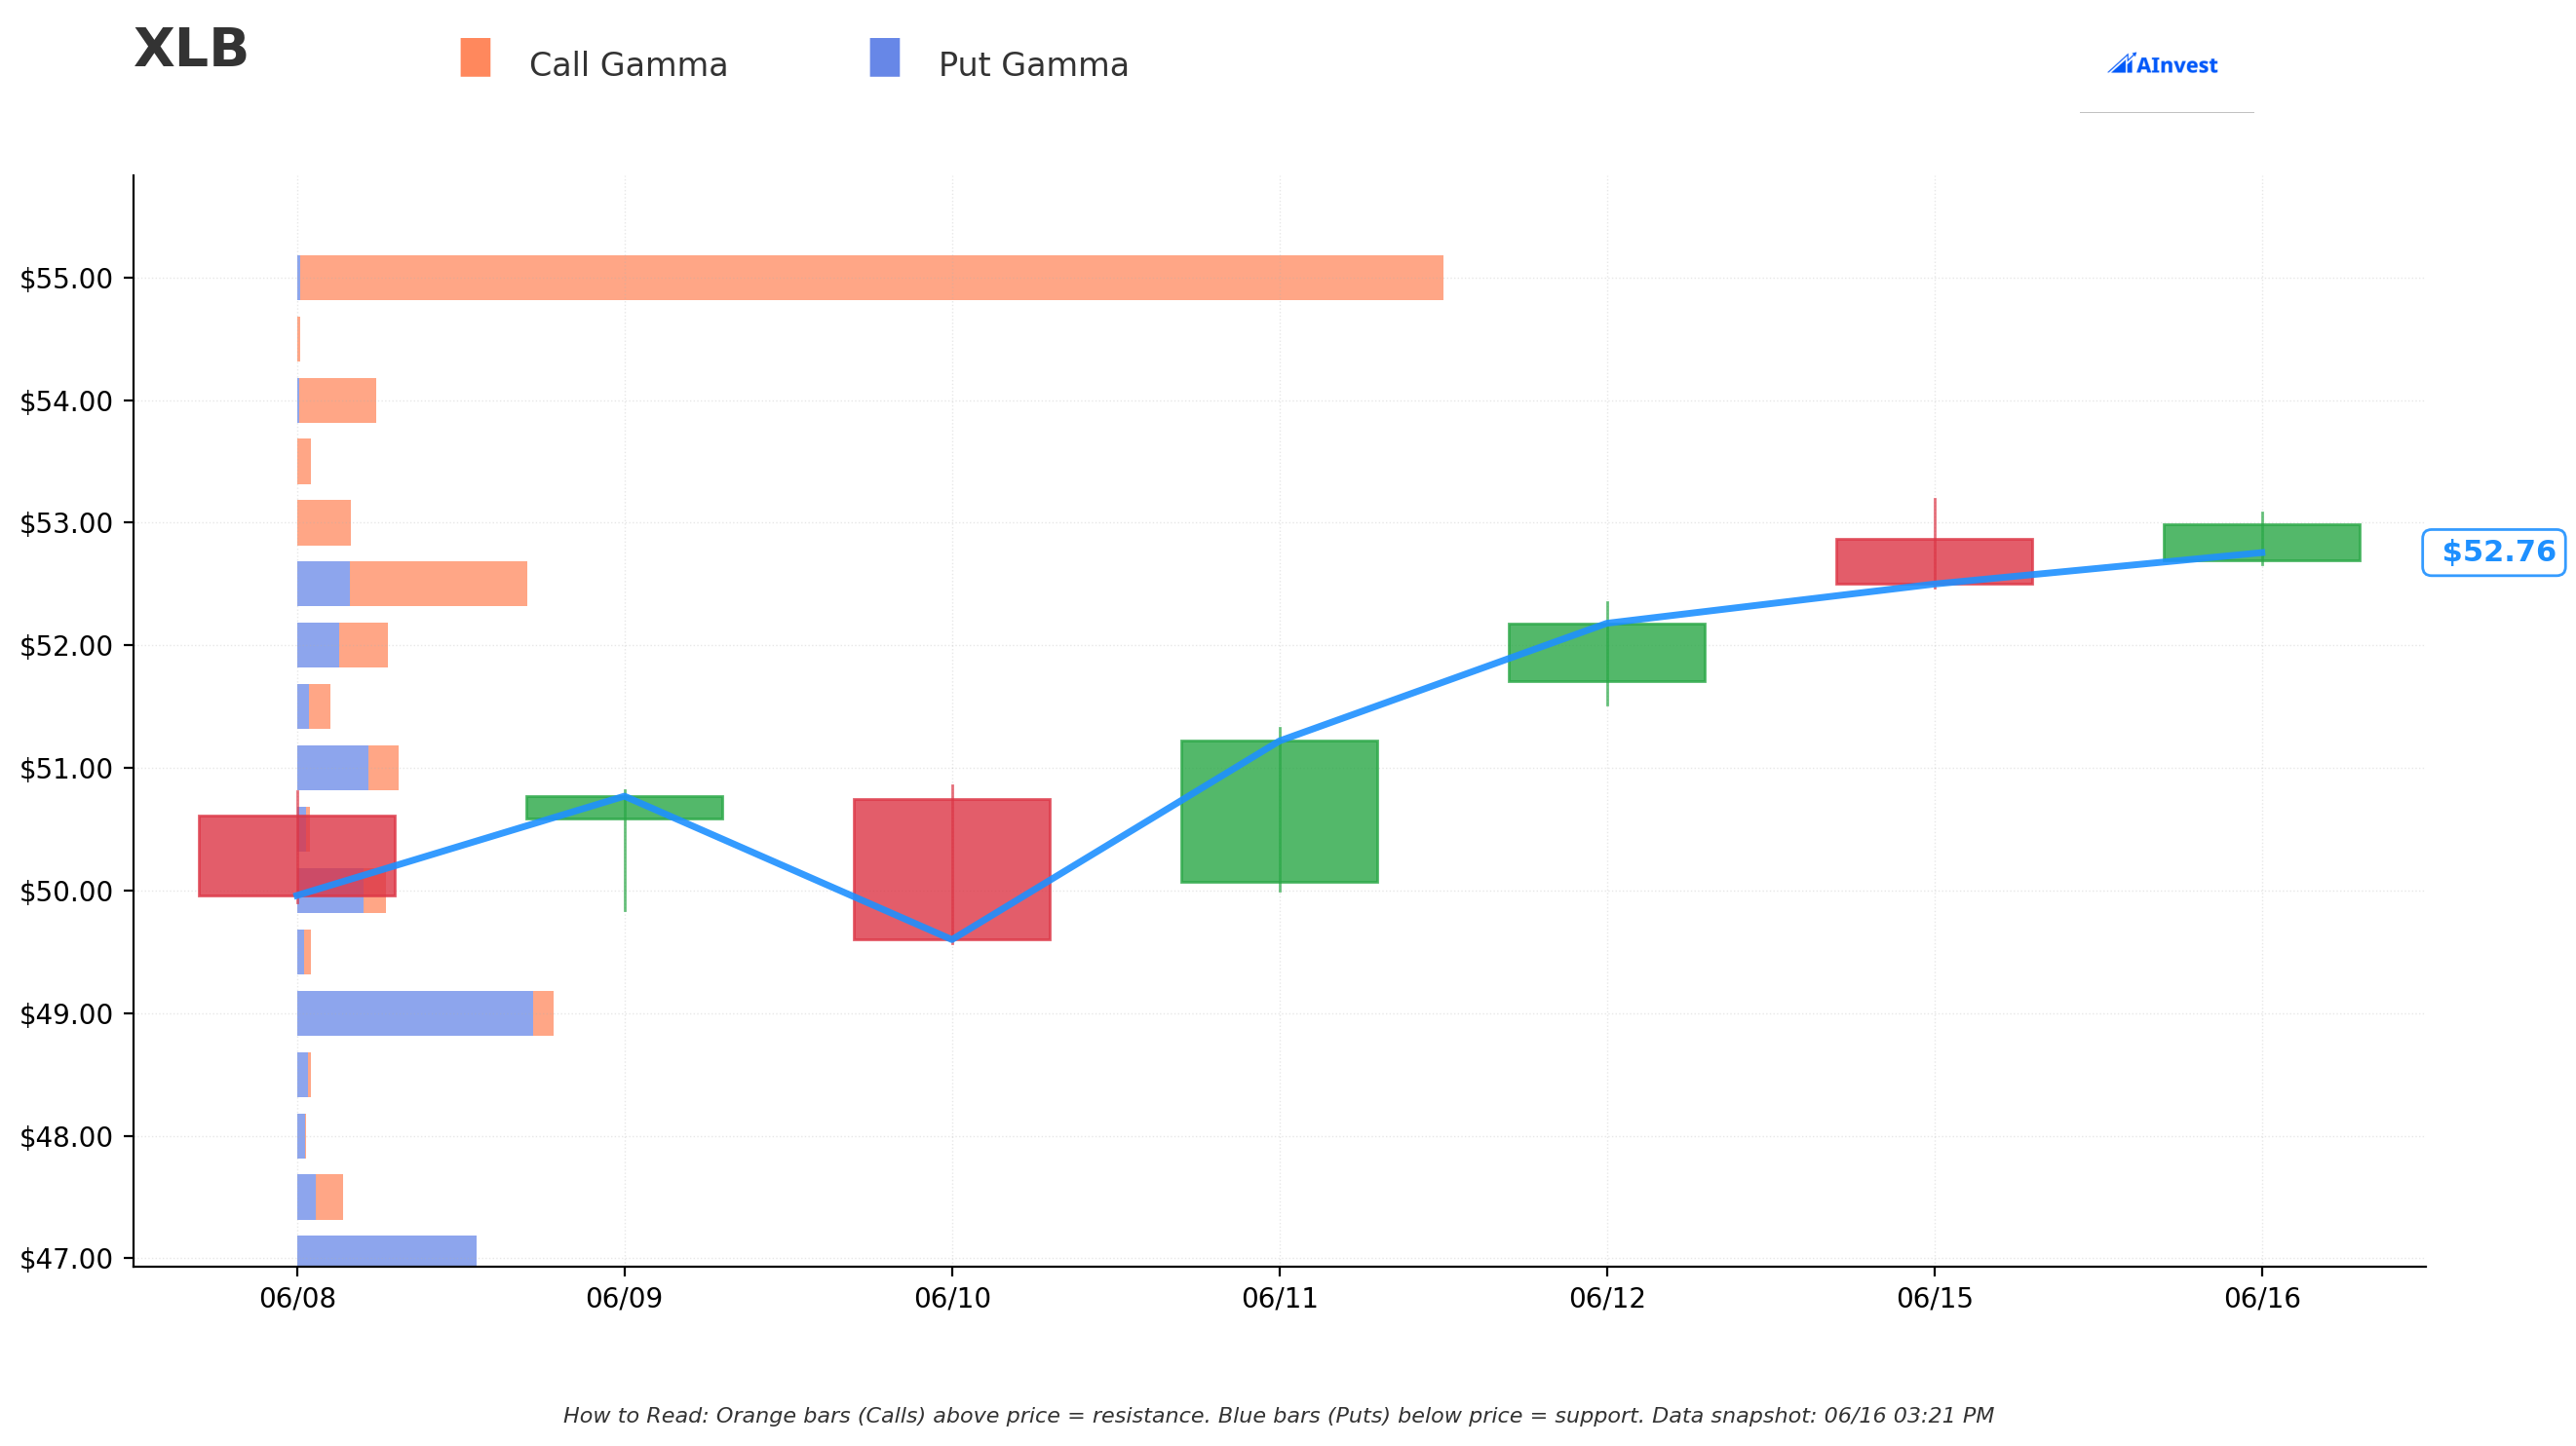
Key gamma levels from today's positioning:
| Level | Type | Strength | Distance from Spot |
|---|---|---|---|
| $55.00 | Resistance Wall | Very Strong | +≈4.3% |
| $62.50 | Resistance Wall | Strong | +≈18.5% |
| $52.50 | Support Wall | Moderate | −≈0.5% (at-the-money) |
| $49.00 | Support Wall | Very Strong | −≈7.1% |
| $47.00 | Support Wall | Moderate | −≈10.9% |
| $40.00 | (BTO crash wing) | — | −≈24.2% |
The $52.50 gamma wall is essentially at-the-money — a near-term magnetic level that should act as a short-term pin into this week's expiration (Jun 18 triple witch). The $55 call wall is the primary resistance ceiling; a break there would require significant gamma covering and could accelerate a move toward $57.50–$62.50.
On the downside, the $49 put wall (Very Strong) provides the first meaningful gamma support, and the $47 strike has its own moderate put gamma cluster — which is exactly where the short put strike sits. The existing $47 open interest creates a natural dealer-hedge anchor that tends to slow price action into that level rather than accelerate it. The $40 long wing sits far below the gamma landscape with minimal existing positioning.
Implied Move Cone
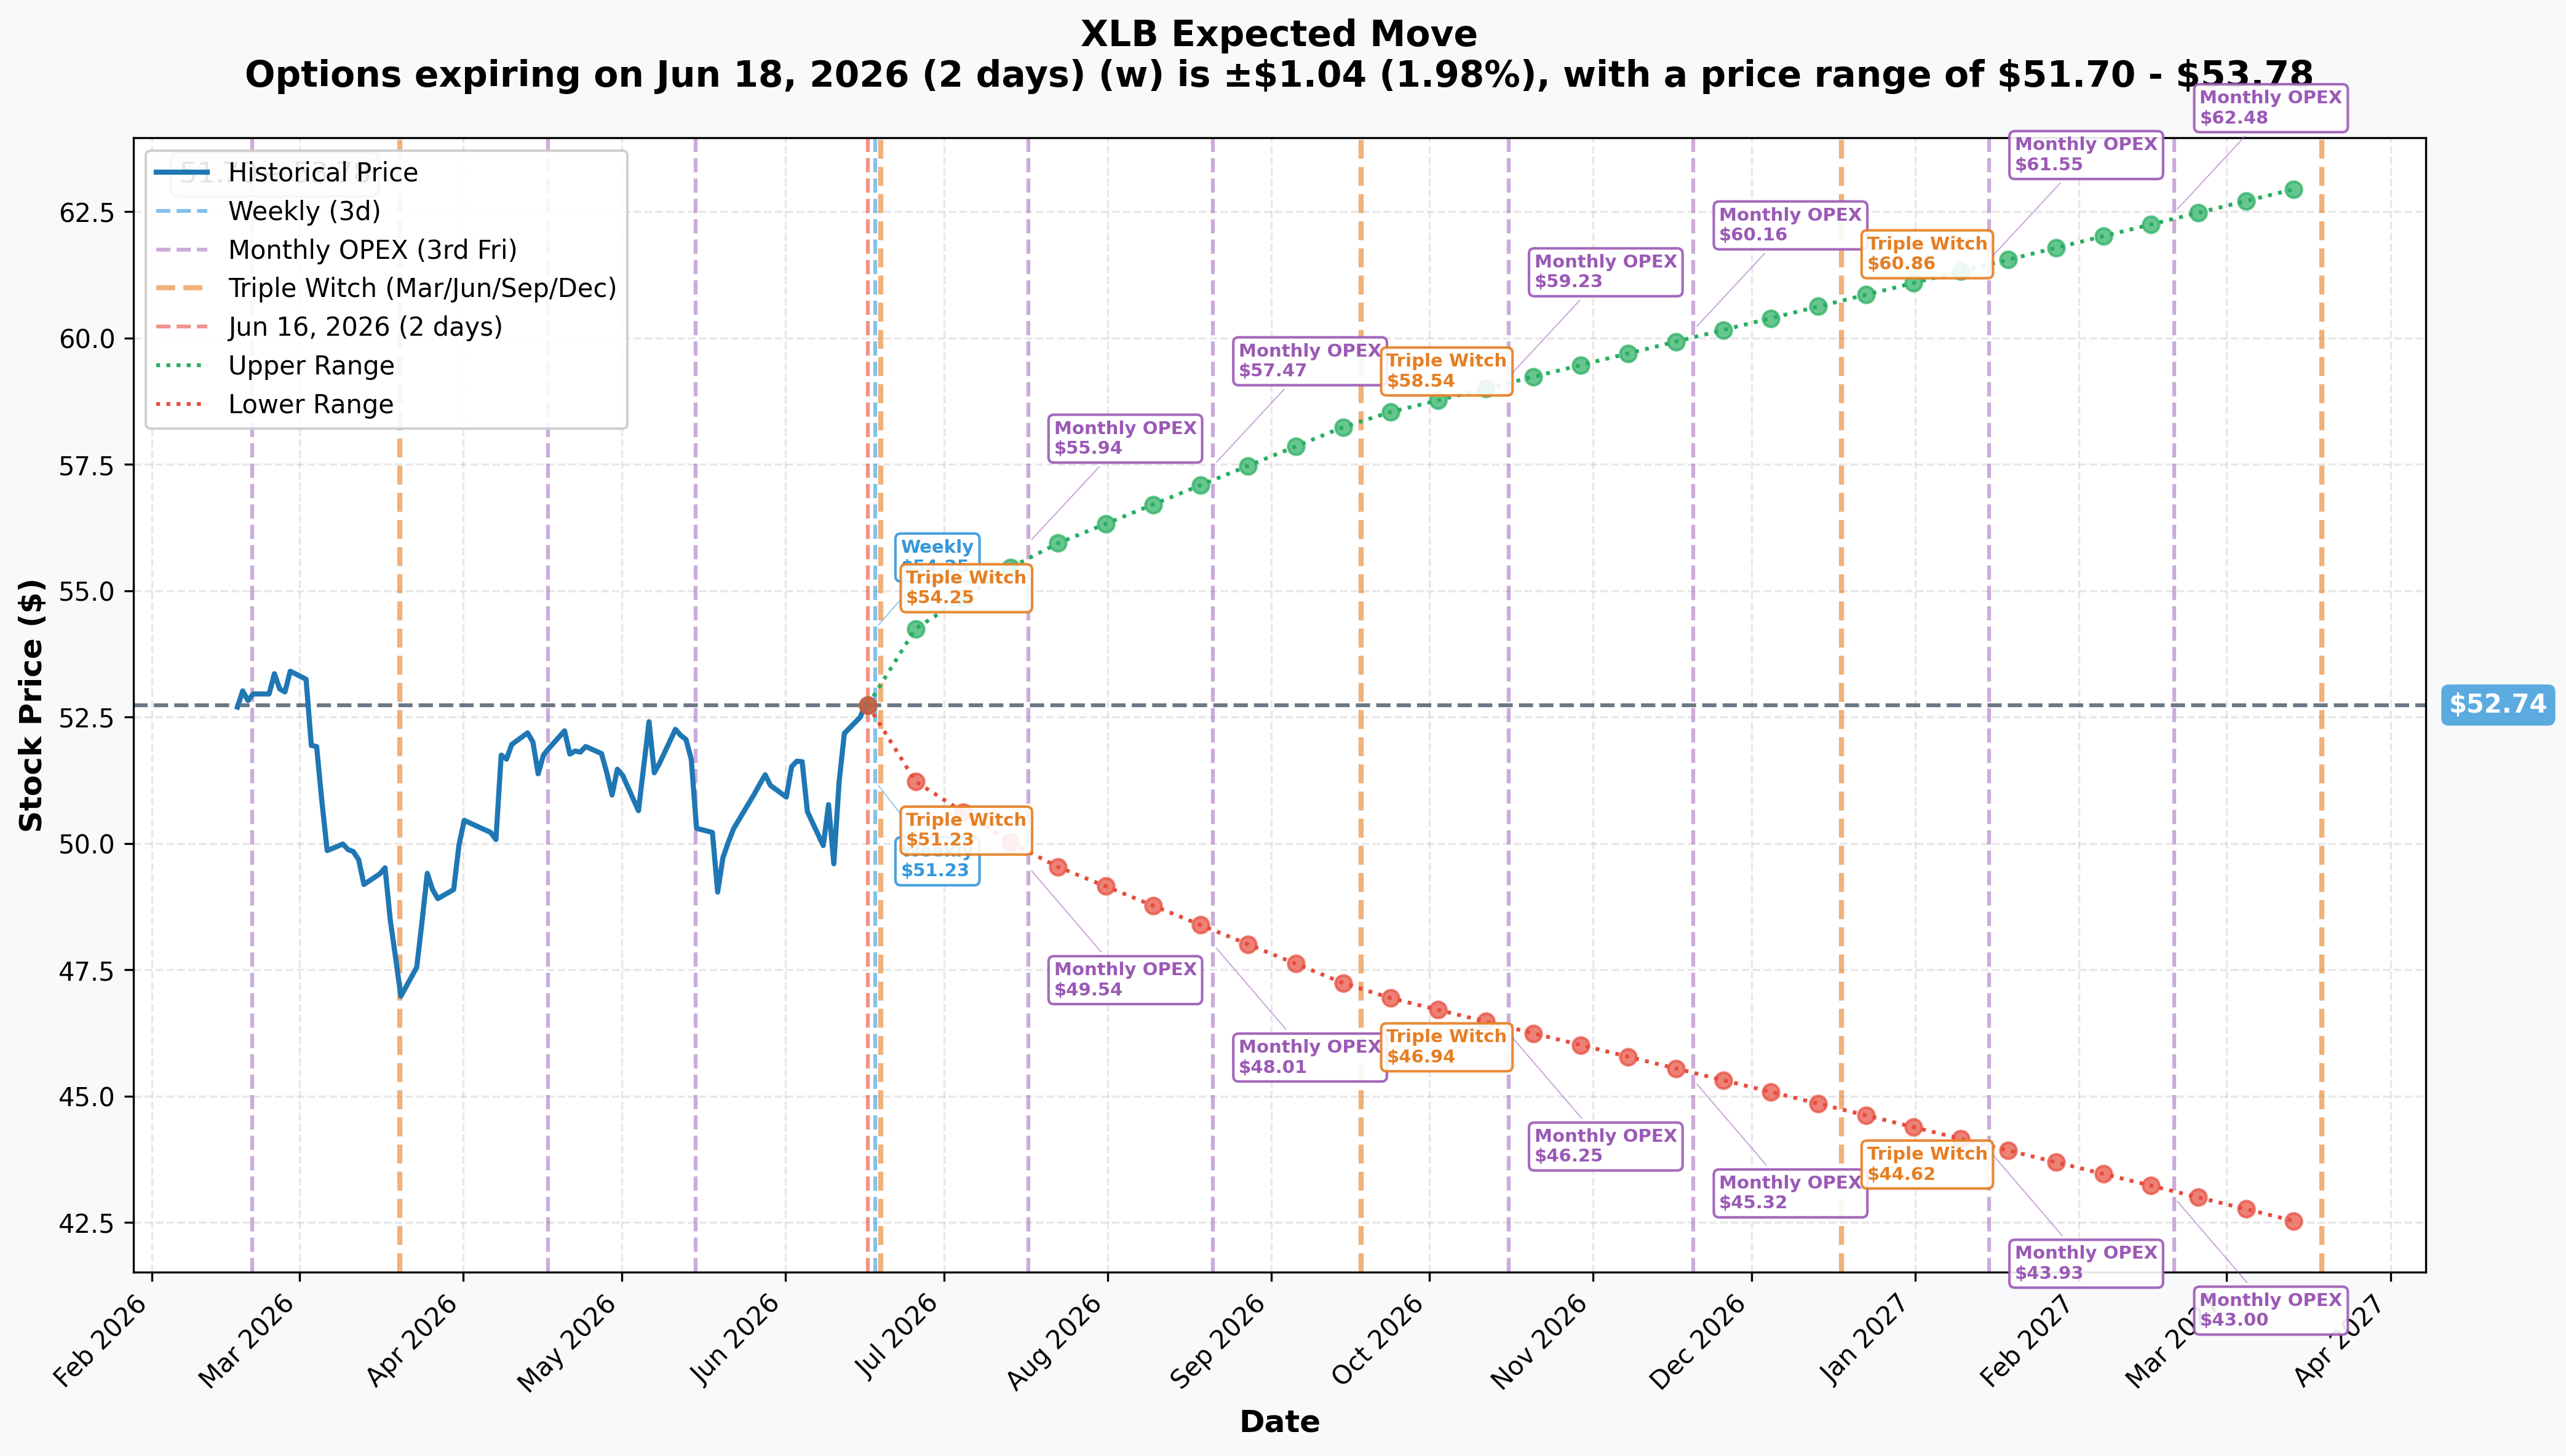
Options market implied moves (from quote-midpoint IV):
| Expiry | Type | DTE | Implied Move | Upper | Lower |
|---|---|---|---|---|---|
| Jun 18, 2026 | Weekly / Triple Witch | 2 | ≈±$1.04 (±1.98%) | $53.78 | $51.70 |
| Jul 17, 2026 | Monthly OPEX | 31 | ≈±$2.99 (±5.67%) | $55.73 | $49.75 |
| Sep 18, 2026 | Quarterly Triple Witch | 94 | ≈±$5.67 (±10.75%) | $58.41 | $47.07 |
The trade's Jul-31 expiry falls between the monthly OPEX (Jul 17, lower bound ≈$49.75) and the quarterly triple witch (Sep 18, lower bound ≈$47.07). Interpolating, the options market is pricing the lower 1-sigma bound for Jul-31 at roughly $49.50–$50.00 — comfortably above the $47 short strike. The $47 strike is ≈1.5–2 standard deviations out-of-the-money at this expiry; the $40 strike is ≈3+ sigma. That probability structure is exactly what makes this trade viable: the desk collects premium at a level the market considers a low-probability touch.
Catalysts — What Could Move XLB Before Jul 31
The Jul-31 expiry sits directly on top of a dense Q2 earnings cluster across XLB's heaviest weights:
-
Freeport-McMoRan (FCX) Q2 2026 earnings — ≈Jul 16. FCX is ≈5–6% of XLB and realized copper of $5.78/lb and gold of $4,889/oz in Q1 2026 — FCX 8-K Q1 2026. A miss on realized copper/gold prices or guidance cut would hit XLB. A beat reinforces the premium-collection thesis.
-
Newmont (NEM) Q2 2026 earnings — late July (date TBC). NEM is ≈8% of XLB and a primary beneficiary of record gold. Any gold-price reversal or cost blowout would ripple through the ETF.
-
Linde (LIN) Q2 2026 earnings — Jul 23–31. LIN is the largest weight at ≈14–15% and guided Q2 EPS of $4.40–$4.50, +8–10% YoY — Linde 8-K. LIN is the defensive earnings anchor. A miss would be the single largest single-name catalyst risk to the $47 short strike.
-
Sherwin-Williams (SHW) Q2 2026 earnings — Jul 28. SHW is ≈5% of XLB and has already guided for little-to-no end-market recovery and warned of tariff-driven raw-material inflation — StockTitan. A negative full-year guide revision on Jul 28 — three days before expiry — is a live risk.
-
China macro. China is the world's largest industrial-metals consumer, and its growth/property backdrop remains weak. ING Think and StoneX both flag that stimulus headlines routinely outrun real physical metal demand — the primary reason the desk paid up for the $40 crash wing rather than selling naked puts.
-
Fed policy path. Goldman's base case includes ≈50 bps of Fed cuts in 2026, which supports commodity returns and lowers miner borrowing costs — Goldman Sachs Commodities Outlook 2026. Any hawkish pivot would pressure XLB's cyclical names.
-
Copper re-rating. Goldman sees copper easing from records into a $10,000–$11,000/t range in 2026 — Goldman Sachs Commodities Outlook 2026. A sharp copper reversal would be the most direct catalyst to push FCX and XLB toward the short strike.
The desk is harvesting the elevated event-volatility premium that the Q2 cluster is pricing into Jul-31 expiry options. If the cluster clears without a shock, theta decay accelerates and the position benefits. If any heavy weight (particularly LIN or NEM) misses significantly, the $47 strike becomes a real test.
4-Reader Breakdown
🎯 YOLO / Short-Term Trader
This is not a YOLO setup — it is a premium-collection structure. The net credit of ≈$0.56M is income collected upfront; you would need to replicate the ratio and hold through Jul 31. For a short-term momentum play on XLB, this trade is neither here nor there. What it tells you: a desk is comfortable selling downside ≈11% below spot with a ≈45-day horizon. That is a moderately bullish signal on the trend — not a screaming bull, not a hedge.
📈 Swing Trader
The trade structure supports the view that XLB holds $47–$49 through end of July. The $49 gamma wall (Very Strong) and the $47 short-put strike cluster act as a potential floor if the sector sells off. A swing long with a stop below $47 (the short strike) is consistent with this institutional structure. Watch the $55 resistance wall as the target — it is the primary call gamma ceiling.
💰 Premium Collector / Options Income Trader
This is your playbook. A ratioed bull put spread like this captures: (1) the ≈5–6% 31-day IV on XLB (options market pricing ≈±$2.99 to Jul 17 OPEX), (2) the event-vol premium from the earnings cluster, and (3) the carry from a credit-positive ratio. The structure also avoids the naked-put risk that most retail premium sellers face — the extra long $40 puts define the catastrophic tail. The key risk to manage is the $40–$47 gap; if XLB closes in that zone on Jul 31, losses on the short $47 puts are partially offset but not fully covered by the long $40 wing on a 1:1 basis (the ratio helps but does not eliminate the gap-zone risk).
🌱 Beginner
Think of it this way: the desk is like a landlord who collects ≈$0.56M in rent for the month of July in exchange for agreeing to buy XLB at $47 if it falls that far. But unlike a regular landlord, they also bought a cheap catastrophe insurance policy (the $40 puts) that pays out if there is a genuine disaster. The rent collected up front is real money — the risk is that XLB drops from $52.9 to somewhere between $40 and $47 by July 31, which is the "hurt zone." Above $47 or below $40 — the structure either makes money or at worst breaks even on the wing.
Risks and Honest Limits
What the tape tells us:
- Both legs executed simultaneously as a facilitated multi-leg auction — a broker-worked complex order with a known counterparty. This is negotiated flow, not urgent lit-market aggression.
- Both legs printed against prior OI of 0, confirming these are fresh opening positions (STO + BTO). This is the strongest available open/close signal; next-morning OI confirmation (≈06:30 ET, Jun 17) remains the definitive check.
What the tape cannot tell us:
- The identity of the desk, the counterparty, or the broker/MMID.
- Whether this is a standalone directional bet, part of a larger portfolio hedge, or a structured income overlay against a long XLB position.
- Whether the desk has additional hedges (stock, futures, other options) not visible in this print.
Key risks to the structure:
- The $40–$47 gap zone is where the position loses money. A controlled ≈11–24% selloff in XLB — bad enough to trigger the short puts, not bad enough to overwhelm them with the crash wing — is the primary pain scenario. This requires a China shock, a broad macro downturn, or a negative earnings cluster outcome (LIN in particular) before Jul 31.
- Linde (LIN) earnings risk is the single largest identifiable catalyst. At ≈14–15% of XLB, a large LIN miss landing within the Jul 23–31 window could push XLB sharply toward $47 with almost no time to recover before expiration.
- Copper re-rating — Goldman's expectation of copper easing from records in 2026 is a persistent medium-term headwind for FCX/NEM and by extension XLB's cyclical sleeve — Goldman Sachs.
- China demand risk — A growth or property-sector disappointment is the primary reason the desk bought the $40 crash wing. This is the live tail risk the structure is explicitly hedged against — Oxford Economics.
Options trading involves substantial risk and may not be suitable for all investors. This analysis is for informational purposes only and does not constitute investment advice. The discussion of third-party institutional trades does not imply any endorsement of or recommendation to replicate those positions.
Bottom Line
A desk structured a ratioed bull put spread on XLB — collecting ≈$0.56M net credit (net, not gross) while simultaneously buying a cheap crash wing at $40. The short $47 puts sit ≈11% below spot and below the 52-week range midpoint; the long $40 puts are ≈24% out and provide convex protection if XLB gaps into a genuine selloff. The position profits in three scenarios: XLB holds (full credit kept), XLB rallies (full credit kept), or XLB collapses below $40 (excess long puts profit). The only loss scenario is a controlled grind into the $40–$47 zone.
The thesis is supported by XLB's +16% YTD trend, a defensive ≈14–15% Linde anchor guiding +8–10% EPS, and precious/strategic metals at historically elevated levels. The primary risks — LIN earnings, China macro, copper reversal — are precisely what the crash wing is priced to hedge. The Jul-31 expiry straddles a dense Q2 earnings cluster (FCX ≈Jul 16, NEM late July, LIN Jul 23–31, SHW Jul 28), so premium collected today reflects real event vol embedded in those dates.
The dominant technical features — the $52.50 at-the-money gamma wall as a near-term pin, the Very Strong $49 put support, the $55 call resistance ceiling — are all consistent with the desk's view that XLB grinds sideways-to-up rather than breaking down through $47 before month-end.
Catalyst score: 6.5/10 — dense, dated catalyst cluster with meaningful magnitude but two-sided and macro-dependent.
✅ RESOLVED (2026-06-17): Next-day OPRA OI confirmed both legs opened — $47 strike +45,000 and $40 strike +54,003, both matching the sizes traded. The ratioed bull put spread is a genuine new position.
Last updated: 2026-06-17 — next-day OPRA OI confirmed both legs as fresh opens ($47P +45,000, $40P +54,003).