🏭 XLI: The $170 Puts Were CLOSED, Not Sold Short — This Is a Hedge Rolled Up, and the Crash Tail Never Existed
2026-08-12 | 🤝 Floor Block | Resolved 2026-08-13: Reading B confirmed — $170 leg CLOSED (−30,380), no naked short
🔄 Updated 2026-08-13 pre-market — the next-day OPRA open interest resolved the $170 leg, and it inverted onto Reading B. Open interest at the $170 strike fell 80,261 → 49,881 (−30,380) against 70,000 sold, while the $175 strike rose 321 → 55,274 (+54,953) — 99.9% of its print. We published the decision rule explicitly: "If $170 OI falls by roughly 70,000 → it was a close → Reading B (roll-up, no tail)." It fell. The provisional STO label is retired in favour of STC. There is no naked short leg and no open-ended crash tail — this is an existing hedge being pulled closer to the money. The title and framing have been updated. See the ✅ RESOLVED box.
🎯 The Quick Take
At 12:03:40 ET, a desk crossed a floor block in XLI — the Industrial Select Sector SPDR Fund — buying 55,000 November-20 $175 puts and selling 70,000 November-20 $170 puts for a net debit of roughly $1.96M. Because the two sides are deliberately unequal in size, this isn't a simple bearish bet — it's a ratio put spread that makes the most money if XLI drifts down to exactly $170 by expiration, and only turns genuinely dangerous if the fund crashes more than 17.8% from here. Read that twice — it's the whole story, and most quick takes on a trade like this get the risk backwards.
🏗️ Fund Overview — What XLI Actually Holds
XLI tracks the industrials slice of the S&P 500 — think heavy machinery, aerospace and defense, electrical equipment, and railroads, not consumer-facing names. It's one of the oldest and most liquid sector SPDRs, trading with a 0.01% median bid/ask spread.
| Attribute | Value |
|---|---|
| AUM | $34,642.80M (≈$34.64B) |
| Expense ratio | 0.08% |
| Holdings | 83 |
| Inception | December 16, 1998 |
| 52-week range | $147.14 – $188.19 |
| P/E · beta · dividend yield | 29.48 · 1.00 · 1.11% |
💼 Top 10 Holdings — Nearly Half the Fund in Ten Names
| # | Holding | Weight |
|---|---|---|
| 1 | Caterpillar Inc. (CAT) | 6.65% |
| 2 | GE Aerospace (GE) | 6.58% |
| 3 | RTX Corp | 5.16% |
| 4 | GE Vernova (GEV) | 4.66% |
| 5 | Boeing Co. | 3.15% |
| 6 | Eaton Corp | 3.05% |
| 7 | Union Pacific Corp | 2.98% |
| 8 | Uber Technologies | 2.74% |
| 9 | Deere & Co. | 2.66% |
| 10 | Parker Hannifin | 2.29% |
| Top 10 combined | ≈44.22% |
By industry, aerospace/defense (26.29%) + machinery (20.20%) + electrical equipment (13.70%) = 60.19% of the fund. Add ground transport (9.85%), air freight (3.24%) and airlines (2.10%) — the classic "cycle-turns-first" cyclical tail — and you're looking at ≈75% of XLI in genuinely economically sensitive businesses. This is not a defensive ETF. All figures per the fund sponsor.
💰 The Trade, Plain English
Someone crossed two big option orders at the same moment, at unequal size — that mismatch is the whole point of this trade:
- 🔵 Bought 55,000 November 20, 2026 $175 puts at $3.41 → ≈$18.76M paid
- 🔴 Sold 70,000 November 20, 2026 $170 puts at $2.40 → ≈$16.80M collected
- Net: ≈$1.96M paid out of pocket
Both legs printed as a 🤝 negotiated floor block — a known counterparty on the other side, worked off the open book, not a lit sweep. There's no urgency signature here; this was arranged in advance at an agreed price.
| Time | Buy/Sell | Call/Put | Expiration | Premium | Strike | Volume | OI | Size | Spot | Option Price | Option Symbol |
|---|---|---|---|---|---|---|---|---|---|---|---|
| 12:03:40 | BUY | PUT | 2026-11-20 | ≈$18.76M | $175 | 55,000 | 321 | 55,000 | $186.12 | $3.41 | XLI20261120P175 |
| 12:03:40 | SELL | PUT | 2026-11-20 | ≈$16.80M | $170 | 70,000 | 80,261 | 70,000 | $186.12 | $2.40 | XLI20261120P170 |
Because it's a negotiated floor block that took no displayed liquidity, the BUY/SELL labels above are reported by the tape's side-flag, not proven by an aggressor read. There's no percent-across-the-spread test or IV-through-print check that applies here — both only work on trades that take liquidity, and this one didn't.
55,000 bought against 70,000 sold is not a 1:1 vertical. That extra 15,000 contracts sold naked at $170 is what turns a plain-vanilla bear put spread into something with meaningfully different — and larger — risk.
🔄 RESOLVED 2026-08-13 — that leg WAS a close. The 70,000 contracts sold at $170 landed against ≈80,261 already outstanding, and the next-day OPRA snapshot showed open interest at $170 fell 80,261 → 49,881 (−30,380). No net new short was opened. The structure is therefore Reading B — a hedge rolled up from $170 to $175 — which means there is no naked short leg and no open-ended crash tail. The ratio-put-spread analysis that follows is retained for transparency but is withdrawn as the operative read; see the ✅ RESOLVED box above.
✅ RESOLVED — Reading B Confirmed: a Hedge Roll-Up, Not a Ratio Spread
Updated 2026-08-13 pre-market. Resolving OPRA snapshot timestamped August 13 (reflects the August 12 close, after this print); baseline is the August 12 snapshot (reflects the August 11 close, before this print).
| Leg | Baseline (Aug-12) | Resolving (Aug-13) | Δ | Print size | What we published | Verdict |
|---|---|---|---|---|---|---|
| Nov-20 $175 put (bought) | 321 | 55,274 | +54,953 | 55,000 | "size ≫ prior OI ⇒ genuinely new long position. Proven open." | ✅ OPEN (BTO) — 99.9% of size |
| Nov-20 $170 put (sold) | 80,261 | 49,881 | −30,380 | 70,000 | "if $170 OI falls → it was a close → Reading B (roll-up, no tail)" | 🔄 CLOSE (STC) — was STO ⏳; 43% of the print retired |
This is the inversion that matters most for risk, and it resolves in the reader's favour. The article laid out two structures with very different risk profiles and refused to pick between them. Reading A — the ratio put spread, net short 15,000 puts, with a genuine open-ended tail below $152.97 — required $170 open interest to rise. It fell by 30,380.
So Reading B is what happened. A desk that already owned $170 puts closed a large slice of them and opened 55,000 $175 puts, pulling downside protection from 8.7% below spot to 6% below spot ahead of the September Fed meeting. Retire the crash-tail analysis entirely: there is no naked short put leg, no unbounded downside obligation, and no "targeting an 8.7% slide" bet. This is a hedge being tightened, which is a more defensive posture, not a speculative one.
Direction decisive, magnitude partial. 30,380 contracts retired against 70,000 sold (43%) — enough to rule out any net new short at $170, not enough to claim the full 70,000 came off. Roughly 39,620 transferred between holders. Net across both strikes, put open interest at these two lines went 80,582 → 105,155 (+24,573), so the desk's aggregate downside protection increased while moving up a strike.
Control check. The move is strike-specific: November $165P 119 → 119 (0), $168P 10 → 10 (0), $180P 2,145 → 2,152 (+7). Nothing chain-wide happened to XLI puts.
#> 🔄 Retraction notice (2026-08-13): the section below was written on the unresolved assumption that the $170 leg opened a fresh short (Reading A). Next-day open interest proved it closed. Read it as background on how a ratio put spread would have worked — not as a description of this trade. The crash-tail risk it describes does not exist in the structure that actually printed.
🤓 What This Actually Means — Plain English
Let's build this from scratch, because a ratio put spread behaves differently from a normal bear put spread and the shape genuinely surprises people.
Step 1: two puts, unequal amounts. The desk is long 55,000 puts at $175 and short 70,000 puts at $170, same expiration. If the sizes were equal (say 55,000 and 55,000), this would be a plain bear put spread — max profit capped, max loss capped, done. But 70,000 is bigger than 55,000. Subtract the matched portion (55,000 of each) and what's left over is 15,000 naked short $170 puts — an obligation, not a hedge.
Step 2: why the position gains as spot falls from $175 toward $170. Above $175, everything's worthless and the position just bleeds a little time value — max loss here is the ≈$1.96M debit, fully realized at any price at or above the upper breakeven of $174.64. Between $175 and $170, the 55,000 long puts gain intrinsic value dollar-for-dollar (55,000 × $100 = $5.5M per $1 move), while the 70,000 short puts are still worth $0 because spot hasn't dropped below $170 yet. So the whole package gets more valuable the further price falls — right up until spot hits $170.
Step 3: why $170 is the peak, not just another point on the way down. At exactly $170, the 55,000-lot $175/$170 spread is worth its maximum possible value — $5 wide × 55,000 contracts × $100 = $27.5M — while the short $170 puts are still exactly at the money, contributing nothing yet. Net of the ≈$1.96M debit, that's ≈+$25.55M, or ≈13.1× the money risked. This is why the position is engineered to peak at precisely the short strike — it's the largest price point where the long spread is maxed out and the short puts haven't started costing anything.
Step 4: why it gets worse below $170, but slowly. Once spot drops under $170, the 15,000 uncovered short puts start to bite. Every additional $1 down: the long 55,000 puts keep gaining $5.5M, but the full 70,000 short puts now lose $7.0M — net, the position sheds ≈$1.5M per point. At $168.70 it's still worth ≈+$23.6M; a modest slide below the peak does not wipe out the trade.
Step 5: the actual danger — a genuine crash. Because that $1.5M-per-point bleed compounds, eventually it eats through the entire $27.5M cushion. That happens at $152.97 — a 17.8% drop from today's $186.12 spot. Below that line, the loss is open-ended: at $140 the position is down ≈$19.5M; at $120, ≈$49.5M. That's the real exposure this structure carries, and it's a legitimate risk to flag — but it sits far further away than a naive "debit ÷ naked contracts" calculation would suggest, and it only exists at all under Reading A.
Bottom line on structure: this is a hedge that pays off best on a controlled, moderate decline — and turns into an unhedged short-put liability only in a scenario well beyond what the position was seemingly built for. That gap between "designed outcome" and "worst case" is exactly why position sizing and the extra 15,000 short puts deserve real respect, even if the odds of a 17.8% XLI crash by November 20 are low.
| Level | Outcome |
|---|---|
| Above $174.64 | Total loss of the ≈$1.96M debit — upper breakeven |
| $170.00 | Maximum profit ≈+$25.55M — ≈13.1× the debit |
| Below $170 | Value decays ≈$1.5M per point as the 15,000 naked shorts bite |
| $152.97 | Lower breakeven, −17.8% from spot |
| Below $152.97 | Genuine open-ended loss |
📈 Technical Setup
YTD Chart
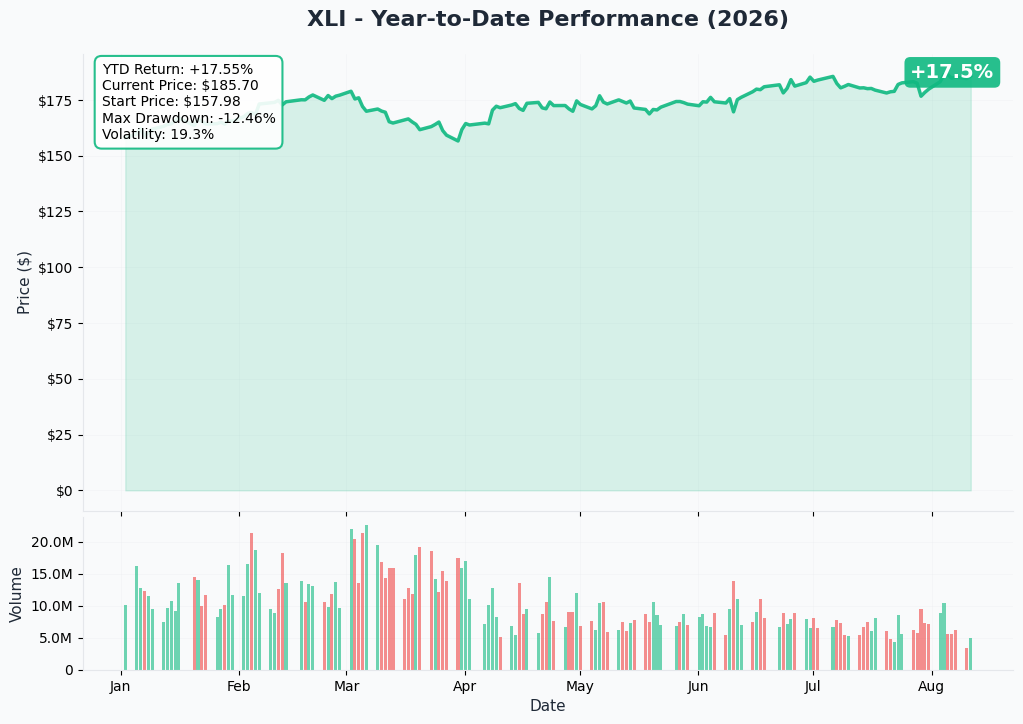
XLI is ≈1% below its 52-week high of $188.19, having compounded a strong year — +16.50% NAV YTD through July 31 and +19.77% over one year. But that path wasn't smooth: a −3.02% July drawdown was followed by an August recovery back near the highs. An 8.7% slide to $170 by November would be roughly three times the size of the move that already happened once this quarter.
🔵🟠 Gamma-Based Support & Resistance
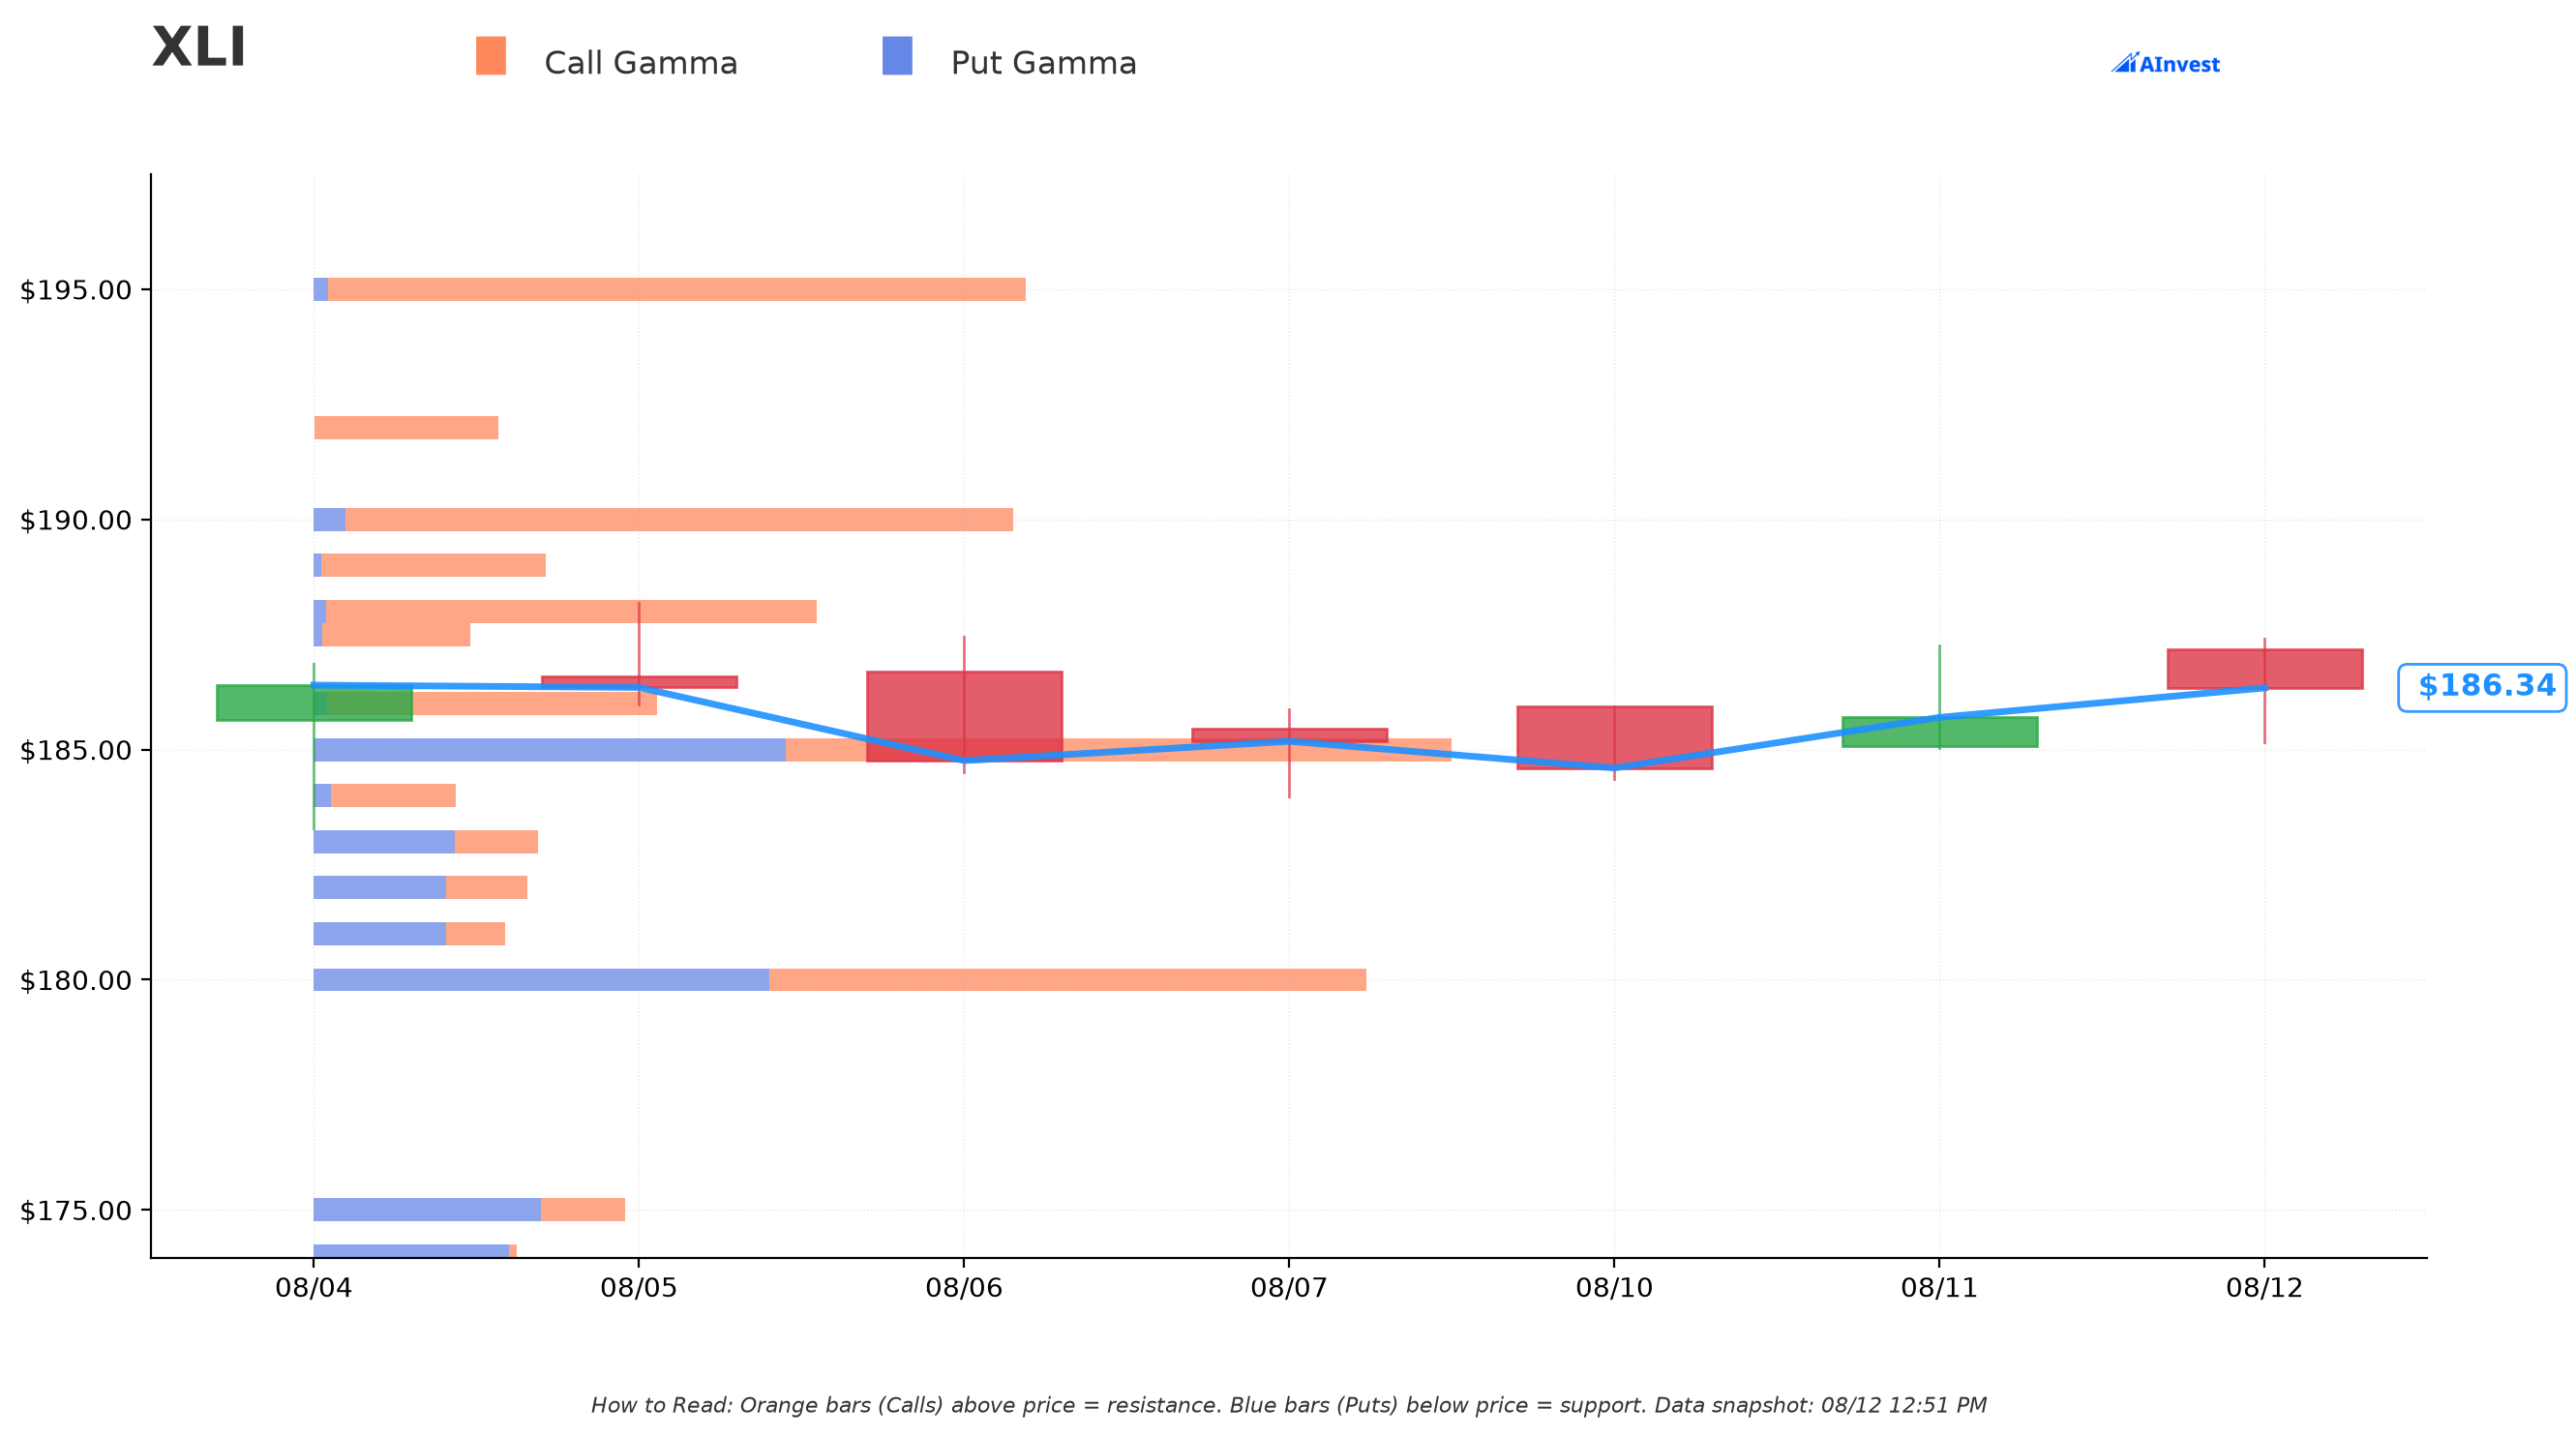
With spot at $186.33, the dealer-inferred gamma map shows:
- Resistance: $190 (Strong) — the nearest meaningful ceiling above spot, ≈2.0% away.
- Support: $185 (Very Strong) — right beneath current price, ≈0.7% away.
- Further out, there's a large Support Wall at $170, put-dominated — the same level where this trade's max profit sits. That's a striking coincidence worth flagging, but remember: these gamma levels are inferred from open interest and a dealer-positioning assumption, not observed dealer data, so it's a correlation to note rather than a causal reason to trust the trade.
- There's also a modest Moderate support reading right at $175, matching the long-put strike.
Gamma levels shift intraday as new trades print — treat these as a current snapshot, not a fixed line in the sand.
🎢 Implied Move
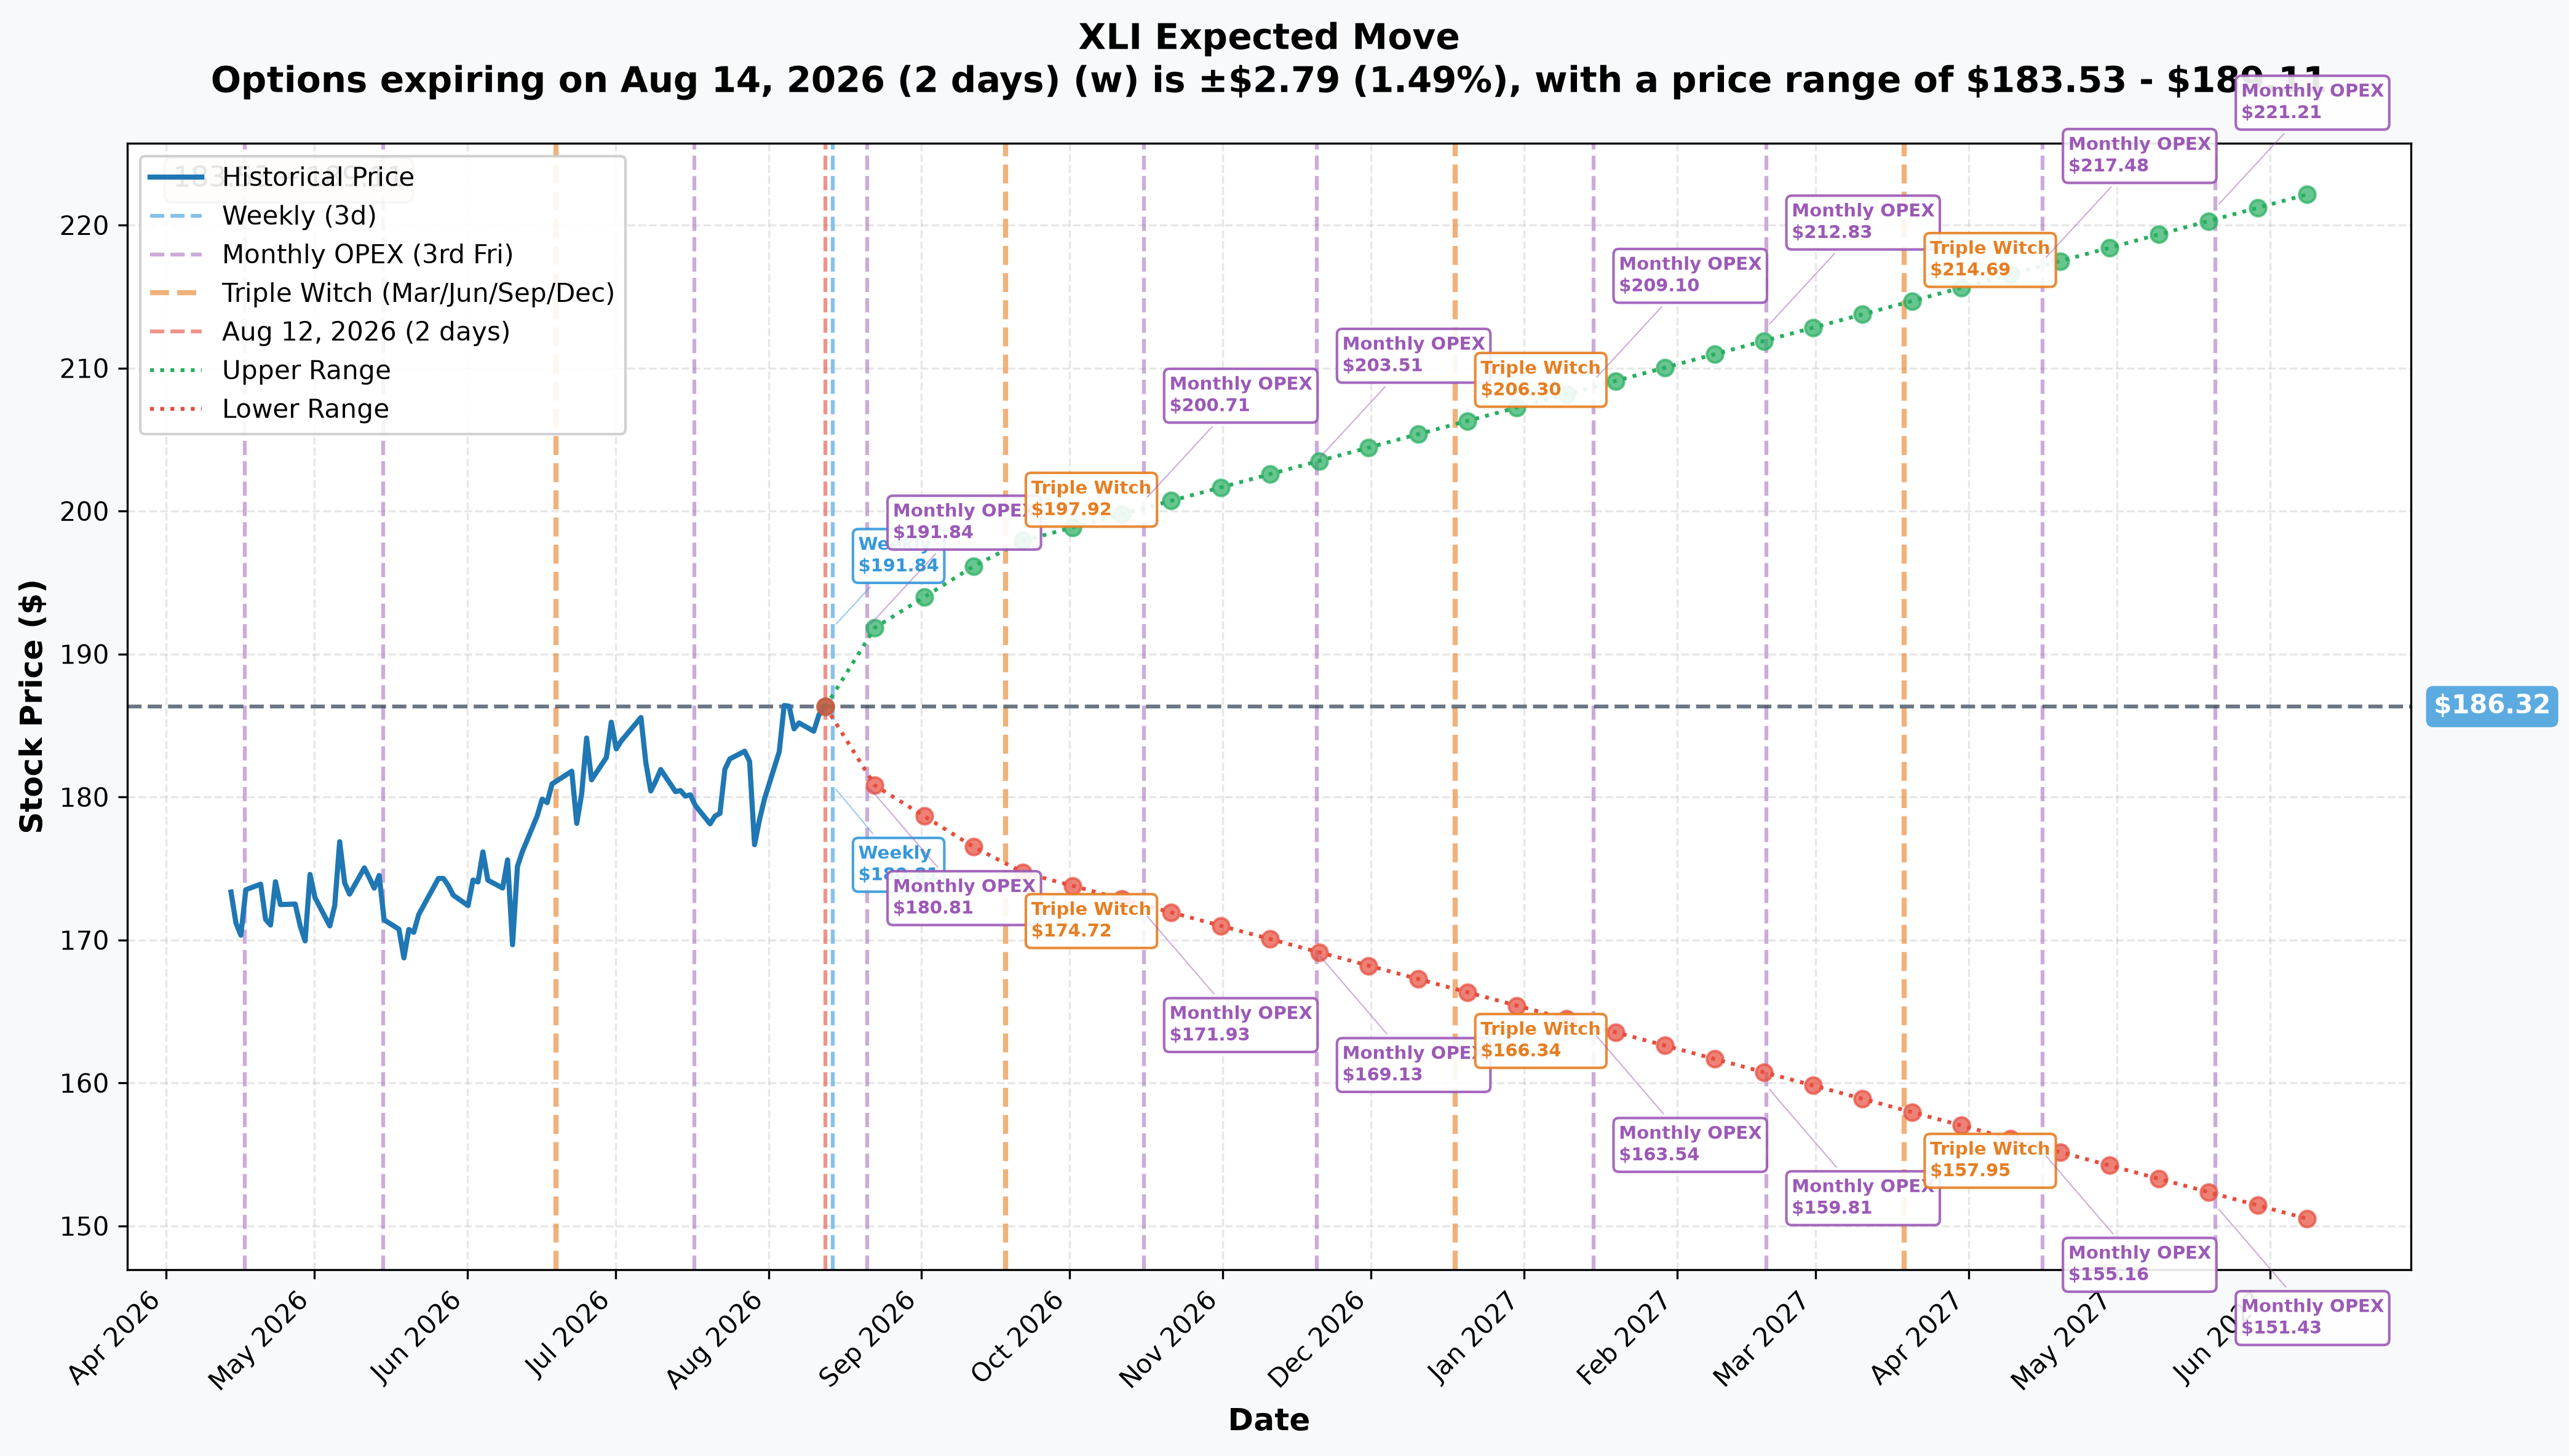
| Horizon | Implied move | Range |
|---|---|---|
| To Aug 14, 2026 | ±1.49% | $183.53 – $189.11 |
| To Aug 21, 2026 | ±2.84% | $181.02 – $191.62 |
| To Sep 18, 2026 | ±6.07% | $175.00 – $197.64 |
Look closely at that five-week number: the market's own implied range to September 18 has a lower bound of exactly $175.00 — the long put strike in this trade, and nowhere close to the $170 profit-max target, let alone the $152.97 crash threshold. In other words, the options market is not currently pricing the move this position needs to hit its sweet spot inside the near term — the desk is betting on something the standard implied-vol curve doesn't yet reflect, whether that's a slow bleed into November or a specific catalyst (see below) repricing the tape between now and expiry.
🎪 Catalysts
Keep two calendars separate: the catalysts below are inputs; the November 20, 2026 option expiration — 100 calendar days from today — is the settlement date. Nothing below is the expiry itself.
Confirmed, inside the window
- August 18 — Industrial Production & Capacity Utilization, July data, 9:15 ET. Direct hard-data read on 60%+ of the fund.
- August 19 — a 50% Section 338 tariff on ≈$16B of Canadian goods takes effect.
- August 20 — Deere & Co. fiscal Q3 earnings, confirmed — the first single-name catalyst the position faces, and the sector's cleanest read on tariff pass-through (Deere already booked a $272M one-time tariff refund this year). Deere's fiscal Q4 falls after November 20 and is outside this window.
- August 26 — Advance Durable Goods, July data, 8:30 ET.
- September 1 — ISM Manufacturing PMI, August data — the highest-beta sentiment print for the sector.
- September 15–16 — FOMC meeting with a Summary of Economic Projections. The July 29 statement held rates at 3.50%–3.75% on a 9-3 vote, with three members (Hammack, Kashkari, Logan) dissenting in favor of a 25bp hike. Markets currently price ≈77% odds of a September hike. This is the single highest-variance date inside the entire window, and it's the whole thesis for a rate-sensitive, 29.5×-P/E cyclical sector near all-time highs.
- September 18 — Industrial Production, August data.
- October 16 — Industrial Production, September data.
- October 27–28 — second FOMC meeting (no SEP) confirmed.
- November 17 — Industrial Production, October data — the last macro print, three days before expiry.
- December 8–9 — FOMC meeting — falls after November 20 expiry and does not affect this position.
Inferred / modeled, inside the window (not company-confirmed)
- ≈October 1 and ≈November 2 — next two ISM Manufacturing releases (expected on the standard first-business-day cadence, not individually confirmed).
- ≈October 16 – November 5 — Q3 earnings for GE, GEV, RTX, UNP, BA, ETN, CAT and UBER, covering ≈35% of fund weight. This window is modeled from each company's Q2 report date, not a confirmed calendar — none of the top-ten holdings had published a specific Q3 2026 date as of this writing. CAT's Q3 consensus EPS is $6.36.
The macro split — both sides, honestly
- Bull case: ISM Manufacturing hit 55.6 in July — the strongest factory reading since May 2022, rising three months straight. Caterpillar posted record Q2 sales of $20.5B, up 24% year-over-year, and raised full-year guidance on AI data-center demand. GE Vernova's backlog sits at $176B on orders up 88%. Unfilled durable goods orders are at $1.59 trillion, up 23 of the last 24 months.
- Bear case: Industrial production rose just 0.1% month-over-month in June, manufacturing output was flat, and capacity utilization sat at 76.1% — 3.3 points below its long-run average — a hard-data picture that doesn't match a 55.6 survey reading. On tariffs, the regime changed twice this year: the Supreme Court struck down the IEEPA tariff program 6-3 on February 20, 2026, triggering ≈$166B of refunds, but Section 301 tariffs then hit ≈$949B of imports (28% of the total) on July 24, and the Canadian Section 338 tariff lands inside this very window on August 19.
The honest read: the survey data says the cycle is accelerating, the hard data says it's barely growing, and a Fed that just split 9-3 toward a hike is the wildcard that decides which one the market believes by November.
🎭 Four Ways to Read This Trade
🎲 The YOLO trader
You don't have $1.96M to spread across two strikes with unequal size. But the shape is copyable at retail scale: a small ratio put spread lets you target a specific down-move with leverage, as long as you understand the extra short puts are a real obligation, not free money. Sizing the naked portion so a genuine crash doesn't wreck your account is non-negotiable — this desk risked ≈$1.96M to control $255M of naked put notional on the short side; scale that math down, don't skip it.
📈 The swing trader
The September 15–16 FOMC is 34 days out and sits almost exactly at the middle of this trade's timeline. If you want directional exposure into that specific date without the crash-tail risk, a plain vertical put spread (equal size both legs) captures the "moderate decline" thesis with a hard-capped loss — no naked short leg to worry about if the tape gaps.
💰 The premium collector
The 70,000-lot $170 short puts alone collected ≈$16.80M. If you're inclined to sell downside premium on XLI, do it with your eyes open about the naked-put math above — selling puts without an offsetting long is a bet you're comfortable owning shares (or eating the loss) well below your strike. This desk paired it with a long spread; a retail premium seller usually shouldn't go fully naked at this kind of size relative to their account.
🌱 The beginner
Skip trying to replicate this one. A ratio spread is an intermediate-to-advanced structure precisely because the risk isn't intuitive — most people assume "sold more puts than I bought" means "I collected extra premium for free," when it actually means "I took on an uncapped obligation below a certain price." If you're new to options, a single long put (simple downside insurance, capped cost, no naked leg) is the more honest way to express a bearish view on XLI while you learn.
⚠️ Honest Limits — What We Don't Know
- This was a negotiated floor block that took no liquidity. The BUY/SELL labels are reported from the tape's side-flag, not proven by an aggressor test — there is no percent-across-the-spread or IV-through-print check that applies to a trade like this.
- The $170 leg's open/close status is unresolved until tomorrow's pre-market OI snapshot. Everything about "Reading A vs. Reading B" above is a fork, not a verdict.
- We cannot see who's on the other side, their book, or any hedge in the underlying shares or index futures. A desk that already owns XLI or SPX exposure could have very different real risk than the options alone suggest.
- No live option Greeks are quoted for this structure — the short-vega characterization (net short 15,000 puts of vega) is a sign-only inference from leg sizes, not a measured number.
Ten disclosed research gaps in the underlying catalyst work, carried over transparently:
- No confirmed Q3 2026 earnings dates for any top-ten holding except Deere (August 20); the October–November earnings cluster is modeled from Q2 report timing, not confirmed.
- ISM release dates for October 1 and November 2 are inferred from the standard first-business-day convention, not individually confirmed.
- Census durable-goods dates beyond August 26 are approximate, following the customary late-month cadence.
- No current freight-rate data was retrievable — a real gap given transports are ≈15% of the fund.
- The Surface Transportation Board has published no decision schedule for the Union Pacific–Norfolk Southern merger; proceedings have been held in abeyance since May 28, 2026, making it an unscheduled wildcard rather than a dated catalyst.
- No precise 3-month percentage price move is asserted for XLI due to a missing clean daily close from mid-May 2026.
- Holdings-count and AUM show a small discrepancy between the fund sponsor (83 holdings, $34.64B) and a public aggregator (85, $34.21B) — disclosed, not reconciled.
- Boeing's monthly order/delivery release dates are approximate; no official 2026 schedule was retrievable.
- Q3 consensus EPS estimates exist only for Caterpillar ($6.36); no fund-wide consensus set was obtainable.
- This research was conducted via direct source fetches after this session's broader search budget was exhausted, which constrained cross-verification versus a fuller multi-source pass.
This is not investment advice. Options trading involves substantial risk, including the potential for loss beyond the initial premium on structures with a short/naked component, and is not suitable for all investors. Ratio spreads in particular carry open-ended risk on the uncovered leg — size any position so a worst-case outcome doesn't threaten your account.
Last updated: 2026-08-13 (pre-market) — the next-day OPRA open-interest snapshot resolved the $170 leg and it inverted onto the published Reading B. Nov-20 $170P 80,261 → 49,881 (−30,380 against 70,000 sold, 43% of the print retired): CLOSE (STC), was STO ⏳; $175P 321 → 55,274 (+54,953 against 55,000, 99.9% of size): OPEN (BTO). The title, header line, the inline caveat, the order-type and strategy cells and the ratio-put-spread framing were updated to a hedge roll-up — the crash-tail analysis is withdrawn because there is no naked short leg. The ⏳ callout was replaced with the ✅ RESOLVED box.