🛍️ XLY: The $107.50 Puts Were CLOSED — This Is a Hedge Rolled UP, and the Desk Got MORE Bearish, Not Less
2026-08-12 | 🤝 Multi-Leg Auction | Resolved 2026-08-13: $112.50 OPENED (+54,499), $107.50 CLOSED (−54,496) — a roll-up
✅ Updated 2026-08-13 pre-market — the next-day OPRA open interest resolved both legs, and the numbers landed with unusual precision. The $112.50 put rose 4,075 → 58,574 (+54,499) against a predicted ≈58,600 — within 26 contracts. The $107.50 put collapsed 54,923 → 427 (−54,496) against a predicted ≈500 — within 73 contracts, retiring 99.3% of the print. We published the rule: "$107.50 open interest falling toward ≈500 confirms a closing sale → this was a roll-up of existing protection, and the desk's bearishness increased, not decreased." That is exactly what happened. The provisional STC ⏳ label is confirmed. See the ✅ RESOLVED box.
🎯 The Quick Take
A desk put on one of the largest defined-risk hedges on the board today in the Consumer Discretionary Select Sector SPDR Fund (XLY): bought 54,500 December 18, 2026 $112.50 puts and sold 54,500 December $107.50 puts, a bear put spread costing ≈$6.65 million net against a fund trading at $117.85. Read the concentration numbers before anything else, because they change what this trade actually means.
XLY is not a diversified "consumer" bet. The fund holds $23.64 billion in AUM across 47 holdings at a 0.08% expense ratio — but Amazon alone is 25.21% and Tesla 14.82%, a combined 40.03%, with the top ten names at 68.13%. Betting on "the American consumer" through XLY means betting roughly two-fifths on two mega-caps whose Q4 earnings drivers — AWS and advertising for Amazon, autonomy and robotics narratives for Tesla — have limited connection to whether people buy Christmas presents. That mismatch is the single biggest thing to understand about this position before reading anything else below.
🏢 What XLY Actually Holds
The Consumer Discretionary Select Sector SPDR Fund tracks the Consumer Discretionary Select Sector Index, covering specialty retail, broadline retail, hotels/restaurants/leisure, textiles and apparel, household durables, and automobiles drawn from the S&P 500. Fast facts, current as of August 11–12, 2026:
- AUM: $23.64B (secondary source: $23.35B; the fund's own figure is authoritative)
- Expense ratio: 0.08%
- Holdings: 47
- 52-week range: $105.19 – $125.01
- YTD return: −2.41% (1-year: +5.64%)
- Dividend yield: 0.77%
Top 10 holdings and weights:
| # | Ticker | Company | Weight |
|---|---|---|---|
| 1 | AMZN | Amazon.com | 25.21% |
| 2 | TSLA | Tesla | 14.82% |
| 3 | HD | Home Depot | 5.74% |
| 4 | MCD | McDonald's | 4.22% |
| 5 | TJX | TJX Companies | 4.17% |
| 6 | BKNG | Booking Holdings | 3.97% |
| 7 | LOW | Lowe's | 3.02% |
| 8 | SBUX | Starbucks | 2.96% |
| 9 | ROST | Ross Stores | 2.02% |
| 10 | DASH | DoorDash | 1.99% |
| Top-10 combined | ≈68.13% |
Why this matters for this specific trade: the position is roughly 40% a bet on two mega-caps de-rating, ≈28% a bet on genuine retail/restaurant/travel spending (HD, MCD, TJX, BKNG, LOW, SBUX, ROST, DASH), and ≈32% everything else. A weak Christmas that hammers Home Depot and TJX but leaves Amazon's cloud earnings intact might not move XLY the 4.5%–8.8% this spread needs. Conversely, a standalone Amazon or Tesla drawdown could pay this trade out with the actual consumer entirely fine. That asymmetry cuts both ways and it is the largest execution risk in expressing a "holiday demand" view through this instrument.
💰 The Trade, Plain English
At 11:12:00 ET, both legs printed together as a 🤝 multi-leg auction — a worked order exposed to the market for price improvement, negotiated with a known counterparty, not a lit sweep and not an aggressive cross. No urgency signal belongs to this print; it is two parties who had already agreed on price.
| Time (ET) | Buy/Sell | Call/Put | Expiration | Strike | Volume | OI (prior) | Size | Spot | Option Price | Premium | Option Symbol |
|---|---|---|---|---|---|---|---|---|---|---|---|
| 11:12:00 | BUY | PUT | 2026-12-18 | $112.50 | 55,000 | 4,075 | 54,500 | $117.85 | $3.29 | $17,930,500 | XLY20261218P112.5 |
| 11:12:00 | SELL | PUT | 2026-12-18 | $107.50 | 55,000 | 54,923 | 54,500 | $117.85 | $2.07 | $11,281,500 | XLY20261218P107.5 |
Position economics:
| Metric | Value |
|---|---|
| Spread width | $5.00 |
| Net cost per spread | $1.22 |
| Net debit paid | ≈$6.65M |
| Maximum gross value at expiry | ≈$27.25M |
| Maximum net profit | ≈$20.6M |
| Maximum loss | ≈$6.65M (the debit — 100% of cost) |
| Payoff ratio | ≈4.10:1 gross · ≈3.10:1 net (≈310% on risk) |
| Breakeven at expiry | $111.28 (−5.57% from spot) |
| Long strike distance | −4.54% from spot |
| Short strike distance | −8.78% from spot |
| Underlying notional (5.45M shares) | ≈$642.3M |
| Cost as % of notional | ≈1.04% |
✅ RESOLVED — A Near-Total Close at $107.50: the Roll-Up Branch, Almost to the Contract
Updated 2026-08-13 pre-market. Resolving OPRA snapshot timestamped August 13 (reflects the August 12 close, after this print); baseline is the August 12 snapshot (reflects the August 11 close, before this print).
| Leg | Baseline (Aug-12) | Resolving (Aug-13) | Δ | Print size | What we published | Verdict |
|---|---|---|---|---|---|---|
| Dec-18 $112.50 put (bought) | 4,075 | 58,574 | +54,499 | 54,500 | "rising ≈54,500 (toward ≈58,600) confirms the long leg opened" | ✅ OPEN (BTO) — 100.0% of size, within 26 of prediction |
| Dec-18 $107.50 put (sold) | 54,923 | 427 | −54,496 | 54,500 | "falling toward ≈500 confirms a closing sale → a roll-up of existing protection" | ✅ CLOSE (STC) confirmed — 99.3% retired, within 73 of prediction |
This is the most precisely-resolved trade on the August 12 board. Both published targets landed inside 100 contracts. The $107.50 line went from a crowded 54,923-contract consensus level to 427 — a 99.2% extinction. The opening-short branch (which would have pushed $107.50 toward ≈109,500) is ruled out completely.
And the direction of the correction matters. This is not a downgrade of the trade's bearishness — it is an upgrade. A fresh bear put spread would have been a new position with a capped, financed profile. What actually happened is that a desk which already owned 54,500 December $107.50 puts moved that protection 4.7% closer to spot, to $112.50, paying up for higher-probability coverage. Conviction that a decline is closer at hand went up.
The "crowded line in the sand" observation now reads differently, and this is worth stating. The ≈55,000 contracts sitting at $107.50 before this print were, it turns out, largely this same desk's own position — and they are now gone. That level is no longer a consensus put wall; the December put concentration has migrated to $112.50.
Control check. Neighbouring December strikes were static across the window — $105P 6,004 → 6,002 (−2), $110P 14,689 → 14,689 (0), $115P 5,366 → 5,366 (0). The 54,496-contract collapse is entirely at the traded line.
🤓 What This Actually Means — Plain English
A bear put spread is a defined-risk bet that a stock falls a moderate, specific amount — no more, no less. Here's the mechanism from first principles:
- You pay for the right to sell XLY at $112.50 (the long put) — that costs $3.29 per share, or $17.9M across 54,500 contracts.
- You collect money for giving someone else the right to sell you XLY at $107.50 (the short put) — that brings in $2.07 per share, or $11.3M.
- Net, you pay $1.22 per share — the $6.65M debit is the maximum this position can ever lose. If XLY closes anywhere at or above $112.50 on December 18, both puts expire worthless and the full $6.65M is gone.
- Between $112.50 and $107.50, the position makes money on a sliding scale. Every dollar XLY falls below $112.50 is worth $1.00 per share on the long put, up to $5.00 at $107.50 — where the short put's obligation caps further gains.
- Below $107.50, profit is frozen at the maximum. The short put now loses dollar-for-dollar right alongside the long put's gains, so the two cancel out beyond that point. That is the entire reason to sell the lower strike: it turns unlimited (well, down-to-zero) put exposure into a fixed, known number.
- Breakeven is $111.28 — spot minus the $1.22 net cost. XLY needs to fall 5.57% just to get this position back to flat. Below that, it is genuinely profitable; above it, it is a pure loss of premium.
Why sell the $107.50 strike at all, instead of just buying the $112.50 put outright? Because selling it recovers 63% of the long put's cost ($2.07 of $3.29), turning a $17.9M outright bet into a $6.65M defined-risk position. The trade-off is capping the payout — a desk buying naked puts for a crash scenario wants unlimited convexity as the stock falls; this desk explicitly gave that up in exchange for cutting the cost by nearly two-thirds. That is a considered, moderate-decline view, not a lottery ticket on a collapse.
The strike selection reinforces this reading. XLY's 52-week low is $105.19. The sold $107.50 strike sits just 2.2% above that low, and the bought $112.50 strike sits 6.9% above it — meaning the entire maximum-payout zone lies inside ground XLY has already covered in the past twelve months. This is a bet on a retest of the annual low, not a break far below it.
The most important risk-control point for any reader: this is still a spread that can lose 100% of its cost. If XLY simply drifts sideways or grinds higher through December — arguably the single most likely outcome given ten straight months of retail sales gains — the entire $6.65M (and every dollar a retail trader put into a similarly structured position) is gone. A defined-risk spread defines the loss; it does not eliminate it.
📈 Technical Setup
YTD Chart
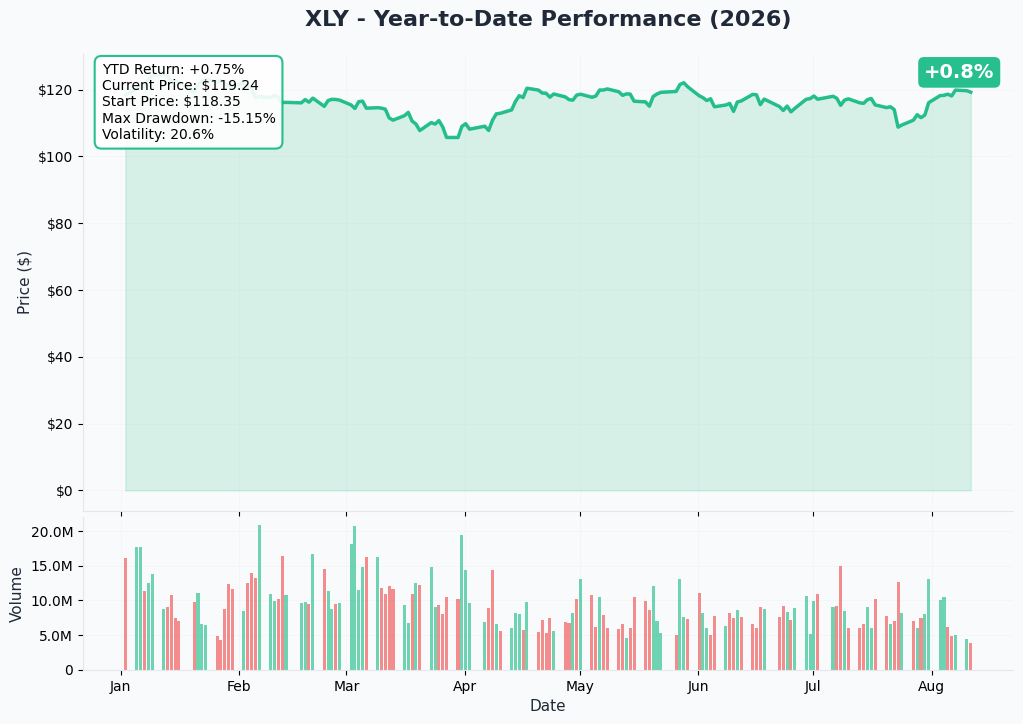
XLY has been the market's laggard all year — −2.41% YTD while the S&P 500 has been making highs on AI-infrastructure strength. The chart shows a sector that never fully participated in the broader rally, consistent with Tesla's ≈26% YTD decline dragging on a fund where it is nearly 15% of the weight.
Gamma Support & Resistance
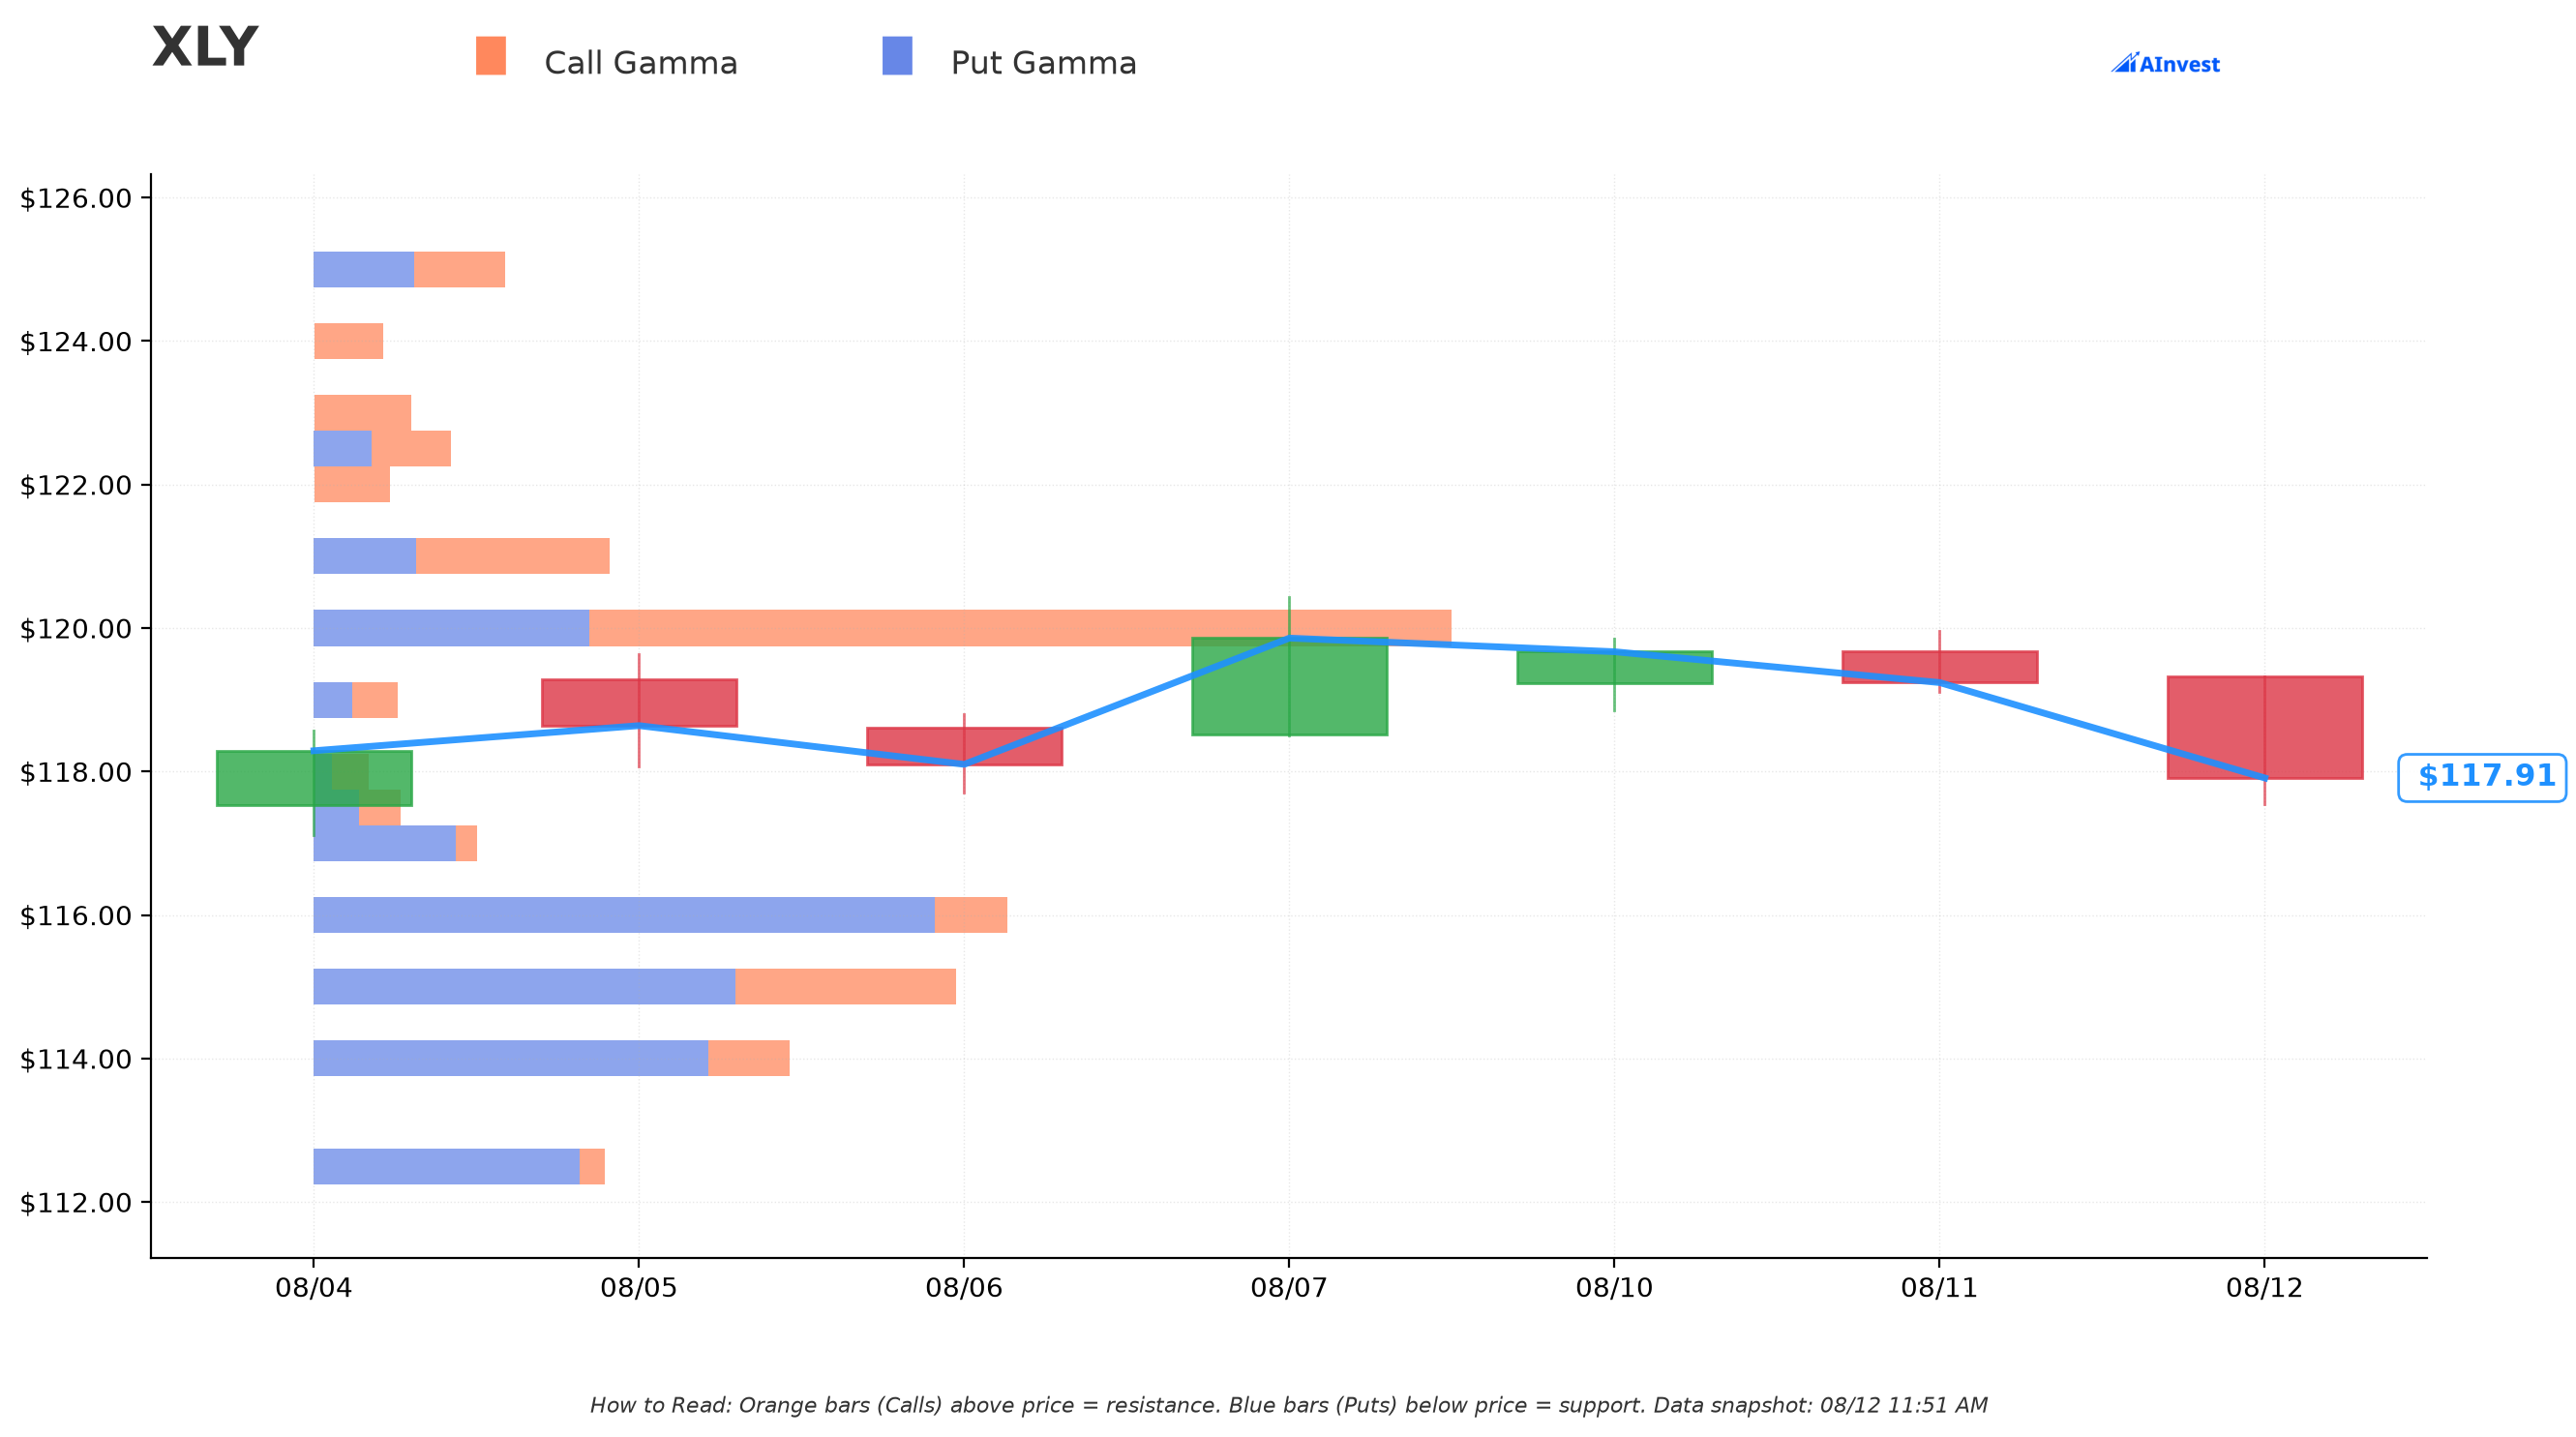
Reading the current gamma map with spot at $117.91:
- Resistance: $120 (Very Strong), ≈1.8% above spot — the nearest structural ceiling.
- Support: $116 (Very Strong), ≈1.6% below spot — the first real floor dealers are likely defending.
- Beyond that immediate band, put-heavy support builds at $110 and again right at $107.50 — the exact strike this trade sold — meaning the short leg sits on a level the options market already treats as gamma-significant, not an arbitrary round number.
Implied Move
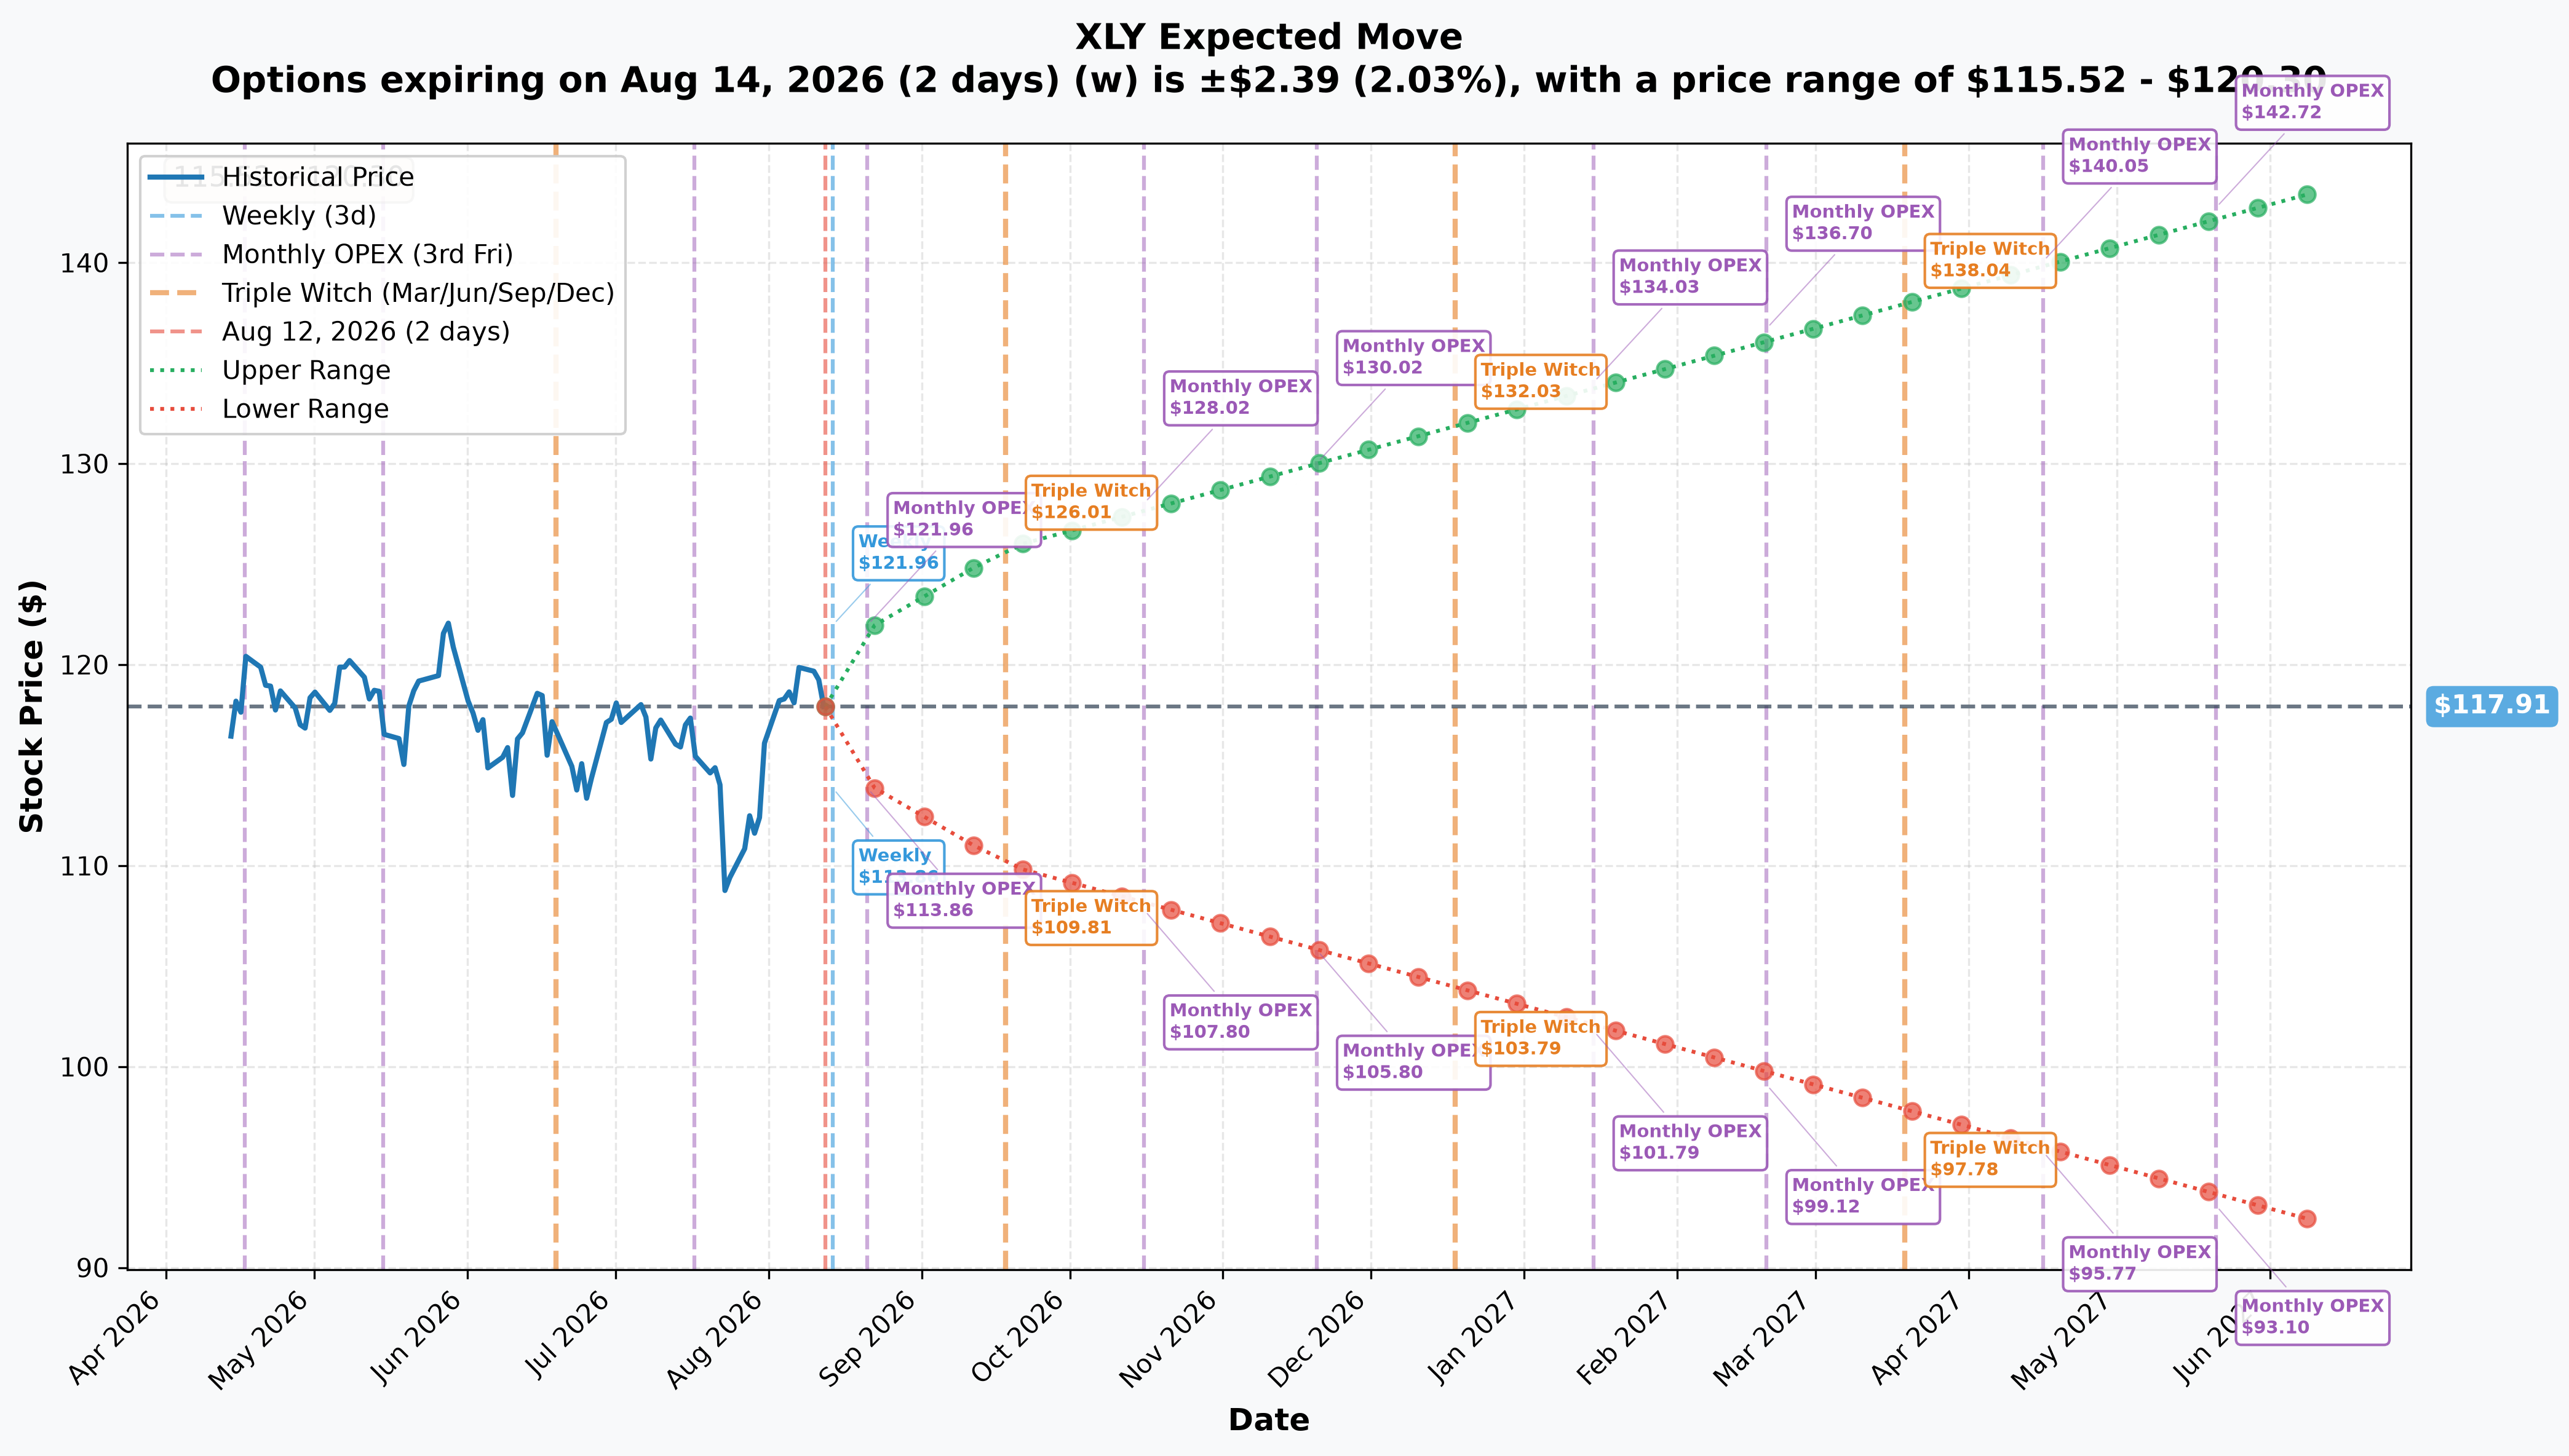
Straight from the current options-priced expected ranges:
| Window | Expiry | Implied move | Range |
|---|---|---|---|
| Weekly | 2026-08-14 | ±2.03% | $115.52 – $120.30 |
| Monthly OPEX | 2026-08-21 | ±3.32% | $114.00 – $121.82 |
| Quarterly / triple witch | 2026-09-18 | ±6.70% | $110.01 – $125.81 |
The tell is in that last row. Even at the five-week (September 18) horizon, the market's own volatility pricing puts the low end of the expected range at $110.01 — a level that just barely pushes past the $112.50 long strike but does not reach the $107.50 short strike, the strike that defines this spread's maximum payout. In other words, near-term implied volatility is not currently pricing the move this spread needs to hit full value; that move only becomes "expected" once you extend all the way out to the full 128-day window to December 18. That gap between what's priced now and what the position needs is precisely why the spread was affordable at $1.22 net — the market is not (yet) charging a premium for the scenario this desk is positioned for.
🎪 Catalysts
The expiration window is engineered, not incidental
December 18, 2026 is ≈128 days from the trade date, and three separate alignments make this a deliberate choice of expiration rather than a default "go out a few months" pick:
① November retail sales — the Black Friday month — releases December 16, two trading days before expiration. November 2026 contains Thanksgiving (Nov 26), Black Friday (Nov 27) and Cyber Monday (Nov 30). That single Census Bureau release is the first official, government-sourced verdict on the American Christmas — and the puts still have two trading days of life left when it prints. December is the only monthly options expiration that sits between that release and year-end.
② The December 8–9 FOMC meeting, carrying a Summary of Economic Projections, lands nine days before expiration. With markets currently pricing ≈77% odds of a rate hike at the September meeting and three July dissents already favoring a hike, the December SEP is where the Fed either confirms a hiking cycle into a weakening labor market or backs off. The spread is live for that decision and the September 15–16 and October 27–28 meetings before it — three chances for a hawkish repricing, and zero chance of rescue by a dovish January pivot, since the January 26–27, 2027 meeting falls after expiration.
③ The whole shopping season sits inside the window; the actual receipts do not. The window covers Amazon's autumn sale event, Halloween, the full Thanksgiving weekend, Black Friday, Cyber Monday, Cyber Week reporting, and Green Monday — but expires before Super Saturday (Dec 19), before Christmas, before full-season sales tallies, and before the December retail sales report (mid-January 2027). This is the subtle, correct read of the trade: the desk is not betting on the final holiday sales number — it is betting on the market's formation of an opinion about the holiday, using Cyber Week data, November retailer guidance, and the November retail sales print as the repricing triggers, all of which land inside the window while the final tally lands weeks after the puts have already settled.
Also inside the window — the highest-density single catalyst week: on their historical cadence, Home Depot, Lowe's, TJX, Target and Walmart report fiscal Q3 during the week of November 16–20, 2026, one week before Black Friday and the same week as the October retail sales report on November 17. That week concentrates the last pre-holiday government spending data with holiday guidance from ≈13% of the fund by weight — near-optimal timing, about a month before this spread expires, for a bear put spread to gain value if the guidance disappoints.
Confirmed near-term catalysts (dates separated from the December 18 expiration itself)
- August 14, 2026 — July retail sales, consensus +0.3% MoM, two days after the trade.
- August 18–20, 2026 — Home Depot (5.74%), Lowe's and TJX (3.02% / 4.17%), and Walmart earnings — the first live test of the position, six to eight days out.
- September 15–16, 2026 — FOMC decision with SEP, same window as August retail sales (Sept 16).
- October 15, 2026 — September retail sales; October 27–28 — FOMC decision.
- ≈late October 2026 — expected (unconfirmed, by earnings cadence) Q3 reports from Tesla (14.82%) and Amazon (25.21%), together ≈40% of the fund's weight.
- November 17, 2026 — October retail sales, the last pre-holiday read.
- December 16, 2026 — November retail sales, the Black Friday verdict, two days before expiration.
- December 18, 2026 — options expiration.
The macro backdrop — genuinely split, not one-sided
Supporting the bearish thesis (soft data):
- July nonfarm payrolls came in at −23,000 against a consensus of +12,000, with labor force participation falling to 61.4%, its lowest since early 2021 — unemployment fell to 4.1% only because people left the workforce.
- Consumer sentiment is near record lows: University of Michigan sentiment at 55.2 against an 84.4 long-run average, still −10.5% year over year despite bouncing off May's all-time low of 44.8.
- The personal savings rate is 2.70% versus an 8.36% historical average — households have essentially no buffer against an income shock.
- Gasoline prices are +24.6% year over year, a direct, compounding transfer out of discretionary budgets tied to an ongoing energy shock.
- Markets currently price ≈77% odds of a rate HIKE at the September FOMC, with three July dissents already wanting one — a hawkish regime landing directly on the most rate-sensitive S&P sector.
Working against the bearish thesis (hard data):
- Ten consecutive months of retail sales gains, per the CNBC/NRF Retail Monitor.
- Bank-reported credit-card delinquencies are actually improving, at 2.92%, down from 3.22% two years earlier — no consumer credit crisis shows up in the bank data.
The honest summary: the soft data supports this thesis and the hard data currently contradicts it. That tension — consumers reporting they feel terrible while continuing to spend, funded by a razor-thin savings rate and revolving credit — is the entire trade. It persists exactly until the labor market crack visible in the July jobs report starts showing up in actual spending.
👥 How Different Readers Should Think About This
🎲 The YOLO trader
This spread is not built for speed — it is a defined-risk, four-month structure with a capped payout, not a lottery ticket. If you want convex, uncapped downside exposure on a "holiday disappoints" thesis, this specific structure gives that up on purpose (the short $107.50 leg caps you at $5.00 of intrinsic value no matter how far XLY falls). If you're chasing this idea for speed and leverage, you'd be looking at single names with more direct holiday-spending exposure (HD, TJX, TGT) rather than XLY, where 40% of the outcome depends on Amazon and Tesla doing something that may have nothing to do with Christmas. And remember: the most likely single outcome for a sideways-to-up market between now and December is that a copy of this trade expires worthless.
📈 The swing trader
The structural levels here are worth having on your chart independent of this trade: $107.50 is both the short strike and a Very Strong gamma support zone, sitting just 2.2% above the 52-week low of $105.19. A retest of that zone into the November guidance cluster (Nov 16–20) or around the December 16 retail-sales print would be the technical confirmation to watch for — not a slow grind lower, but a sharp repricing around one of the dated catalysts above. The five-week implied move (±6.70% to Sept 18) doesn't yet reach the short strike, so don't expect this position to show real value until later in its life; treat early moves toward $114–$116 as noise, not validation.
💰 The premium collector
There's a genuine premium-selling lesson embedded in this trade even if you're not running the same structure: selling the $107.50 put recovered 63% of the long $112.50 put's cost, which is the textbook trade-off between defined risk and reduced maximum payout. If you're already running cash-secured puts or spreads on XLY, $107.50 is now a level with real institutional attention (≈55,000 contracts of prior open interest, reinforced by today's flow), and the $116/$120 gamma walls bracket the near-term range where premium selling is likely to see the most mean-reverting behavior. Just be aware you'd be selling into a name where a large, patient desk has already expressed a defined bearish view at exactly this strike.
🌱 The beginner
Think of this as buying insurance with a co-pay. Buying the $112.50 put alone would be like buying a full insurance policy on XLY falling — it pays out fully however far the price drops, but it's expensive ($17.9M for this desk). Selling the $107.50 put is like agreeing to a policy that only pays up to a certain amount, in exchange for a lower premium — the desk collected $11.3M for capping its own payout at $107.50. Net, they paid $6.65M for protection that only pays off if XLY falls between $117.85 (spot) and $107.50, maxing out at $20.6M of profit. If XLY stays flat or rises — which is the single most likely outcome — the full $6.65M is simply gone, the same way a homeowner's insurance premium is gone if the house never burns down. That is the real risk in any options trade: you can be right about the direction and still lose everything if you're wrong about the size or timing of the move.
⚠️ Honest Limits — What the Tape Cannot Prove
- We cannot prove open versus close on the $107.50 leg from today's tape alone. Size (54,500) sits almost exactly at prior open interest (≈54,923) — this could be a fresh short or a closing sale that rolled existing protection higher. See the ⏳ callout above; tomorrow's pre-market OPRA open-interest snapshot is the definitive test.
- We cannot see the counterparty, the broker, or the desk's identity or mandate. This printed as a negotiated, price-improvement auction with a known counterparty — positioning is visible, intent and identity are not. Nothing here proves whether this is a standalone directional bet or a modest overlay (≈4.24% of underlying notional) on a much larger book.
- Research-gap disclosures carried over from the underlying catalyst research: live web search was unavailable for that research pass, so it relied on direct fetches of primary/reference sources; the Bureau of Labor Statistics release schedule, the BLS Employment Situation release, and the New York Fed Household Debt and Credit Report all returned access errors, so household-level delinquency detail (auto, student loan, credit-card transitions into serious delinquency) is missing — only aggregate commercial-bank delinquency data could be sourced, and that may understate stress at non-bank lenders. Specific 2026 tariff rates and affected-country detail could not be sourced. No 2026 holiday sales forecast exists yet — the Deloitte figures referenced anywhere in this research trail are from the 2025 survey and are marked as such, not a 2026 forecast. CPI, jobs, Conference Board and University of Michigan release dates from September 2026 onward are cadence-based conventions, not confirmed from a primary calendar, though retail sales and FOMC dates are fully confirmed for the entire window.
- This is a fund-level hedge; it cannot isolate which part of the consumer economy actually breaks. A move through $107.50 could come from mega-cap Amazon/Tesla weakness, genuine retail softness, or both — the option alone cannot distinguish the source.
- A defined-risk spread still risks 100% of its cost. If XLY drifts sideways through December 18 — the single most probable outcome given the currently resilient hard consumer data — the full $6.65M net debit (and any retail-sized equivalent) is lost in its entirety.
- Options trading involves substantial risk of loss and may not be suitable for all investors. Nothing here is investment advice; verify all figures independently before acting, and size any position — hedge or speculation — to what you can afford to lose.
Last updated: 2026-08-13 (pre-market) — the next-day OPRA open-interest snapshot resolved both legs onto the published roll-up branch, within 100 contracts on each. Dec-18 $112.50P 4,075 → 58,574 (+54,499 against 54,500; predicted ≈58,600): OPEN (BTO); $107.50P 54,923 → 427 (−54,496 against 54,500, 99.3% retired; predicted ≈500): CLOSE (STC) confirmed, was STC ⏳. The title, header line and framing were updated from a new bear put spread to a roll-up of existing protection — the desk got more bearish, not less — and the "crowded $107.50 line" note now records that the level has emptied. The ⏳ callout was replaced with the ✅ RESOLVED box.