🔍 AAPL $124M "Call Sale" Headline Is a Mirage — It's a $904M Zero-Direction Conversion
📅 2026-07-31 | 🤝 Block Cross Detected — Not a Bearish Bet
🎯 The Quick Take
The scanner flagged a $123.66M Apple call sale today, the day AAPL fell ≈9.5% on earnings — and if you stopped there, you'd assume someone is making a massive bearish wager on Apple. They are not. This was one negotiated block cross at 13:51:10 that paired a deep-in-the-money 0DTE call sale with a same-strike put buy AND a 3,000,000-share stock purchase, all in the same second — a textbook conversion. It nets out to essentially zero directional exposure. Read on before you let the headline number scare or excite you.
🏢 Company Overview
Apple Inc. (AAPL) designs, manufactures, and markets iPhones, Macs, iPads, wearables (Apple Watch, AirPods, Vision Pro), and a large recurring-revenue Services business — App Store, iCloud, Apple Music, Apple TV+, Apple Pay, and the Google search-default deal.
- Sector / Industry: Information Technology / Consumer Electronics & Devices
- Market cap: ≈$4.41 trillion
- Share price: $301.89, down ≈9.5% on 2026-07-31
- Trailing P/E: 34.6x | Forward P/E: 32.9x
- 52-week range: $201.50 – $344.57 (52-week total return ≈+44.5%)
- FY2025 revenue / net income: $416.16B (+6.4%) / $112.01B (+19.5%)
Three sessions before today's drop, Apple briefly touched a $5 trillion market cap on July 28 — only the second company ever to do so.
💰 The Trade — In Plain English
At 13:51:10 on the 0DTE (same-day-expiring) chain, exactly two option legs crossed as a paired block, and a huge stock print landed in the same second. A full scan of today's 0DTE Apple chain confirms these are the ONLY two legs — nothing else printed at that moment.
| Time | Symbol | Buy/Sell | Call/Put | Expiration | Premium | Strike | Volume | OI | Size | Spot | Option Price | Option Symbol |
|---|---|---|---|---|---|---|---|---|---|---|---|---|
| 13:51:10 | AAPL | SELL | CALL | 2026-07-31 | $123,660,000 | $260 | 30,020 | 116 | 30,000 | $301.20 | $41.22 | AAPL20260731C260 |
| 13:51:10 | AAPL | BUY | PUT | 2026-07-31 | $30,000 | $260 | 30,057 | 1,253 | 30,000 | $301.20 | $0.01 | AAPL20260731P260 |
| 13:51:10.558 | AAPL (stock) | BUY | — | — | ≈$903.7M | — | — | — | 3,000,000 sh | $301.22 | — | — |
🤝 BLOCK CROSS — negotiated off the lit book, both legs printed as a multi-leg cross, known counterparty on the other side.
Net option premium: $123.63M credit collected on the calls, offset by $30,000 paid for the puts — a $123.60M net credit on the option legs alone, but that credit is not "free money"; it's paired dollar-for-dollar against $903.7M of stock bought at essentially the same instant. This is the AAPL portion of the day's flow that carries zero directional content.
The math that proves it's a package, not a bet: SELL 30,000 × $260 calls + BUY 30,000 × $260 puts, same strike, same expiration = a synthetic short stock position. The effective synthetic short price is:
$260 + ($41.22 − $0.01) = $301.21
The paired stock leg bought 3,000,000 shares at $301.22 — a spread of one cent on ≈$904M of notional. The option package's delta computes to −2,982,600 shares against +3,000,000 shares of stock. Net exposure: essentially flat.
⏳ Important: There Is No Next-Day OI Check Coming for This One
Normally every trade on the board gets a ⏳ reminder to come back the next trading morning (≈06:30 ET) so the fresh OPRA open interest can confirm open vs. close. That check will never happen for this trade — both legs expire today (0DTE), so there is no "tomorrow" for these strikes at all.
That does NOT mean the open/close question is unresolved — it's actually one of the cleanest reads on the entire board:
- Call leg: 30,000 contracts vs. prior open interest of just 116 ⇒ proven fresh open.
- Put leg: 30,000 contracts vs. prior open interest of 1,253 ⇒ proven fresh open.
Here, open vs. close is settled by the structure itself, not by a future OI snapshot: a conversion is self-liquidating at expiry by construction — there's no position left to carry into tomorrow's OI count. If you want to see where the ⏳ next-morning OI check still matters, look at the rest of today's board — several other tickers carry legs where size sits below prior OI and genuinely need tomorrow's confirmation.
✅ Confirmed on August 3, 2026: we ran the next-day OI check across the entire July 31 board anyway, and — exactly as stated above — OPRA published no August 3 open-interest record for either the $260 call or the $260 put. Both series closed at expiry; their final snapshots stand at 116 (call) and 1,253 (put), dated July 31. There is nothing further to resolve here and never will be. The structural read below is the permanent verdict on this trade.
🤓 What This Actually Means — Plain English
This is a conversion — one of the most misunderstood structures in options because on the surface it looks exactly like a huge bearish bet. It is not. It's a pure financing / stock-loan / carry package, and here's the arithmetic that proves it, walked all the way to expiration:
- The trader buys 3,000,000 shares of AAPL at $301.22.
- The trader sells 30,000 deep-in-the-money $260 calls at $41.22, collecting $123.66M.
- The trader buys 30,000 essentially worthless $260 puts at $0.01, paying $30,000 — cheap insurance for the few hours between the trade and the close.
- At expiration today, the $260 call is deep in the money and gets assigned. The trader delivers the 3,000,000 shares they just bought, receives $260/share for them, and keeps the $41.22 they already collected.
- Total proceeds per share: $260 + $41.22 = $301.22 — exactly what they paid for the stock. Flat by construction.
Nobody in this trade is making a call on where Apple goes. The short call caps the upside (they gave that away in exchange for premium), and the long put protects the tiny sliver of downside between the trade and the close (Apple would have to gap below $260 in the next couple of hours for the put to matter, and even then the stock leg mostly cancels it). Desks build packages like this to earn a financing spread — locking in a fixed, essentially risk-free return over a short window, often tied to stock-loan economics, dividend/borrow rates, or balance-sheet financing needs — never to express a view on the stock.
The tell to remember: whenever you see a deep-in-the-money short call + a same-strike, same-expiry long put + a same-second stock block, that's a conversion. It shows up constantly in unusual-options scans, and every time it does, the "$XXX MILLION CALL SALE" headline is technically true and practically meaningless.
Order types, for completeness: the call leg is a short-to-open (STO) — technically a sale, but a financing sale, not a bearish signal. The put leg is a bought-to-open (BTO) — technically a purchase, but pocket-change insurance, not a bullish signal either. Neither leg should be read in isolation; only the package matters, and the package is flat.
📈 Technical Setup / Chart Check-Up
YTD Performance
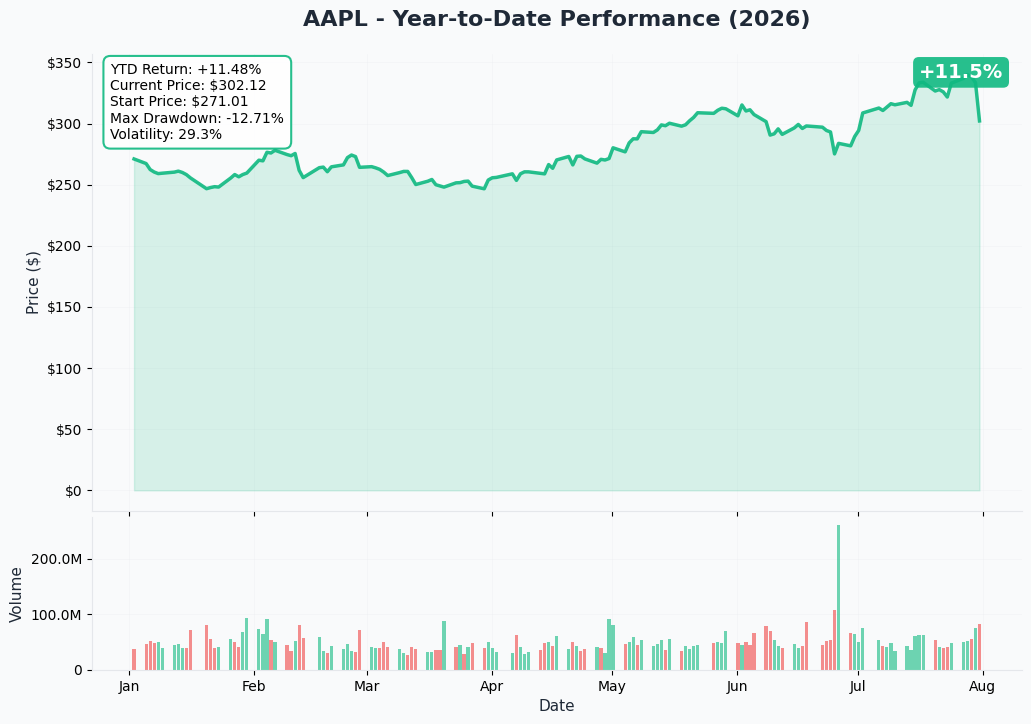
Apple is still up meaningfully on the year despite today's drop, having run from a 52-week low of $201.50 to an intraday high of $344.57 on July 28 — a $5 trillion market cap moment — before today's post-earnings ≈9.5% air pocket brought it back to $301.89.
Gamma-Based Support & Resistance
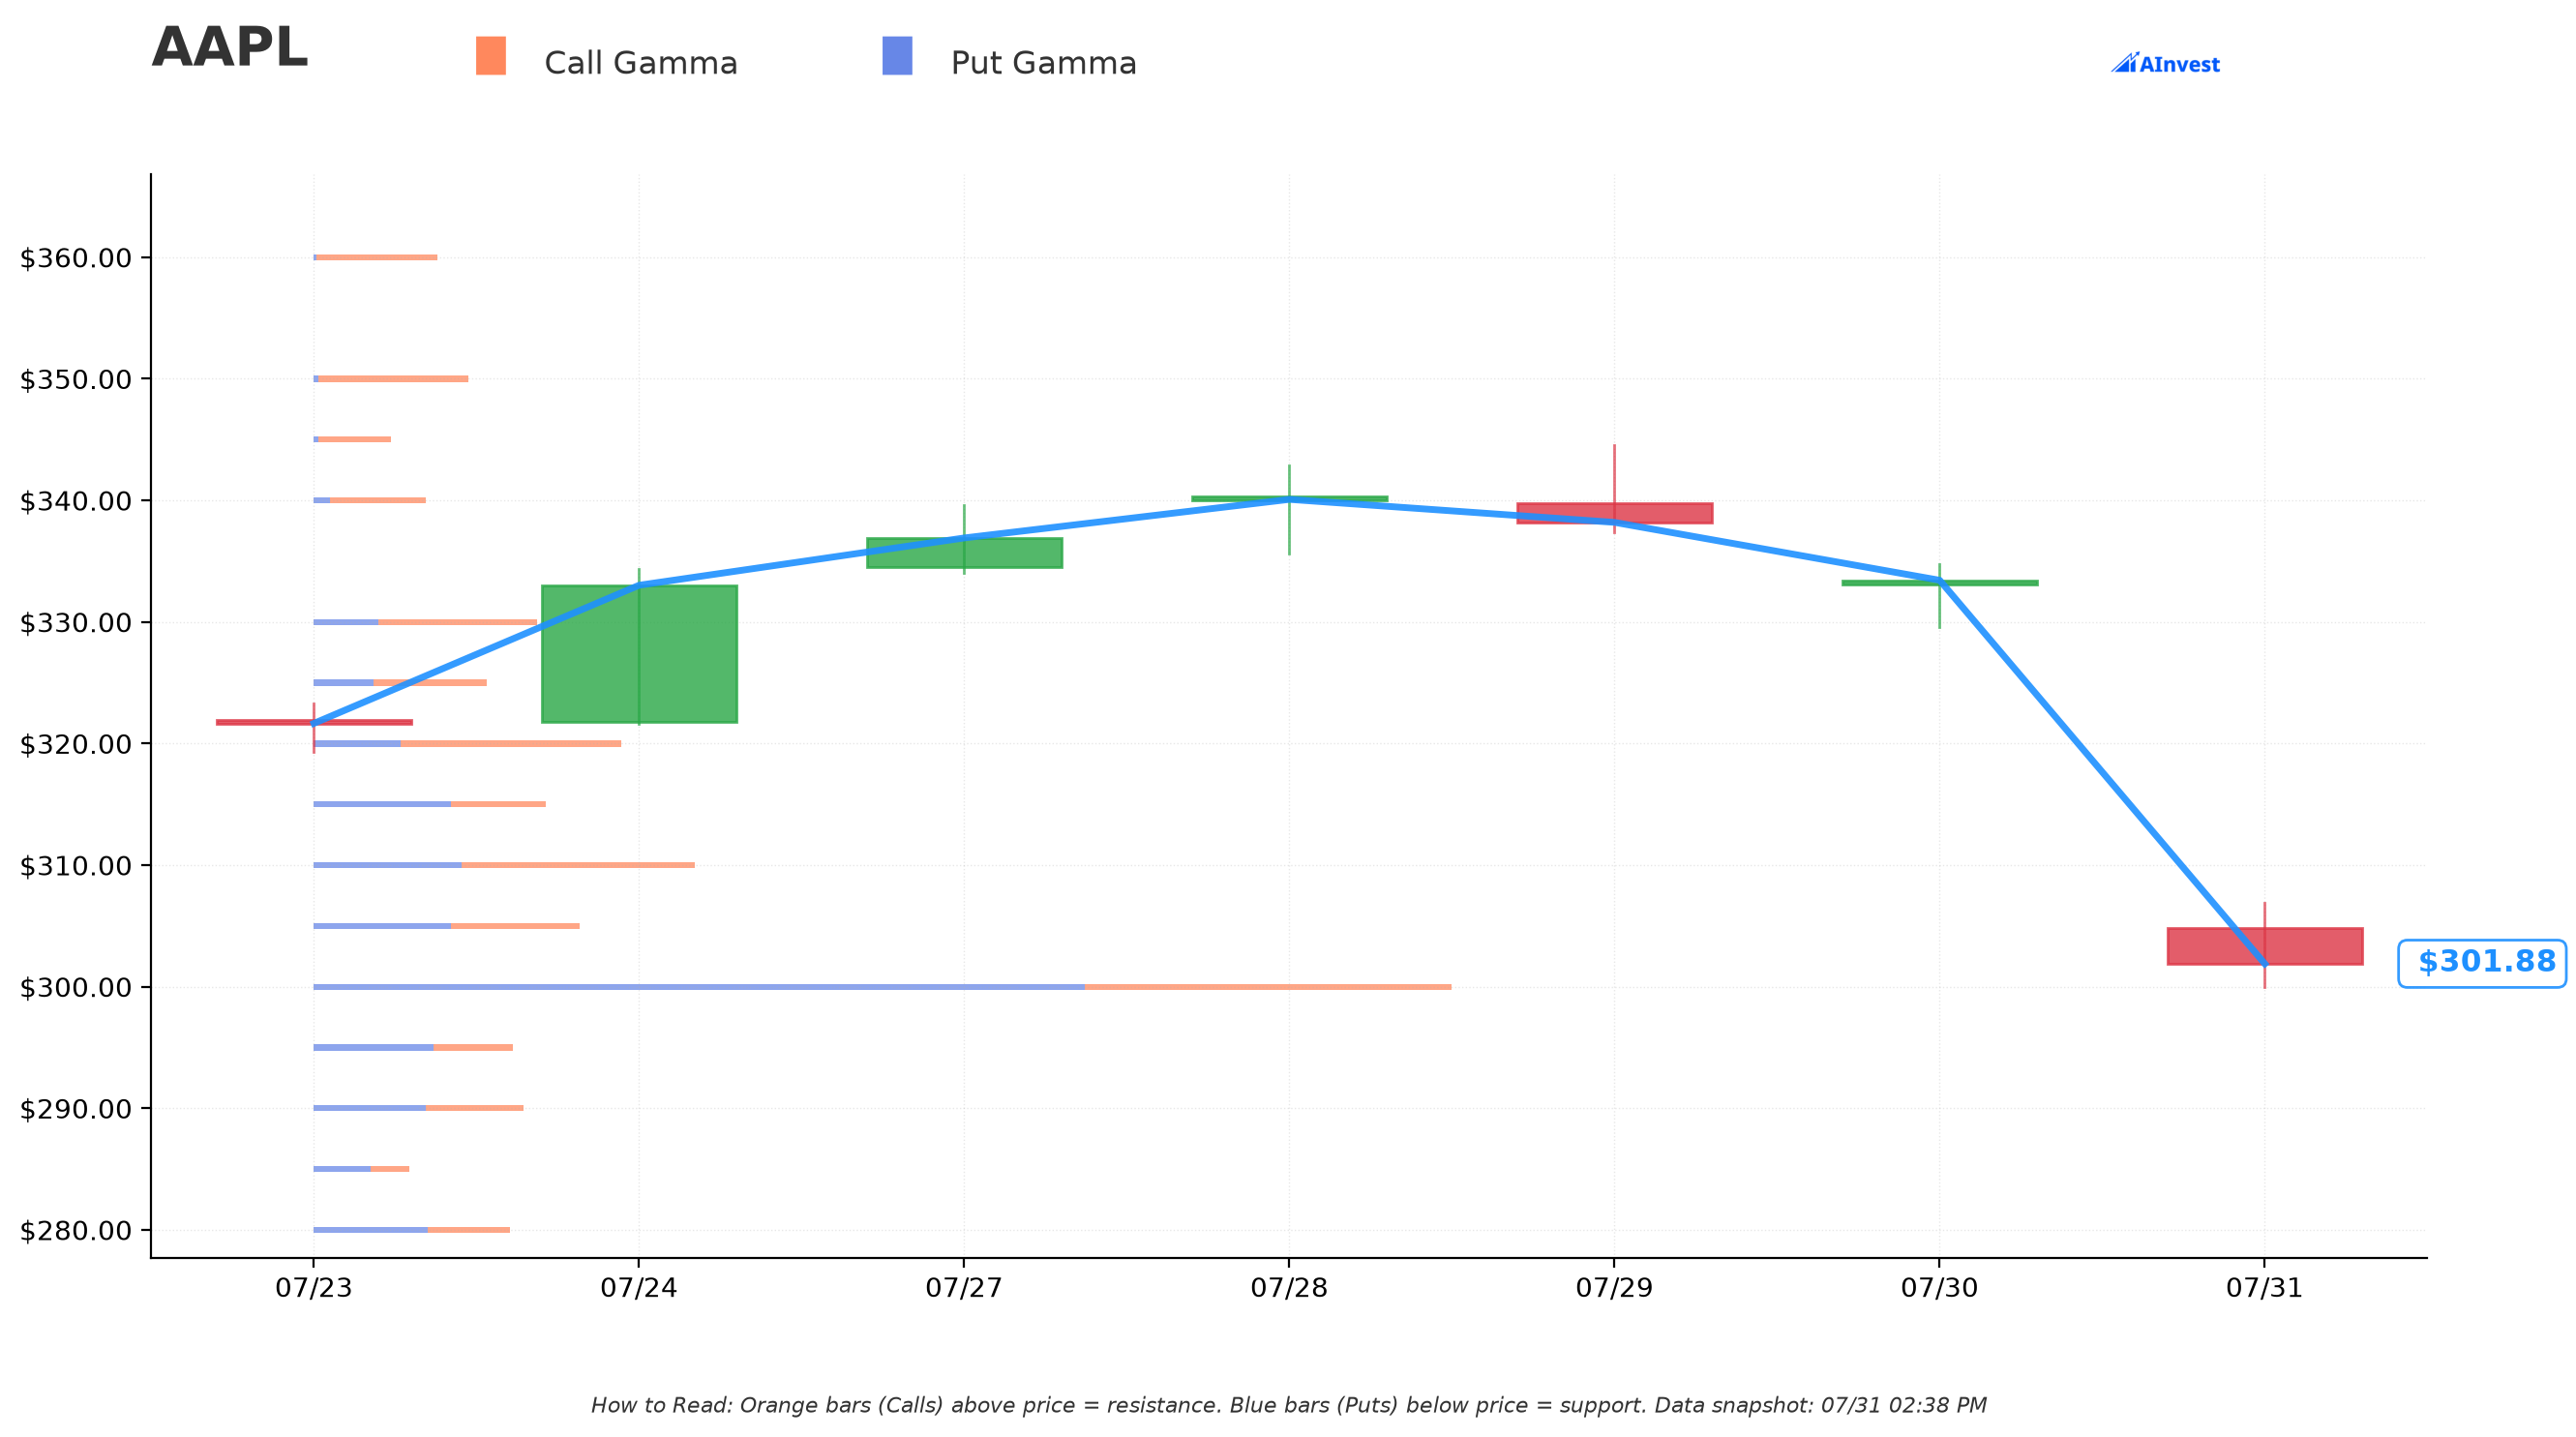
Spot is sitting at $301.87, effectively glued to the $300 strike, which is by far the strongest gamma wall on the board — total gamma exposure of ≈180.7 (put-dominated, ≈122.2 put vs. ≈58.5 call), sitting just 0.6% below spot. That makes $300 the dominant magnet for the rest of today's session.
- 🔵 Support: $300 (Very Strong, ≈180.7 total GEX, 0.62% away) → $295 (≈31.7 GEX, 2.3% away) → $290 (≈33.3 GEX, 3.9% away)
- 🟠 Resistance: $305 (≈42.4 GEX, 1.0% away) → $310 (≈60.5 GEX, 2.7% away, largest resistance wall) → $320 (≈48.8 GEX, 6.0% away)
Net gamma below spot is deeply negative (dealers are short gamma into the $300 strike), which tends to amplify moves through that level rather than dampen them — a reminder that today's post-earnings volatility could persist rather than mean-revert immediately. Note: this conversion trade's $260 strike is well below both spot and the nearest gamma wall, and because the package is delta-neutral, it does not meaningfully add to dealer gamma positioning at $260 the way a real directional bet would.
Implied Move
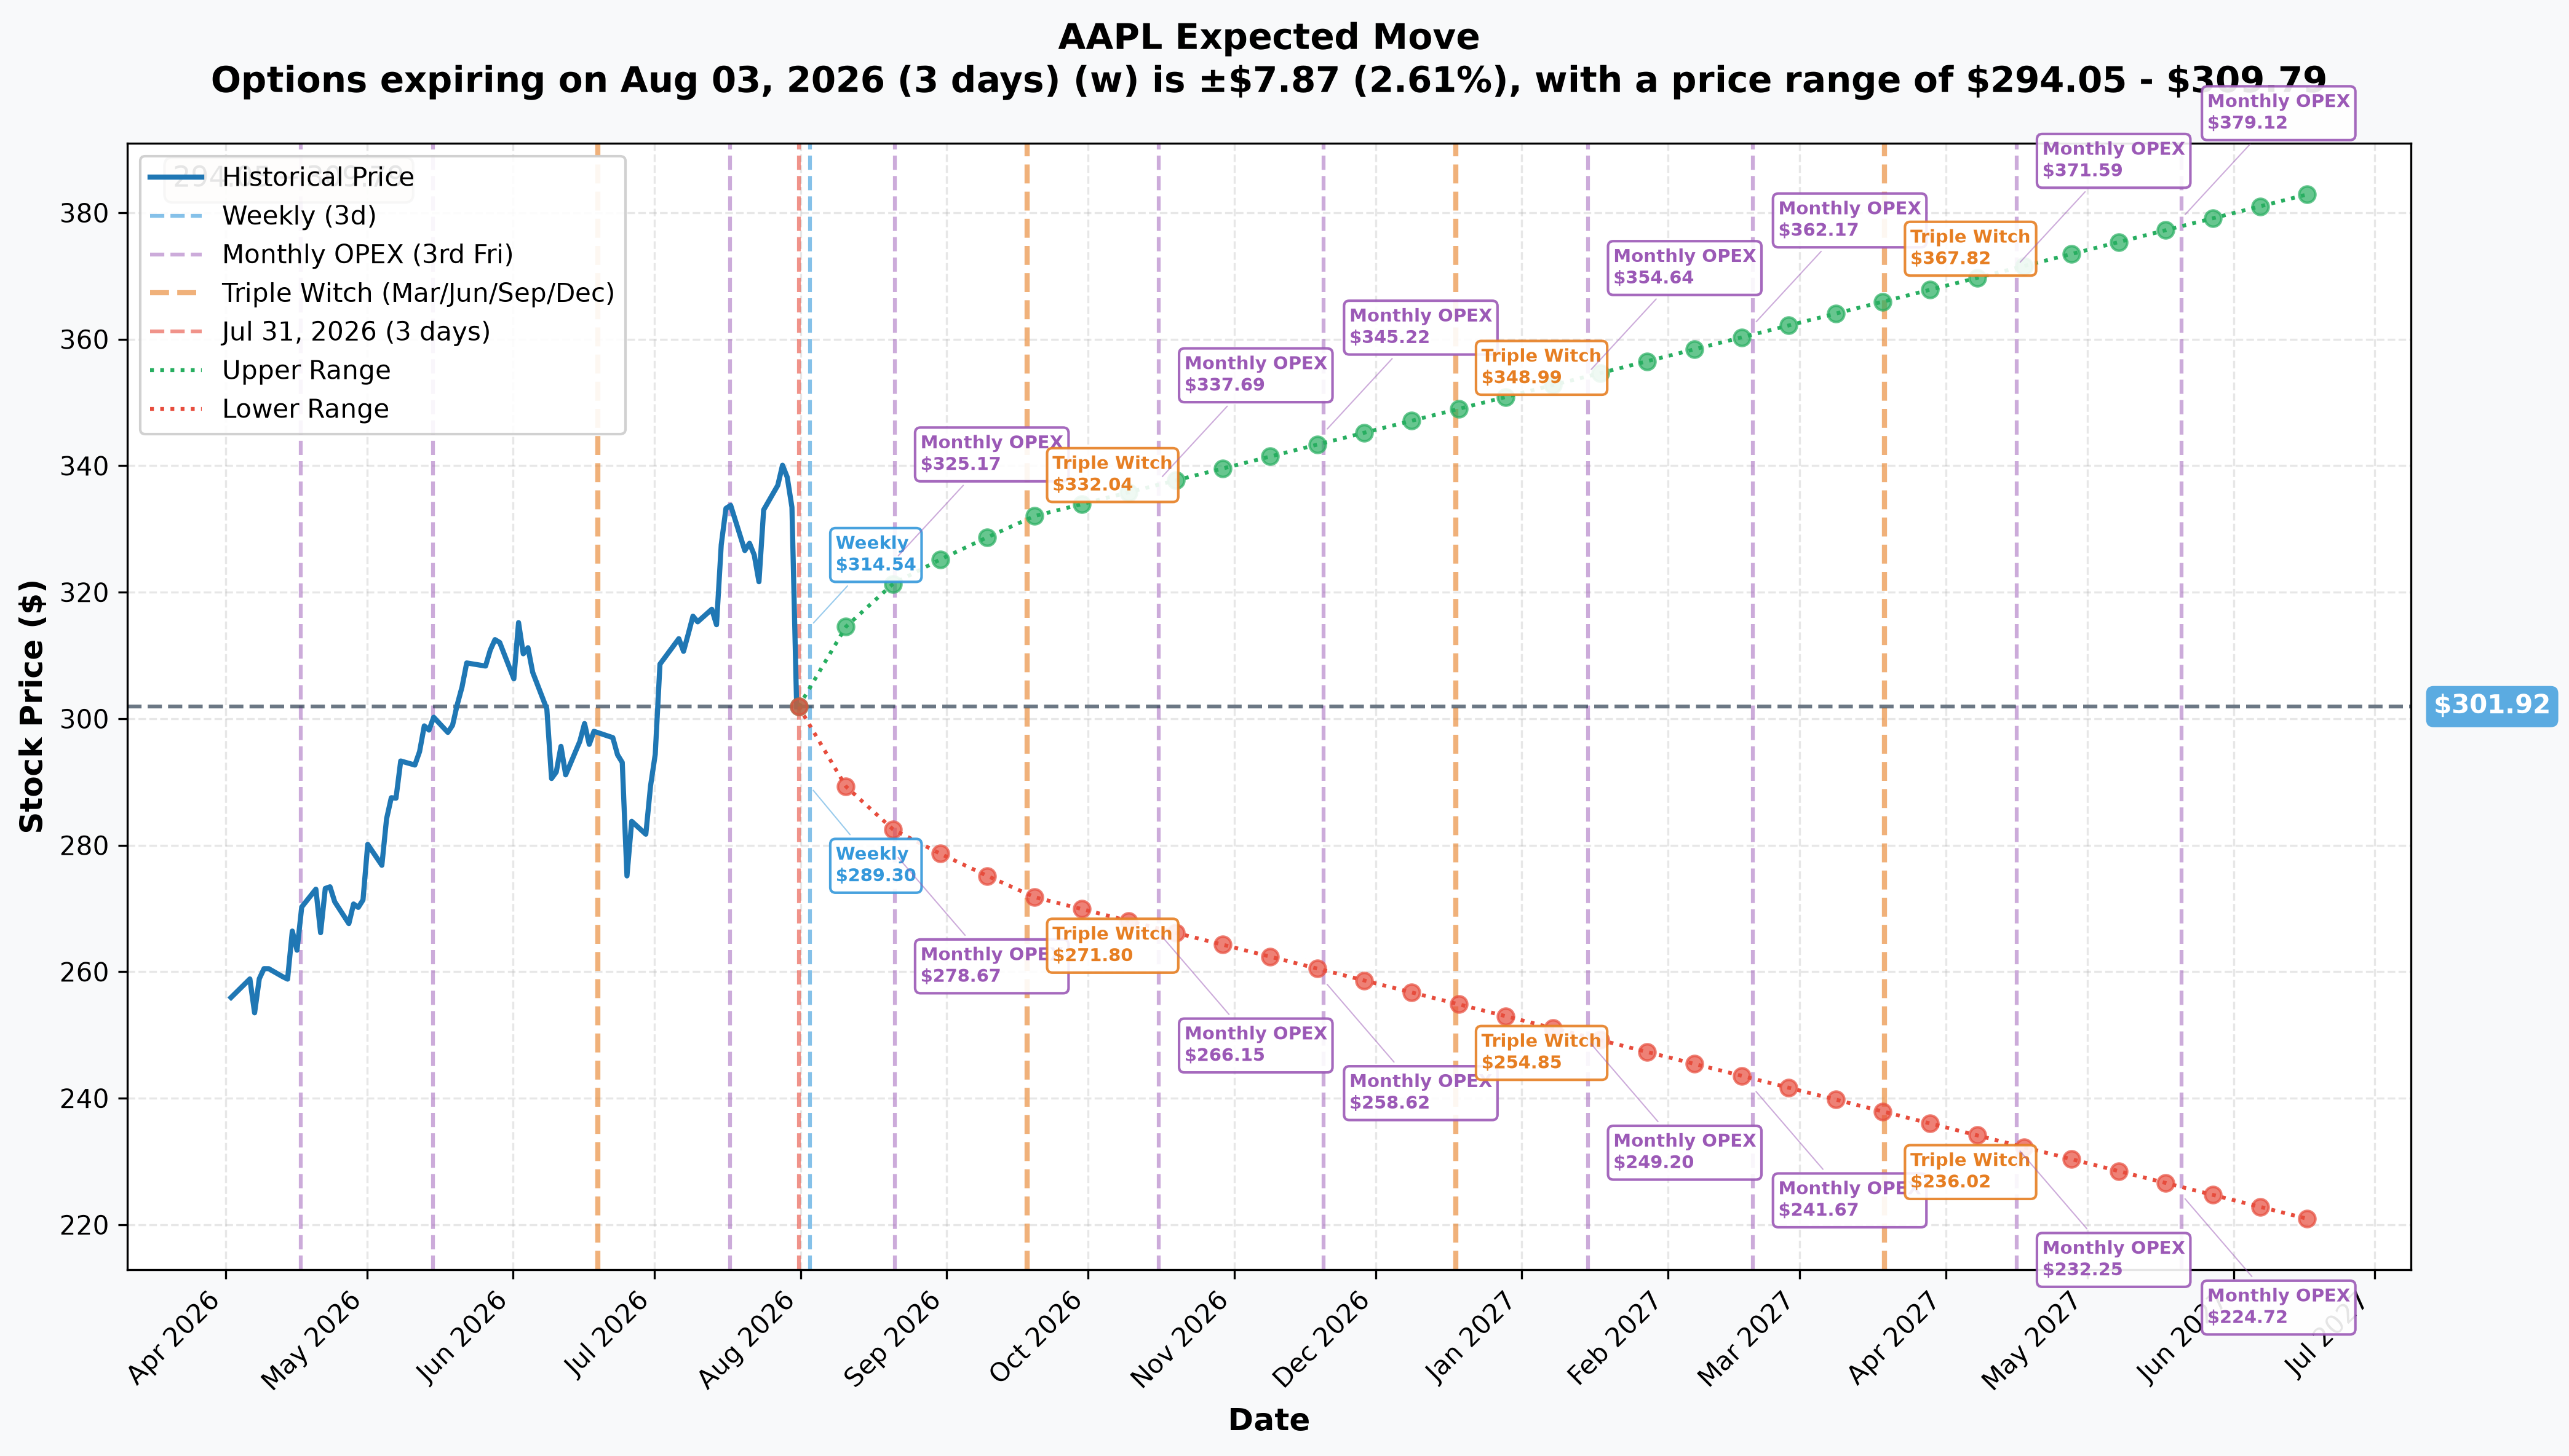
- Weekly (Aug 3, 3 days): ±2.61% (±$7.87) → range $294.05 – $309.79
- Monthly OPEX (Aug 21, 21 days): ±6.65% (±$20.09) → range $281.83 – $322.01
- Quarterly Triple Witch (Sep 18, 49 days): ±9.91% (±$29.93) → range $271.99 – $331.85
- LEAPS (Jun 17 2027, 321 days): ±26.88% (±$81.16) → range $220.76 – $383.08
The options market is pricing continued elevated uncertainty through the next few weeks — the weekly range alone spans ≈$15.75, unsurprising the day after a ≈9.5% earnings gap. None of these ranges are connected to today's conversion trade; they simply describe where the broader options market expects AAPL to trade.
🎪 Catalysts
📉 Just Happened — FQ3 2026 Earnings (2026-07-30, after the close)
Apple posted its strongest June quarter ever: revenue of $109.42B (+16% YoY), beating the $108.86B consensus, and diluted EPS of $2.02 (+29% YoY) on a 50.1% gross margin, per Apple's own newsroom release.
But the quality of that beat is thinner than the headline: Apple disclosed that ≈2 percentage points of gross margin and $0.11 of EPS came from one-time tariff refunds (Apple Newsroom). Strip that out and EPS was ≈$1.91 versus the $1.89 consensus — a ≈1% beat, not the headline ≈7%.
Two segments the market pays the highest multiple for both missed: Services revenue of $30.7B (+12.1%) came in below the $31.3B estimate, and Greater China revenue of $18.8B (+22.4%) missed the $19.5B estimate, per Yahoo Finance.
Guidance is what actually moved the stock: fiscal Q4 revenue growth of +9% to +11%, gross margin compressing to 47–48%, and supply constraints expected to "increase significantly sequentially," according to 9to5Mac's recap of the earnings call. CEO Tim Cook described the memory-chip market as a "100-year flood" in pricing and confirmed Apple has already raised Mac and iPad prices, per Yahoo Finance.
Correlation, not causation, worth being explicit about: today's ≈$904M conversion happened on the same day AAPL fell ≈9.5% to ≈$301.89, three sessions after the stock briefly touched a $5 trillion market cap on July 28, 2026. That timing is a coincidence of the calendar, not evidence the trade was reacting to the earnings miss — the structure itself proves it carries no directional lean either way.
👔 Confirmed — CEO handover, September 1, 2026
Tim Cook becomes executive chairman and John Ternus becomes CEO effective September 1, 2026, first announced April 20, 2026 per 9to5Mac. Ternus inherits the company days before the most complex product launch in years.
📱 Expected — iPhone 18 Pro + first foldable event, ≈September 9, 2026
Reporting points to ≈September 9, 2026 for the unveiling of the iPhone 18 Pro, iPhone 18 Pro Max, and Apple's first foldable iPhone, per MacObserver. The foldable is estimated at ≈$2,000–$2,500, well above Pro pricing — the most credible lever to offset rising memory costs. Apple has not announced an event date.
⚖️ Live litigation — App Store regulation on two continents
The EU General Court upheld the DMA gatekeeper designation of the App Store and iOS on July 8, 2026, per Euronews. Separately, the U.S. Supreme Court granted certiorari in Apple's contempt-ruling challenge in Apple v. Epic in late June 2026, per IPWatchdog.
🔎 Unresolved — the Google search-default appeal
Trial evidence showed Google paid Apple ≈$20 billion in 2022 alone to remain Safari's default search engine, per MacRumors. Both the DOJ/states and Google have pending appeals of the remedies ruling — this is near-pure-margin Services revenue at risk, with no scheduled resolution date.
📅 Next earnings — ≈Thursday, October 29, 2026 (EXPECTED, not confirmed)
Investing.com's earnings calendar lists October 29, 2026 with consensus revenue of ≈$114.70B, per Nasdaq. This is aggregator-sourced — Apple typically confirms its date ≈3–4 weeks ahead, so expect an official announcement in early October. It will be John Ternus's first earnings call as CEO.
📊 Analyst split — a ≈63% price-target spread
Post-earnings targets range from TD Cowen's $400 (Buy) to Barclays' $245 (Underweight), per MacDailyNews' analyst roundup. Consensus rating is "Buy" across 46 analysts with an average target of $321.57, per StockAnalysis.
🎲 Price Targets & Probabilities
These targets come from the gamma map and implied-move data above, describing where AAPL itself might trade — not from today's conversion trade, which has no directional lean to offer.
📈 Bull Case (≈25% probability)
Target: $320–$332 (monthly-OPEX and triple-witch upper implied-move bounds) Would require the market to conclude the FQ4 guidance cut is purely a supply problem (as Cook argued on the call), with the September foldable event and the Ternus transition landing cleanly. Needs to reclaim and hold above the $305–$310 gamma resistance cluster.
🎯 Base Case (≈50% probability)
Target: $282–$310 (between the $300 gamma wall and weekly/monthly implied-move bounds) Most likely path: consolidation around the dominant $300 gamma magnet while the market digests the tariff-refund-inflated beat, waits on the September product event, and prices the Ternus handover. This is squarely inside the weekly implied-move range of $294–$310.
📉 Bear Case (≈25% probability)
Target: $272–$282 (triple-witch lower bound to the $280 support wall) Would require confirmation that memory-cost inflation and Services/China softness persist into FQ4, that the "100-year flood" in component pricing bites deeper than guided, or that App Store regulatory losses compound. Barclays' $245 target implies a much larger ≈19% downside case still further out.
💡 Reading This Trade — Four Investor Lenses
🚀 YOLO Trader
There is nothing here to YOLO into. A conversion has no directional edge to copy — betting on AAPL direction because of this headline number would mean trading against a structure explicitly built to have zero exposure. If you want a directional AAPL trade today, look at the implied-move ranges above and the gamma walls, not this print.
⚖️ Swing Trader
Ignore the $124M headline entirely for swing positioning. The far more useful information for you is the $300 gamma wall (spot is glued to it) and the $305–$310 resistance cluster — those describe real dealer hedging flows that can influence near-term price action, unlike this delta-neutral package.
🛡️ Premium Collector
This is NOT a yield trade a retail account can replicate, and it's worth being explicit about why: the $123.66M "premium collected" on the calls is not free income — it's fully offset by the obligation created by the paired put and, more importantly, by the $903.7M of stock the desk bought to make the package delta-neutral. A retail account cannot access the block-cross mechanism, the same-second stock pairing, or the financing/borrow economics that make this worthwhile at institutional scale and pricing. Retail conversions/reversals exist as a concept, but at retail commission and margin rates the one-cent edge here would be entirely eaten by costs. Do not read this as "sell covered calls to collect premium" — it's a different animal.
🔰 Beginner
The lesson here is bigger than AAPL: a big scary options headline is not the same thing as a directional bet. "$124M call sale" sounds bearish. The reality — a same-second, same-strike, delta-hedged package — is about as directionally neutral as a trade can get. Before reacting to any big options print, always ask: is there a paired leg, and is there a paired stock trade? If yes, the "story" implied by a single leg's dollar size is usually wrong.
⚠️ Risk Factors & Honest Limits
- PROVEN, not inferred: the same-second pairing of the 3,000,000-share stock block with the option cross, the one-cent parity between the synthetic short price ($301.21) and the stock purchase price ($301.22), and the resulting near-zero package delta (−2,982,600 vs. +3,000,000 shares). These come directly off the OPRA tape and the equity tape at the same timestamp.
- INFERRED, not proven: who initiated this and why. We cannot see the broker, the counterparty, the customer's identity, or whether this financed a stock-loan position, a dividend/borrow trade, or a balance-sheet need. The economics strongly indicate a financing conversion — the structure leaves little room for another interpretation — but the specific motive is not visible on the tape.
- What the tape cannot tell us at all: any pre-existing position the trader may have been carrying before this print, any other hedges executed elsewhere (futures, swaps, other expirations), or whether this is one participant or two separate participants whose flows happened to net into a clean package.
- The honest takeaway: do not trade off this print. It is not a bearish signal on Apple, it is not a bullish signal, and it is not evidence of what "smart money" thinks about the stock. It is financing plumbing that happens to route through the options tape. If you want to form a view on AAPL after today's earnings, use the gamma levels, implied-move ranges, and the catalyst calendar above — not this trade.
Disclaimer: Options trading involves substantial risk of loss and is not suitable for all investors. This analysis is for educational purposes only and is not financial advice. Past performance does not guarantee future results. The trade discussed in this article carries essentially zero directional exposure by construction and should not be interpreted as a bullish or bearish signal on AAPL. Always do your own research and consider consulting a licensed financial advisor before trading.
Last updated: 2026-08-03 — confirmed that OPRA published no next-day open-interest record for either 0DTE leg, exactly as this article stated. Nothing further to resolve; the structural read is permanent.