🤝 AMZN $8M Short Deep-ITM Call Block — Collecting Premium Into Friday's Expiry
📅 June 15, 2026 | 🔥 Unusual Activity Detected
✅ Updated 2026-06-16: Next-day OPRA OI confirms a CLOSE — the June $225 call OI FELL 20,295 → 19,545 (Δ −750). The SELL was a sell-to-close (STC) of existing longs, not a fresh short. Direction read unchanged (a closing / position-reducing print, not a new directional bet).
🎯 The Quick Take
At 09:31:12 this morning, a desk crossed an ≈$8M block on Amazon (AMZN) — but this is NOT a bullish bet. They SOLD a deep in-the-money $225 call expiring this Friday (June 18), collecting the premium. With AMZN trading at ≈$246 and the strike 21 points in-the-money, this is a premium-collection / income play into a catalyst-light week — not a directional long. Both major near-term catalysts (Prime Day June 23–26, Q2 earnings ≈July 30) land after Friday's expiry, so the seller is purely harvesting time-value decay before the weekend.
📊 Company Overview
Amazon (AMZN) is the world's largest e-commerce marketplace, cloud provider, and digital-advertising platform:
- Market Cap: ≈$2.57 trillion
- Sector / Industry: Consumer Discretionary — E-Commerce, Cloud Computing (AWS), Digital Advertising
- What they do: Amazon runs three interconnected engines: a massive retail marketplace (both 1P and 3P), AWS (the #1 cloud platform powering much of the internet), and a fast-growing advertising business now pulling in tens of billions per year. AWS re-accelerated to +28% YoY in Q1 2026 — its fastest growth in ≈15 quarters, driven by AI demand. The stock sits ≈14% off its early-May all-time high near $279, reflecting investor anxiety over a ≈$200B 2026 AI capex bill even as the underlying business continues to put up record margins.
💰 The Option Flow Breakdown
📊 What Just Happened
A desk quietly crossed an $8M block at the open — but the direction here is SELLING, not buying. This isn't a bet that AMZN goes up. It's an income structure that profits from time decay and requires the stock to stay below (or near) $225 by Friday — a level it's already far above.
The Tape — June 15, 2026 @ 09:31:12: 🤝 Single-leg block cross
| Time | Buy/Sell | Call/Put | Expiration | Premium | Strike | Volume | OI | Size | Spot | Option Price | Option Symbol |
|---|---|---|---|---|---|---|---|---|---|---|---|
| 09:31:12 | SELL (credit) | CALL | 2026-06-18 | ≈$8M | $225 | 3,900 | 0 | 3,900 | $246.00 | $20.50 | AMZN20260618C225 |
Flow type: 🤝 Single-Leg Block Cross — this was a pre-arranged, negotiated block worked off the lit book between a buyer and a seller who already agreed on price. This is NOT a lit sweep, NOT a panic buy, NOT urgent directional aggression. A desk structured a premium-collection trade and crossed it as a block.
Order type: STO — Sold to Open. The prior OI on this strike/expiry was 0. Size 3,900 > prior OI 0 — this is an unambiguous fresh short position. The desk collected ≈$8M in premium upfront and now has an obligation to deliver shares (or cash-settle) at $225 if assigned.
✅ RESOLVED — Next-Day OI Confirms a Close (2026-06-16)
| Leg | Pre-print baseline (EOD 2026-06-12) | Resolving (EOD 2026-06-15) | Δ | Verdict |
|---|---|---|---|---|
| Jun-18 $225C (sell) | 20,295 | 19,545 | −750 | CLOSE — sell-to-close (STC) confirmed |
The next-morning OPRA snapshot resolves it: open interest fell from 20,295 to 19,545 (−750). A falling OI on a SELL confirms a sell-to-close — an existing long $225 call position being unwound, consistent with the same-day archive read. It is a partial close (the strike saw churn well beyond the net −750), but the direction of net open interest is down, so this is a position-reducing / income-style print, not a fresh short or a new directional bet.
🤓 What This Actually Means — Plain English
Let's break down what "selling a deep-ITM call" actually is in plain English.
Normally when we talk about unusual options flow, it's someone BUYING a call — paying a premium and betting the stock goes up. This is the opposite. The desk SOLD a call and collected ≈$8M upfront.
Here's the key math:
- Strike $225 vs spot $246 → the option is ≈$21 deep in-the-money. Of the $20.50 price collected, the vast majority is intrinsic value (≈$21 of real, exercise-today value). The remaining time value is the "juice" the seller is collecting before Friday.
- Expiry: this Friday (June 18, 2026) → only 3 trading days left. Time value is eroding fast. The seller is collecting that remaining decay.
- Breakeven for the seller: the seller profits as long as AMZN stays below $225 + $20.50 = $245.50 at expiry. With the stock at $246 right now, the stock is already just above the breakeven — the seller needs AMZN to drift down slightly (or stay flat) to maximize the trade.
Why would someone sell this?
Three most likely structures:
- Covered call writer: They own AMZN stock (or a deep-ITM call equivalent) and are selling this call against their position to generate income. They're saying "I'll give up any upside above $245.50 this week in exchange for $8M today."
- Cash-secured or margin-backed income play: They're synthetically replicating a short-stock / put position and collecting the premium as income ahead of a quiet expiry week.
- Financing / delta-neutral structure: They may have a paired hedge on the stock side that this option cross complements — effectively a synthetic position with known economics.
What the seller WANTS: AMZN to drift sideways or lower into Friday. Every day this week, the remaining time value on these options bleeds away in their favor. By Friday close, if AMZN is below $245.50, they've collected maximum profit on the time value component.
What the seller DOES NOT want: AMZN to spike sharply higher (say above $260+) before Friday. In that case, the short call loses money on a mark-to-market basis — though if they're hedged with stock, that loss is offset.
This is NOT a bearish bet on AMZN. It's an income trade expressing a view that the stock won't move dramatically in either direction this week — a short-volatility structure.
📈 Technical Setup / Chart Check-Up
YTD Performance
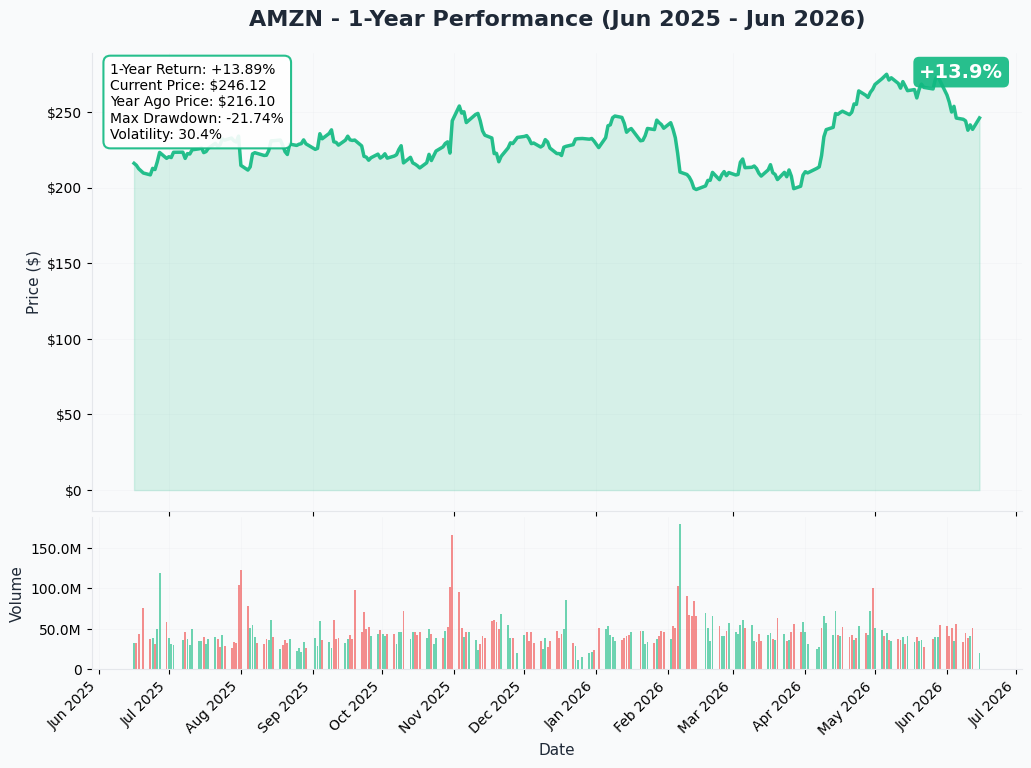
Amazon had a strong start to 2026, riding the AWS re-acceleration and AI spending tailwinds to an all-time high near $279 in early May — then gave back ≈14% of that run as investors got cold feet about the ≈$200B 2026 capex commitment. The stock is now consolidating in the $233–$246 area, right where the seller chose to cross this block.
Key observations:
- 📉 ≈14% off the May all-time high of ≈$279 despite record Q1 operating income of ≈$23.85B
- 📊 The selloff reflects the capex debate, NOT a fundamental deterioration — AWS grew +28% YoY in Q1, fastest in ≈15 quarters
- 🎯 Spot at ≈$246 sits well above the $225 strike, giving the short-call seller a meaningful buffer into Friday
Gamma-Based Support & Resistance
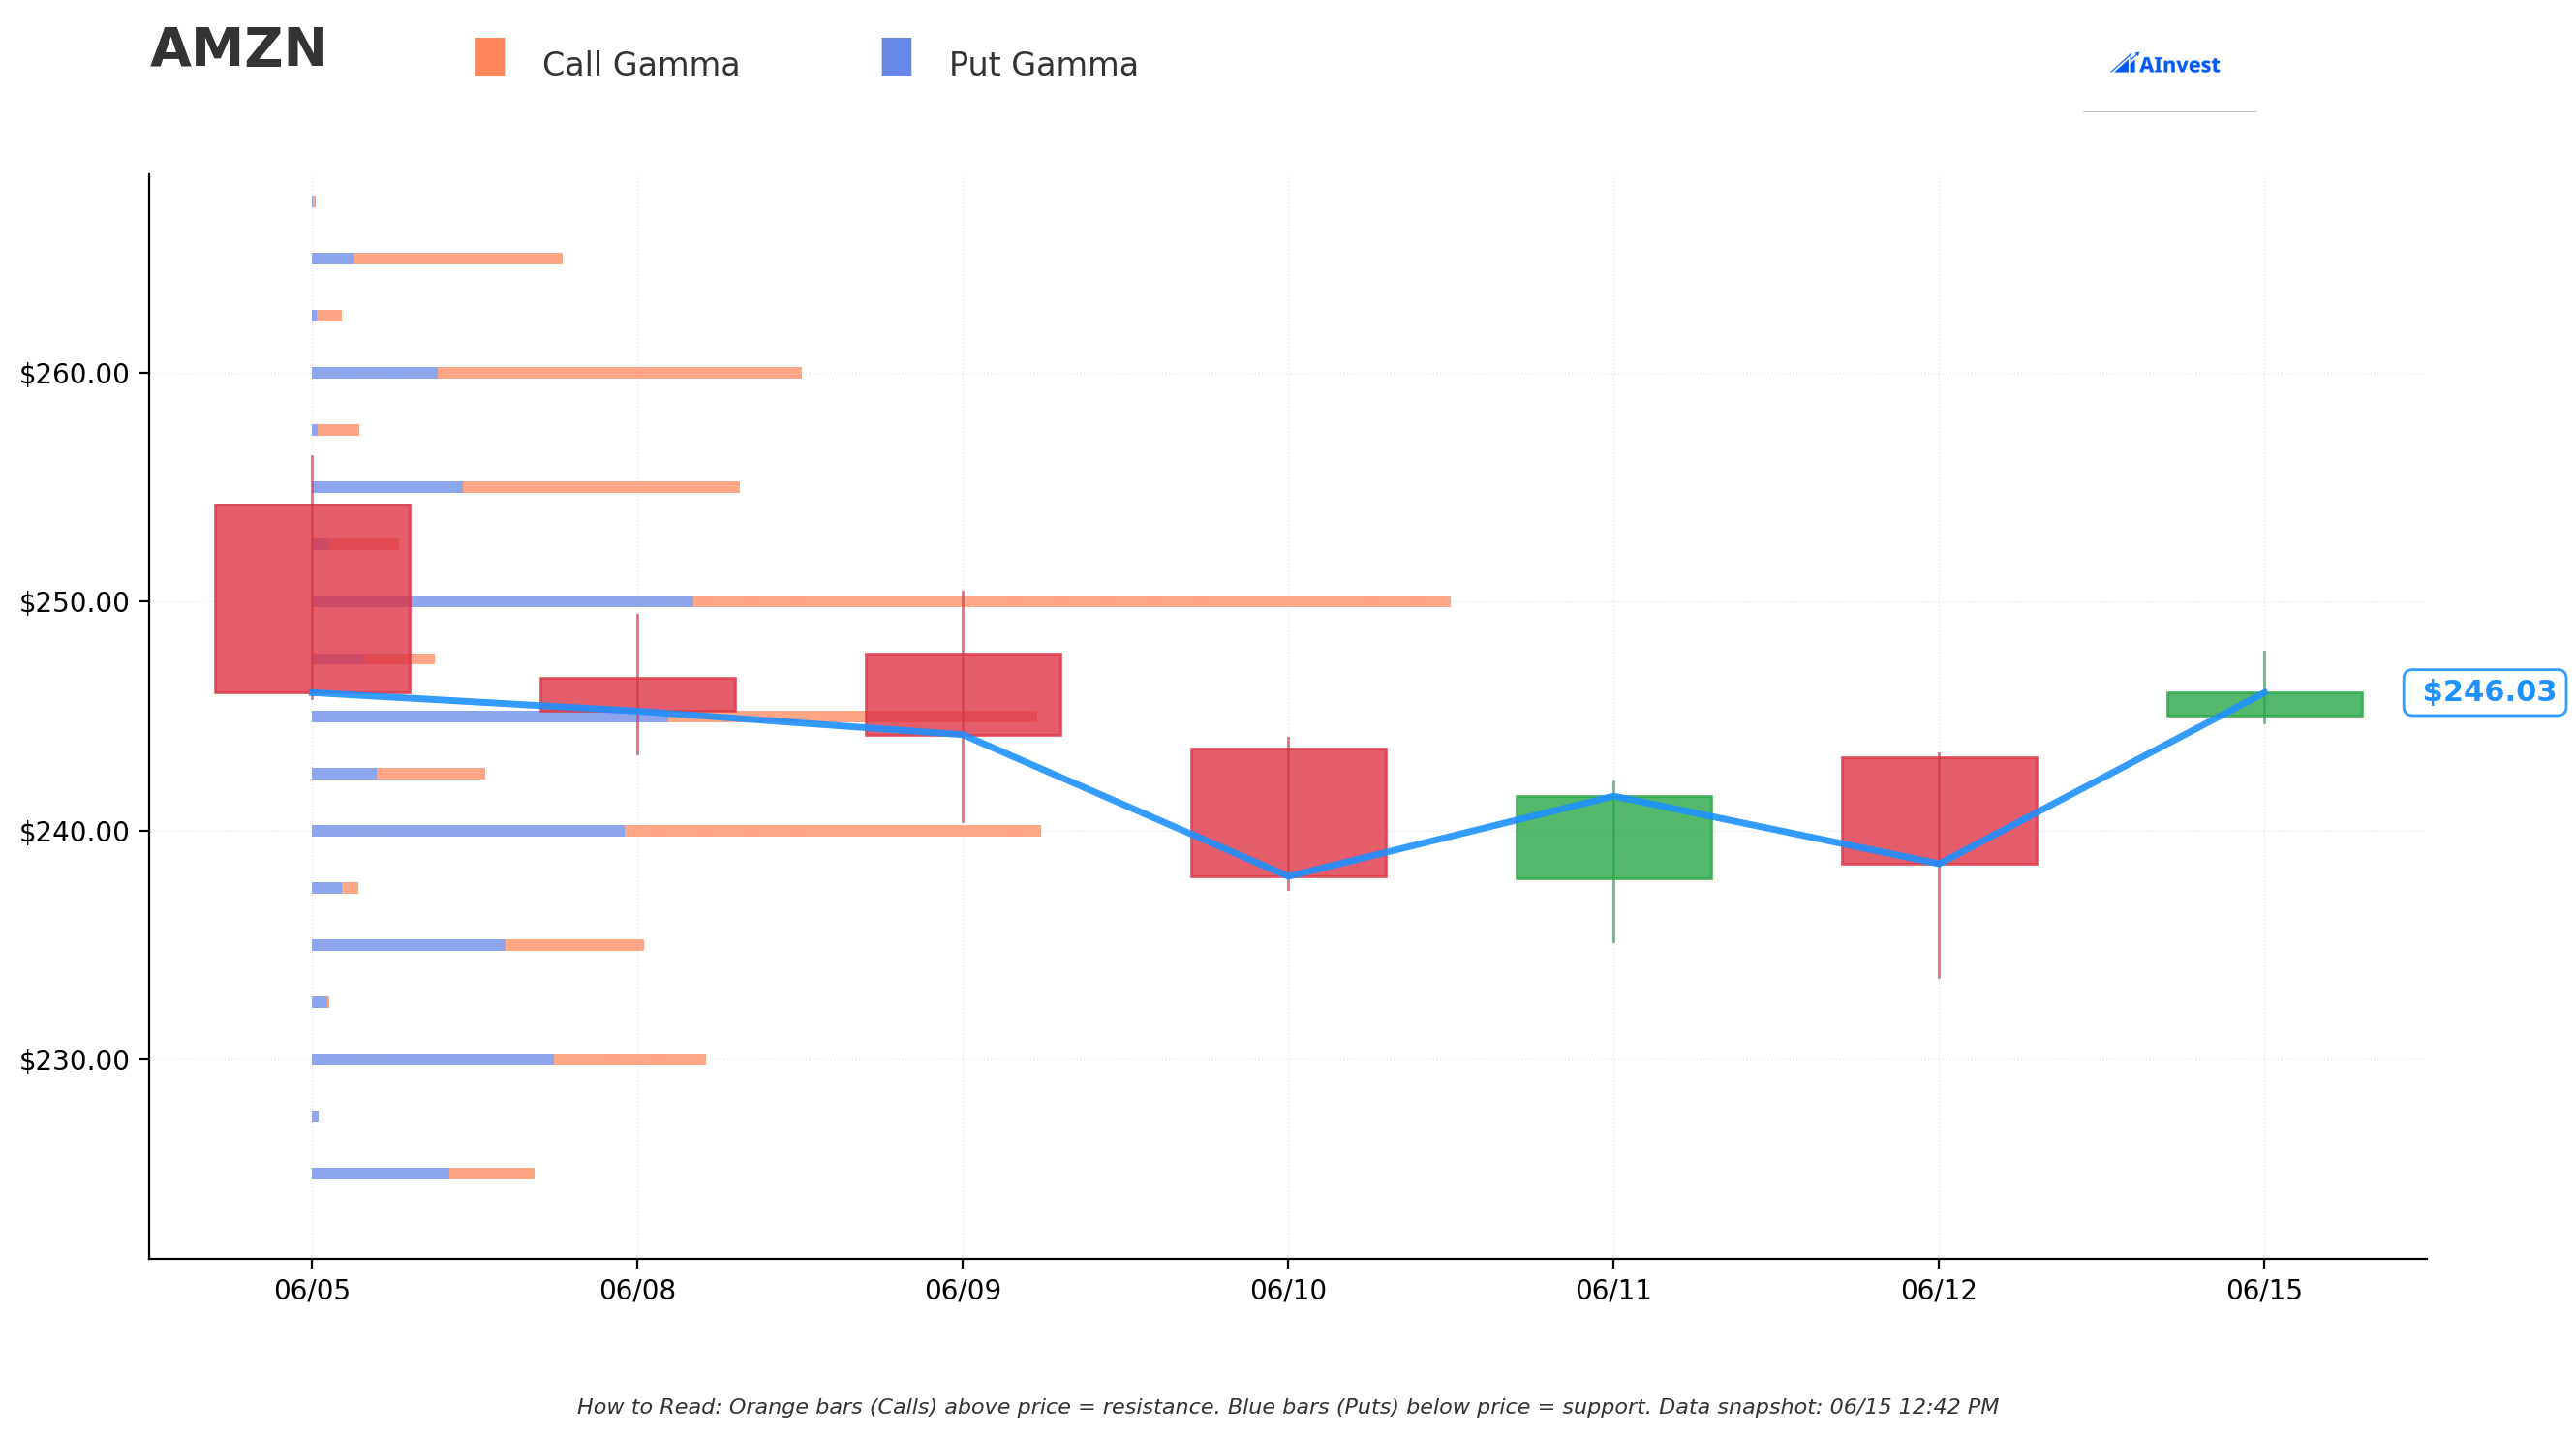
Current Price: ≈$246.00
The gamma exposure map shows clear structure on both sides:
🔵 Support Levels (Put Gamma Below Price):
- $245 — First gamma floor, just below current spot. Market makers defending this level creates a mild gravitational pull; a drift below $245 would be the first technical test this week.
- $240 — Stronger support. A meaningful put-gamma cluster that acts as a floor. A break below $240 would signal deteriorating near-term sentiment and is the key level for the short-call seller to monitor as their breakeven risk.
- $230 — Deep support. A durable gamma wall further below; a move here this week would be a significant adverse move for the seller, though still manageable given the $20.50 premium collected.
🟠 Resistance Levels (Call Gamma Above Price):
- $250 — First call-gamma wall above current price. Options positioning creates mechanical selling pressure as AMZN approaches $250 — this is the near-term ceiling the market is pricing in, and the short-call seller benefits if the stock stalls here.
- $255 — Second resistance. Breaking $250 and reaching $255 would start to put the seller's position under meaningful mark-to-market pressure, especially if it happens quickly.
- $260 — Strong resistance further up. A move through $260 this week would be a significant adverse development for the short-call position.
Translation for traders: The gamma structure shows AMZN is likely to stay pinned between $240 and $255 this week, with $245–$250 as the near-term gravity zone. That's a favorable environment for the short-call seller — the stock needs to drift away from the $225 strike, which it already has at ≈$246.
Implied Move Analysis
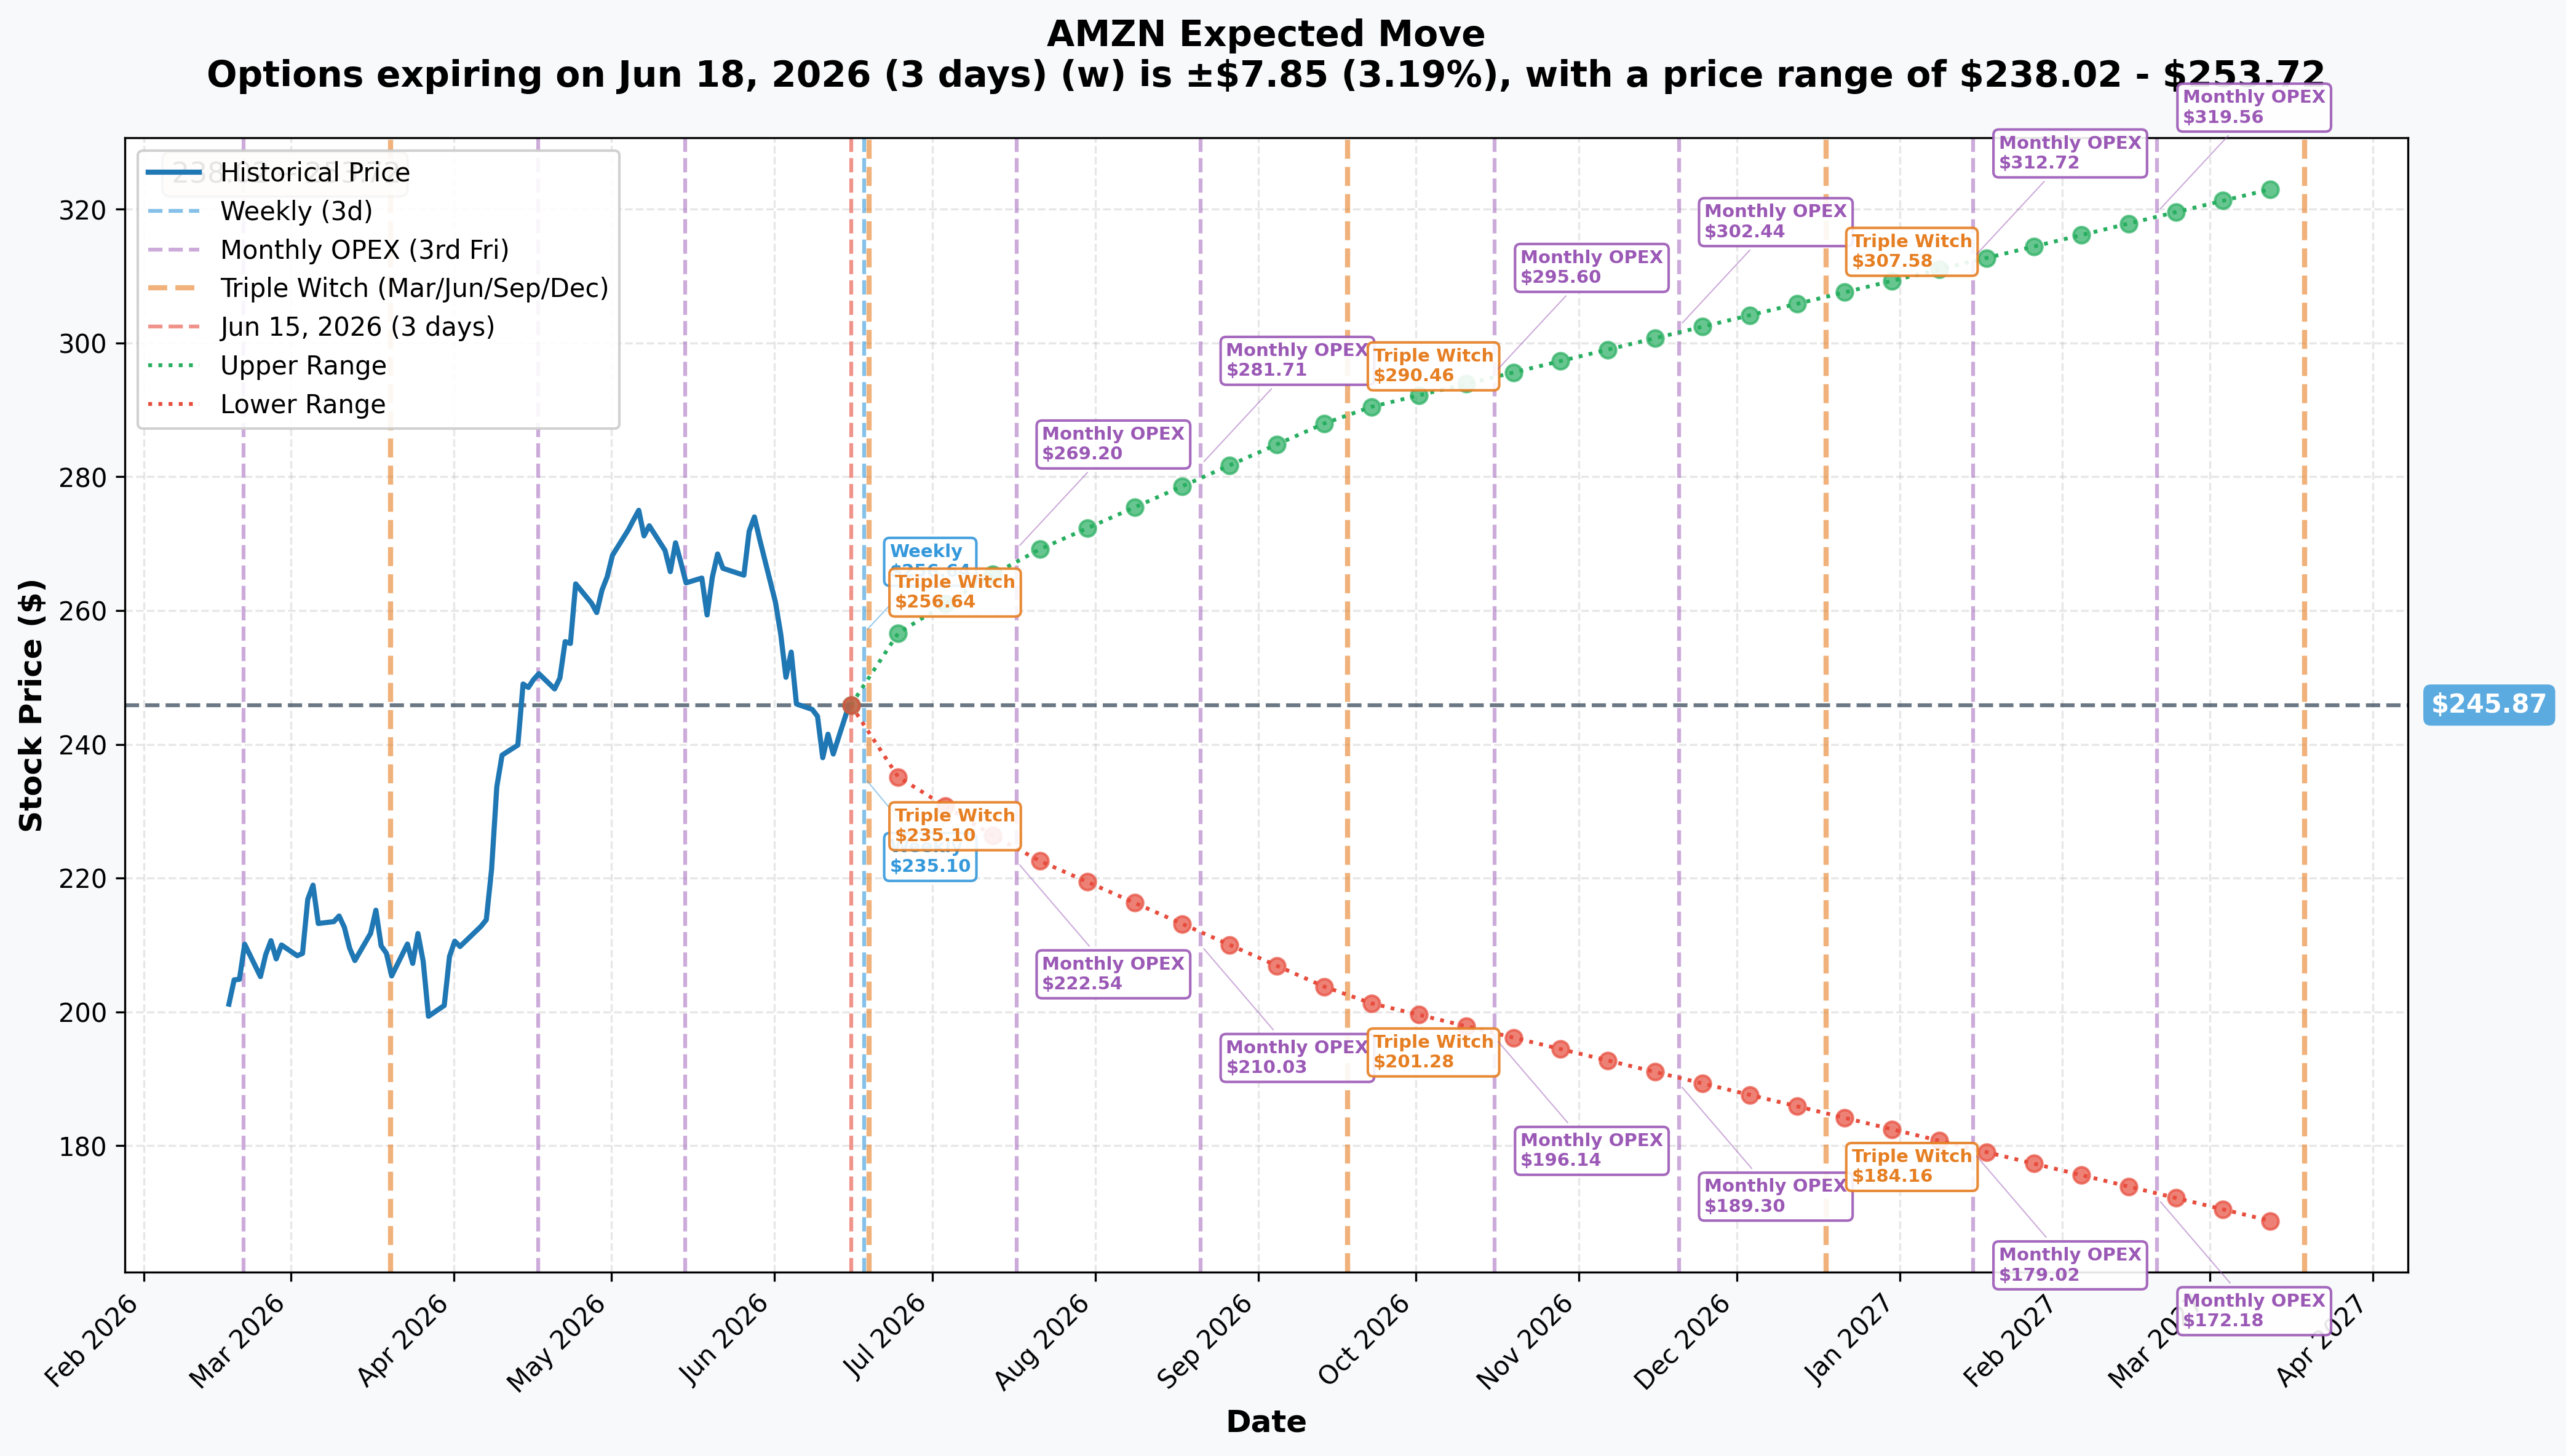
The options market is pricing in clear ranges across time horizons:
- 📅 Weekly (exp 2026-06-18, 3 days): This is the expiry sold. The gamma and theta structure into Friday points to an expected drift range — the short-call seller is positioned for the lower end of the weekly move.
- 📅 Monthly (exp 2026-07-17): ±8.92% from ≈$246 → Range $223.93 – $267.81. Prime Day (June 23–26) and Q2 earnings (≈July 30) are the catalysts that will drive the monthly move, but they both land after this Friday's expiry.
Key takeaway: The short-call seller chose the expiry that sidesteps both major catalysts — a deliberate income play into the calm before the storm.
🎪 Catalysts
Already Happened (Context for Current Price Level)
Q1 2026 Earnings — Blowout Beat (Reported April 29, 2026)
- Revenue $181.5B, +17% YoY; EPS $2.78 vs ≈$1.63 consensus — a ≈70% upside surprise
- AWS $37.6B, +28% YoY — fastest growth in ≈15 quarters; driven by enterprise AI workload demand
- Operating income ≈$23.85B, record operating margin ≈13.1%
- The catch: Q1 capex hit ≈$43.2B with TTM FCF down ≈95% on the AI build-out — the market dipped slightly post-earnings despite the beat. This is the overhang that has weighed on the stock ≈14% since the May high.
Anthropic Deepening + Custom Silicon Milestones (April–May 2026)
- Amazon committed up to $25B in new Anthropic investment, with Anthropic committed to >$100B of AWS spend over 10 years
- Trainium/Inferentia now at >$20B annualized run-rate with triple-digit growth — ≈7 GW of Trainium demand locked in from Anthropic + OpenAI commitments
Analyst Upgrades / Price Targets (May–June 2026)
- Truist Securities $320 target (May 29, 2026); Bank of America reiterated Buy June 1, 2026 targeting a new high near $310
- Consensus: 41 analysts, average target ≈$312.78 — ≈28%+ upside from current levels
Upcoming Catalysts — Both AFTER This Friday's Expiry
⚠️ Prime Day 2026 — June 23–26, 2026 (8–11 days away — AFTER expiry) Amazon pulled Prime Day forward from its usual July slot to June 23–26 this year, making it a four-day event. CNBC Select confirmed the June 23–26 date — this is a major Q2 retail and advertising volume driver. The Prime Day result read-through lands in the July earnings print, not before Friday. The short-call seller deliberately sidestepped Prime Day risk by choosing the June 18 expiry.
⚠️ Q2 2026 Earnings — ≈July 30, 2026 (after close) (≈45 days away — AFTER expiry) Consensus EPS ≈$1.81–$1.82; Amazon's own Q2 guide is $194B–$199B net sales and $20B–$24B operating income — above prior consensus. AWS growth durability (+28% or above?) and any FCF stabilization signal will be the key swing factors. Per Wall Street Horizon, this is the most anticipated event on AMZN's calendar this summer. The short-call seller avoids this binary event entirely.
This is the whole point of the trade structure: by selling a call that expires June 18, the desk collects premium in a catalyst-light window with no scheduled news before Friday that would spike volatility or move the stock dramatically.
🎲 4-Reader Interpretation
🚀 YOLO Trader
This trade is not your style — it's the opposite of a leveraged long. The desk sold $8M worth of premium and is hoping nothing happens this week. If you're watching AMZN for a trade, the action this week is likely to be range-bound between $240–$255 (the gamma zone). The more interesting setup for you is after Prime Day results and heading into Q2 earnings on ≈July 30 — that's where the volatility (and the YOLO opportunity) lives. The July or August call options with strikes $255–$270 would be the structure to watch if you believe the analyst consensus $312 target is reachable.
📊 Swing Trader
The $250 gamma wall is your near-term ceiling to watch. AMZN has been consolidating in the $233–$246 range after the May pullback — a clean break and hold above $250 would be technically significant and could attract momentum buyers ahead of Prime Day. The short-call structure today is a signal that at least one sophisticated desk expects a quiet week. Swing setup: watch for a confirmed close above $250 on volume pre-Prime Day; the $255–$260 zone is the next meaningful resistance. If AMZN fades back toward $240 this week, that level offers a better risk/reward entry for a June-into-July swing ahead of earnings.
🛡️ Premium Collector
This desk is doing exactly what premium collectors love: selling near-dated, deep-ITM options to harvest intrinsic + remaining time value. The structure here — STO a deep-ITM near-dated call — is the "covered call" family of strategies, generating income against an existing or synthetic long position. If you're a premium-collection trader watching AMZN, note that the gamma map shows the $245–$250 zone as a natural range this week. Near-term cash-secured puts around $238–$240 (at the next gamma support below current price) for June 18 could generate income with the gamma floor as your backstop. Avoid carrying anything naked through Prime Day (June 23–26) or into Q2 earnings.
🌱 Entry-Level / Beginner
Here's the plain-English version: someone at a big firm just sold a call option and collected ≈$8 million in cash. Think of it like a landlord collecting rent — they got paid upfront and now have a short-term obligation. The "rent" here is the option premium ($20.50 per contract × 3,900 contracts × 100 shares = ≈$8M). The key difference from a typical long-call bet you read about: the seller WANTS the stock to stay calm or drift lower. They chose an option that expires this Friday — just 3 days away — so there's almost no time left for the option to gain additional value. The clock is their friend. This is called "selling to open" (STO) — starting a short options position to collect premium income. It's a common strategy used by institutions and covered-call writers to generate income on positions they already hold. The max they can collect is the $8M they received. The risk: if AMZN rips sharply higher before Friday, the short call could lose money — but most premium sellers manage that with a hedge or by holding the underlying stock.
⚠️ Risk Factors
Options trading involves substantial risk of loss and is not suitable for all investors. Key risks specific to this trade and the broader AMZN setup:
Short-Call Risk: An Unexpected Spike Before Friday The seller's breakeven is ≈$245.50. With AMZN at $246, the stock is already marginally above this. Any unexpected positive catalyst this week — macro surprise, AWS deal announcement, or sector-wide tech rally — could push the stock toward $255+ and put the short call under mark-to-market pressure. That said, no major scheduled catalyst exists before Friday (Prime Day starts June 23, earnings are ≈July 30), which is why the desk chose this expiry.
Capex / FCF Overhang — The Structural Bear Case Amazon's 2026 capex is guided ≈$200B, with cumulative 2026–2027 spending tracking ≈$344B. TTM free cash flow fell ≈95% on this build-out — the market punished the stock even after a blow-out Q1 beat. The AI monetization payoff is multi-year; any sign of AWS growth deceleration below +25% would hit the multiple hard.
Prime Day Execution Risk (Post-Expiry) Prime Day 2026 is June 23–26 — the short-call seller avoids this directly, but holders of longer-dated positions should be aware that a disappointing Prime Day event or soft ad-revenue read could weigh on the stock heading into Q2 earnings.
Q2 Earnings Binary (Post-Expiry, ≈July 30) This is the biggest event on the calendar for AMZN in the near term. Company Q2 guide is $194B–$199B revenue, $20B–$24B operating income — above prior consensus. If AWS growth decelerates or the FCF picture worsens, the stock could give back more of its gains from the May high.
What the OPRA Tape CANNOT Tell Us: We know the mechanism (single-leg block cross), size (3,900 contracts), price ($20.50 collected), and that OI was 0 (unambiguous fresh open / STO). We do not know the seller's identity, whether they hold an offsetting stock position (making this a covered call), or their precise stop-out level. We interpret the tape; we don't read minds. The trade COULD be a pure naked short (very high-risk) or, far more likely, part of a larger hedged book.
🎯 The Bottom Line
Here's the deal: a desk just crossed an ≈$8M income play on Amazon — collecting premium by selling a deep-ITM call that expires this Friday. This is not a whale betting Amazon goes higher. It's a sophisticated desk harvesting time value in a catalyst-light week, deliberately sidestepping Prime Day (June 23–26) and Q2 earnings (≈July 30).
The math: with AMZN at ≈$246 and the $225 call at $20.50, the seller's breakeven is ≈$245.50. The stock needs to finish below that on Friday for the seller to have fully maximized their income — and with both major catalysts post-expiry and the gamma map showing $245–$255 as the natural range, the setup is deliberately quiet.
What to watch this week:
- 🎯 $245.50 — the seller's breakeven. Stock drifting below here is pure profit for the desk.
- 🎯 $250 — the key gamma resistance. A clean break above $250 starts to create mark-to-market pressure on the short.
- 🎯 $240 — the gamma support floor. If AMZN dips here, the short call gets more comfortable.
- 📅 Friday June 18 close — AMZN Jun-18 $225C expiry. The deck is structurally cleared after Friday's close.
- 📅 Tuesday ≈06:30 ET (June 16) — OPRA OI snapshot confirms this as a fresh STO (expected OI ≈3,900; prior OI was 0).
- 📅 June 23–26 — Prime Day begins. The NEXT major catalyst window after this expiry.
- 📅 ≈July 30 — Q2 2026 earnings. The big binary event for AMZN longs.
If you're watching AMZN this week: Expect a relatively calm range. The gamma structure ($240–$255) and the absence of scheduled catalysts before Friday both point to a consolidation period. The action begins next week with Prime Day.
If you're bullish on AMZN medium-term: Analyst consensus at ≈$312.78 with a Buy rating from 41 analysts is a compelling long-term thesis if AWS holds the +28% growth rate and the AI capex spend starts returning FCF. The short-call trade today is irrelevant to that thesis — it's a desk collecting income in the near-dated window.
An $8M block cross on a deep-ITM short-dated call — quiet, deliberate, income-oriented. The seller chose the one expiry this summer that avoids both major catalysts. That's not a coincidence.
Disclaimer: Options trading involves substantial risk of loss and is not suitable for all investors. This analysis is for educational and informational purposes only and does not constitute financial advice. Selling call options — particularly deep-in-the-money options — carries significant risk, including potentially unlimited losses if the position is not hedged with an offsetting stock or option position. Short options can result in assignment obligations. Past unusual options activity does not guarantee future returns. Always conduct your own due diligence and consider consulting a licensed financial advisor before making any trading decisions. Open/close classification is based on size-vs-prior-OI inference (prior OI = 0 → unambiguous fresh open) and will be confirmed by the next-day OPRA open interest snapshot (≈06:30 ET June 16, 2026).
Last updated: 2026-06-16 — next-day OPRA OI confirmed a close (STC, −750).