🔄 AMZN $49M Roll: Smart Money Cashes a Deep-ITM September Winner, Redeploys $98M Into November — Into the Earnings Expiry
📅 2026-07-31 | 🤝 Block Cross Detected — A Roll, Not a New Bet
✅ UPDATE — August 3, 2026 pre-market: the OI check is in and it confirms the roll. November $240 calls 2,429 → 26,796 (+24,367) = opening; September $220 calls 14,567 → 6,592 (−7,975) = closing. The STC + BTO roll framing below stands, confirmed. See the ✅ RESOLVED box.
🎯 The Quick Take
On the same day AMZN posted its best single-day gain in 11 years (+≈14.9%) after a blowout AWS quarter, a desk quietly rolled a deep-in-the-money call position — selling 10,000 September $220 calls to close and buying 25,000 November $240 calls to open, all in one negotiated 🤝 block cross at 11:30:13. This is position management, not a fresh conviction bet: they cashed an existing winner and redeployed into 2.5× the contracts, $20 higher, and — critically — into the expiry that actually contains Amazon's next earnings report. The genuinely new money at risk is $49.0M net, not the $98.3M headline on the buy leg alone.
📊 Company Overview
Amazon.com, Inc. (AMZN) operates three reportable segments — North America (online and physical retail, third-party seller services, subscriptions, advertising), International, and Amazon Web Services (AWS), the world's largest public cloud provider. Growing fast alongside the core business are advertising, custom AI silicon (Trainium/Inferentia), Amazon Leo satellite broadband, and the Zoox robotaxi unit.
- Sector / Industry: Consumer Discretionary — Broadline Retail (also the largest public cloud infrastructure provider)
- Market Cap: ≈$2.91 trillion (2026-07-31)
- Price at the time of this trade: $267.07 (spot printed on the trade), stock trading ≈$270–271 intraday
- 52-week range: $196.00 – $278.56
💰 The Option Flow Breakdown
📊 What Just Happened — 🤝 BLOCK CROSS
Both legs printed together at 11:30:13, negotiated off the open book as a genuine multi-leg cross — a known counterparty took the other side of this whole package at once. This was not a lit sweep and there's no urgency implied by the mechanism itself.
| Time | Symbol | Buy/Sell | Call/Put | Expiration | Premium | Strike | Volume | OI (prior) | Size | Spot | Option Price | Option Symbol |
|---|---|---|---|---|---|---|---|---|---|---|---|---|
| 11:30:13 | AMZN | BUY | CALL | 2026-11-20 | $98,250,000 | $240 | 25,372 | 2,429 | 25,000 | $267.07 | $39.30 | AMZN20261120C240 |
| 11:30:13 | AMZN | SELL | CALL | 2026-09-18 | $49,250,000 | $220 | 10,226 | 14,567 | 10,000 | $267.07 | $49.25 | AMZN20260918C220 |
🤝 BLOCK CROSS — Long Call Roll, up and out. Net debit $49.00M (paid $98.25M on the new leg, collected $49.25M closing the old one). The September $220 call was deep in-the-money — spot $267.07 against a $220 strike is $47.07 of pure intrinsic value, with only ≈$2.18 of time value left on the $49.25 sale price. Contract count jumped 2.5× (10,000 → 25,000) and the strike moved $20 higher into a later expiry.
A 1,000,000-share stock block printed at $267.375 at 11:34:04 — 3 minutes 51 seconds after the option cross, and close to the package's net delta of +983,250 shares. That timing gap means this is INFERRED, not proven, to be the hedge for this specific package — consistent with it, not confirmed by a simultaneous print.
✅ RESOLVED — It Was a Roll. Both Legs Confirmed, Exactly as Framed.
This callout mattered more than usual because the two legs read very differently — and the August 3 pre-market OPRA snapshot confirmed both, in opposite directions, which is the signature of a genuine roll:
| Leg | Baseline OI (Jul 31 snap) | Resolving OI (Aug 3 snap) | Δ | Print size | Δ as % of print | Verdict |
|---|---|---|---|---|---|---|
| Nov-20-2026 $240 Call (bought) | 2,429 | 26,796 | +24,367 | 25,000 | ≈97.5% | ✅ OPEN (BTO) — roll-open leg |
| Sep-18-2026 $220 Call (sold) | 14,567 | 6,592 | −7,975 | 10,000 | ≈−80% | ✅ CLOSE (STC) — roll-close leg |
The two legs moved in opposite directions, and that is the whole point. Open interest is only created when a position opens and only destroyed when one closes. The November $240 strike gained 24,367 contracts against a 25,000-lot print — ≈97.5%, essentially the entire buy converted into new exposure. The September $220 strike lost 7,975 contracts, shedding more than half of everything that existed there. A sale landing on a shrinking strike cannot have opened new short exposure.
Our "primarily a close" read was right, and the alternative is ruled out. We named the test in advance: "OI staying elevated or rising would mean part of this was a fresh short-call open instead." It fell hard. The fresh-short-call reading is dead, and the STC + BTO roll framing throughout this article stands confirmed.
One honest nuance on the September leg. Open interest fell by 7,975, not the full 10,000 — so roughly 80% of the sale genuinely retired contracts while the remaining ≈2,025 changed hands rather than being extinguished. In plain terms: most of the counterparty let the position go, but a minority simply took over the other side. That does not change the structure — this desk's September exposure is gone either way — it just means the strike as a whole shrank slightly less than the print size.
🤓 What This Actually Means — Plain English
Think of this less as "someone just bet $98 million on Amazon" and more like refinancing a mortgage that's deep underwater in their favor. They already owned September $220 calls that had ridden Amazon's rally to $267 — those calls were basically worth their intrinsic value plus a sliver of time premium. Selling them (STC — sell to close) locked in the gain and put $49.25M of cash back in their pocket.
Instead of walking away, they took that cash plus more and bought (BTO — buy to open) 2.5× as many November $240 calls. Same directional bet — still bullish, still calls — just bigger, higher strike, later expiry. The net new money is $49.0M, the difference between what they paid and what they collected. That's the real size of the incremental bet, not the $98.25M sticker price on the buy leg.
Why the Nov expiry matters: the September 18 contracts expire before Amazon's next earnings report. The November 20 contracts expire after it — Q3 earnings are expected around October 22, 2026 (not yet company-confirmed). By rolling out to November, this position now owns Amazon's next earnings event, plus the Q4/holiday guidance that typically comes with it. Rolling into the event-bearing expiry, right after the stock's biggest one-day pop in over a decade, reads as a deliberate decision to stay long through the next catalyst rather than a walk-away-with-the-money moment.
This was a negotiated cross, not an aggressive sweep. A desk (or a broker facilitating for a client) pre-arranged both legs with a counterparty and crossed them together off the lit book. That's deliberate portfolio management — extending an existing winning position — not a screen-slamming, urgent new conviction trade. Treat it as thoughtful positioning, not a signal to chase.
📈 Technical Setup / Chart Check-Up
YTD Performance Chart
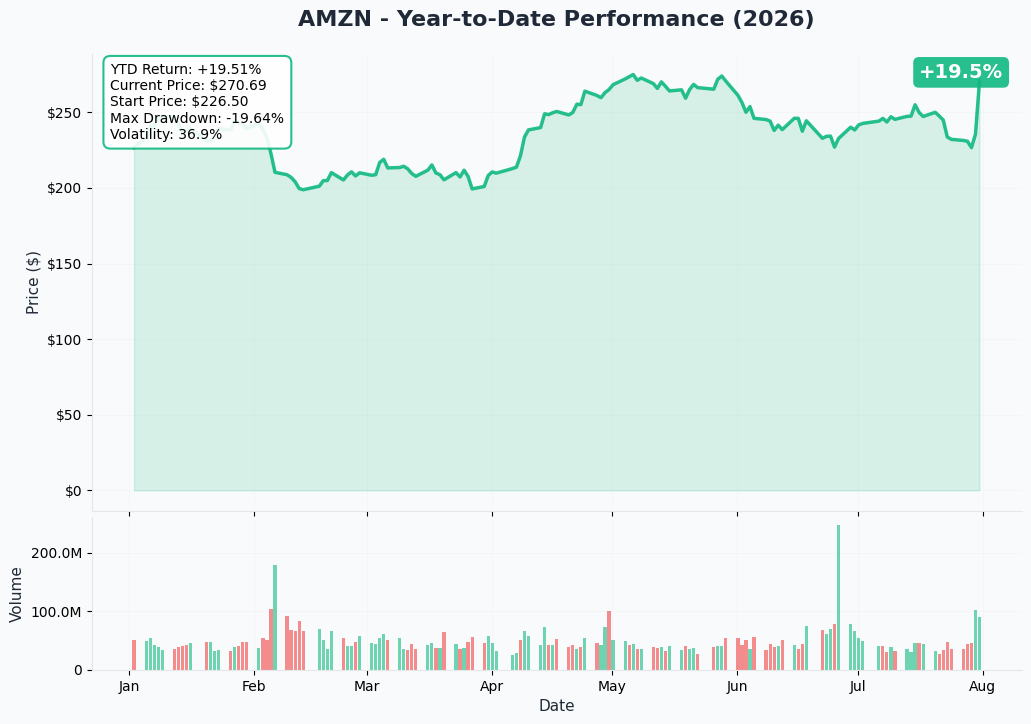
Amazon closed $235.50 on July 30 and gapped to the ≈$259–272 range on July 31 after the Q2 print — its best single day in 11 years. Zooming out, the stock closed $238.34 on June 30, meaning the roughly 3-month trend is close to flat once you account for the round trip: AMZN made an all-time-high close of $274.99 on May 6, drifted down through June and most of July, and this earnings gap simply restored it to roughly where it traded in early May. The stock now sits within ≈3% of both its all-time high close ($274.99) and 52-week high ($278.56) — a technically heavy zone that produced a prior double-top earlier this year.
🔵🟠 Gamma-Based Support & Resistance Analysis
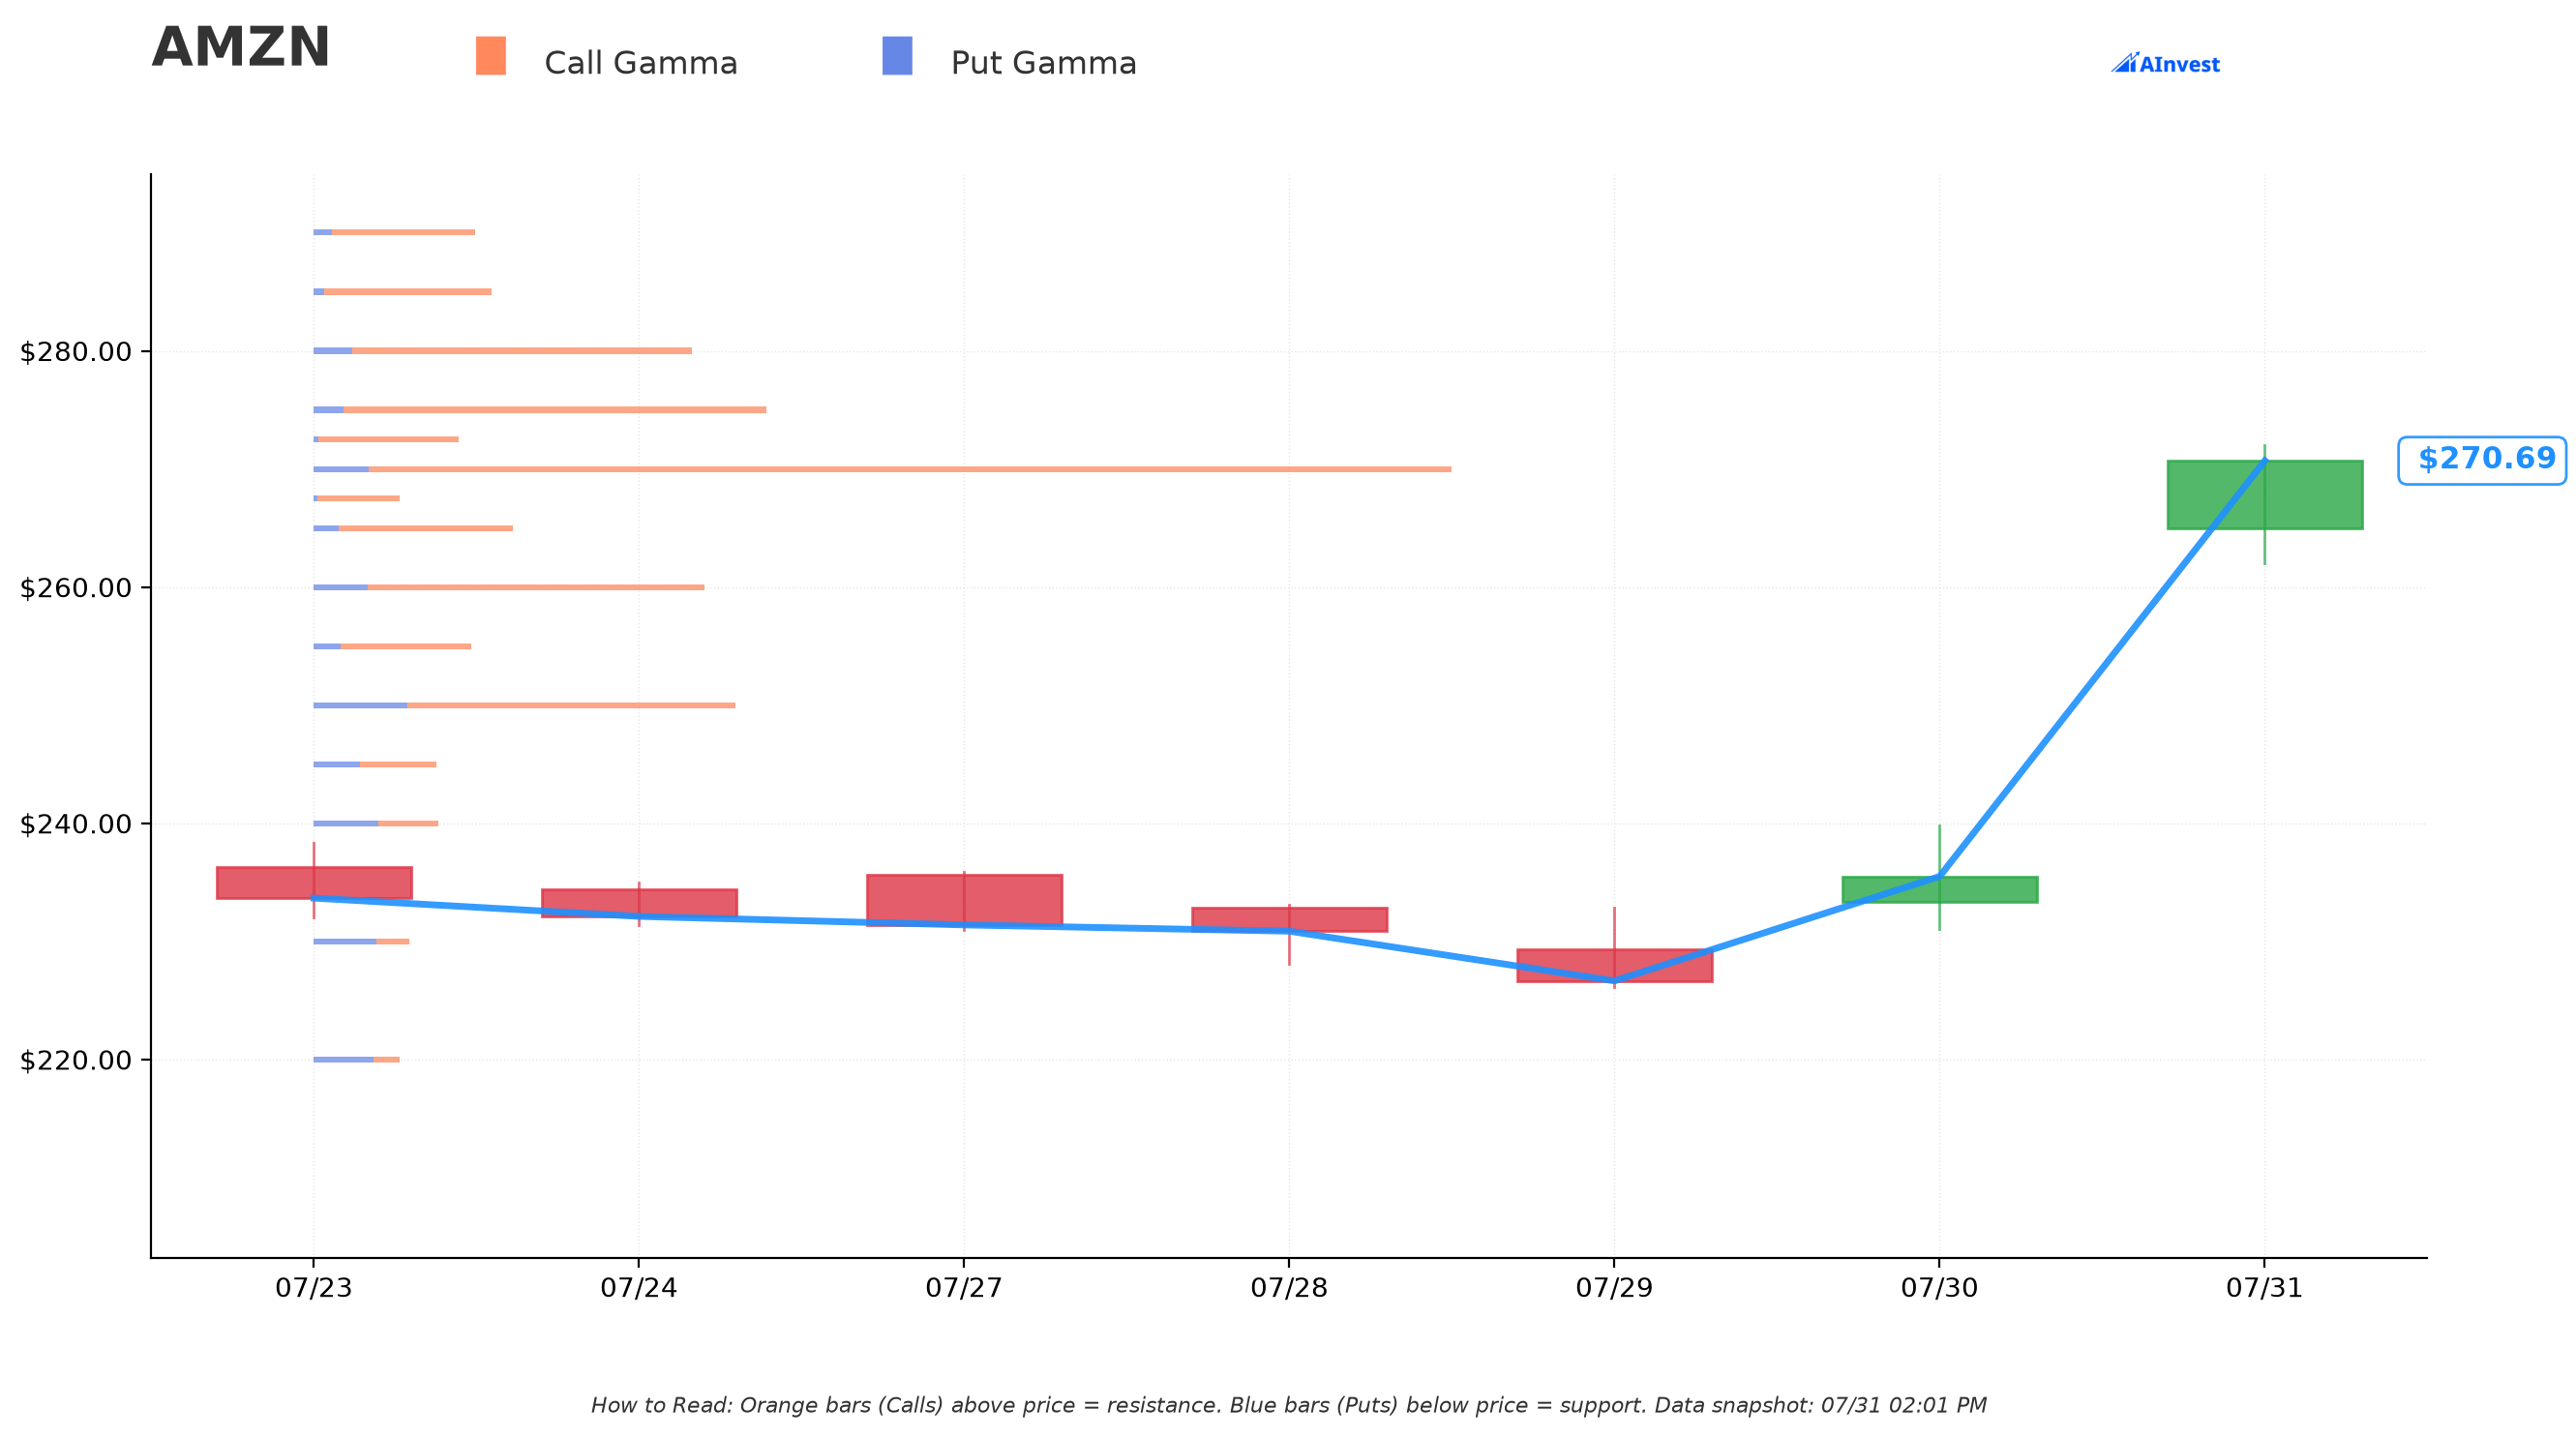
Current price: $270.83. The gamma map shows a wall of dealer positioning clustered tightly around spot:
🟠 Resistance (call gamma above price):
- $275 — Very strong resistance, ≈60.4B total gamma (1.5% above spot)
- $280 — Very strong resistance, ≈50.2B total gamma (3.4% above spot)
- $285 — Very strong resistance, ≈23.3B total gamma (5.2% above spot)
🔵 Support (put/call gamma below price):
- $270 — Very strong support right at spot, a massive ≈148.1B total gamma (mostly call gamma — dealers long gamma here, which tends to pin/dampen moves)
- $260 — Very strong support, ≈51.0B total gamma (4.0% below spot)
- $250 — Very strong support, ≈52.8B total gamma (7.7% below spot)
What this means for traders: AMZN is sitting almost exactly on top of its single biggest gamma level ($270), with a steep resistance wall stacked at $275 and $280 right above it. That's the classic setup for near-term chop — dealers hedging this much gamma tend to buy dips and sell rips, compressing the range just above and below spot. A decisive close above $275–280 on continued strength would be needed to escape this pocket; a slip back below $260 would be the first real crack in support.
Notice anything? The rolled position's new $240 strike sits well below the $250 support wall — that's deep in the money relative to gamma structure, not a bet on a specific technical level. This is a directional call position riding the trend, not a level-targeted trade.
🎯 Implied Move Analysis
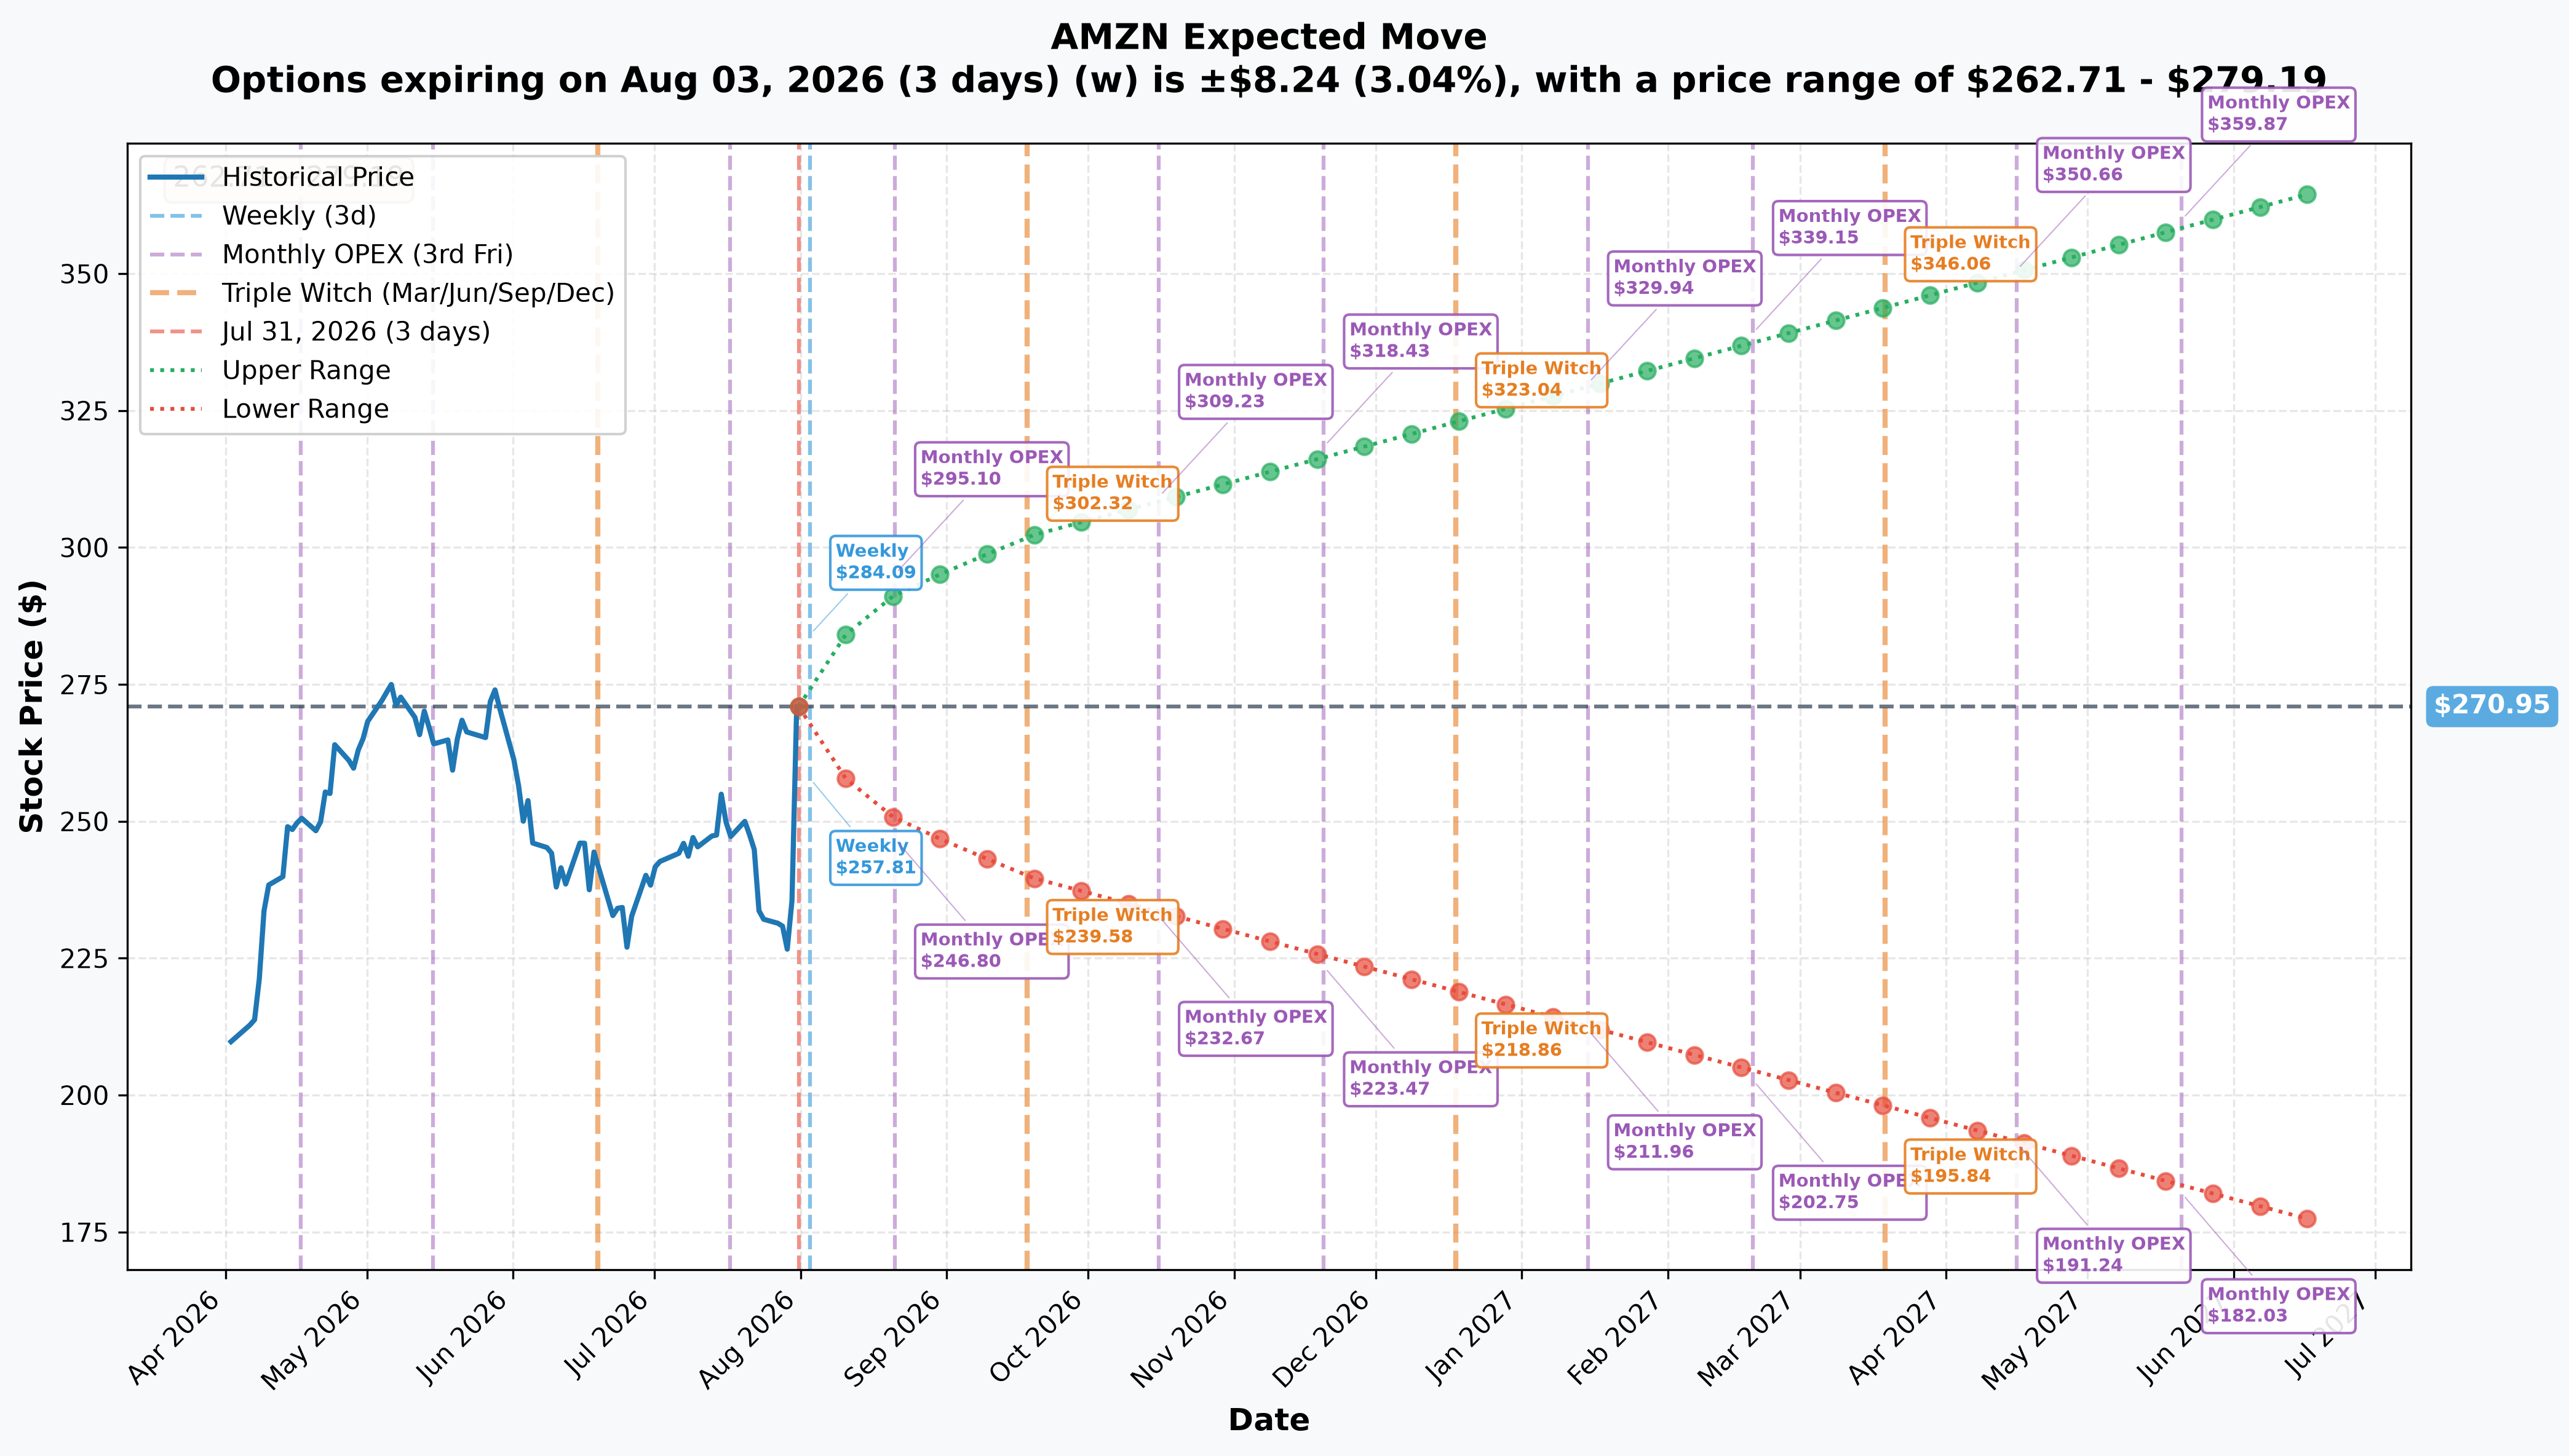
Options are pricing in the following ranges from the current $270.95 spot:
- 📅 Weekly (Aug 3, 3 days): ±3.04% (±$8.24) → Range: $262.71 – $279.19
- 📅 Monthly OPEX (Aug 21, 21 days): ±7.69% (±$20.84) → Range: $250.11 – $291.79
- 📅 Quarterly Triple Witch (Sep 18, 49 days — the SOLD leg's expiry): ±11.49% (±$31.14) → Range: $239.81 – $302.09
- 📅 LEAPS (Jun 17 2027, 321 days): ±34.6% (±$93.75) → Range: $177.20 – $364.70
Translation: the market is pricing a ≈$31 swing by September 18 in either direction — and notice the September implied-move range ($239.81–$302.09) doesn't include a scheduled earnings event inside it, since that expiry ends before the Q3 report. The new November $240 calls now carry both the ordinary trend/macro volatility AND the binary earnings event, which is exactly why implied volatility (and option premium) tends to run richer for November-dated contracts than for September ones at a similar distance from spot.
🎪 Catalysts
✅ Already Happened (last 3 months)
Q2 2026 earnings — July 30, 2026 (after close). Amazon delivered a blowout: revenue of $200.61B (+≈20% YoY, beating consensus by $3.6–4.5B), operating income of $27.5B (+43% YoY), and headline diluted EPS of $5.75 vs consensus of $1.81–1.82. Full detail via CNBC's earnings recap and the primary SEC Ex-99.1 filing.
⚠️ Important nuance the headline hides: of the $62.6B net income, ≈$53.4B was a non-operating, pre-tax mark-to-market gain on Amazon's Anthropic stake, per Variety and TheWrap. The number that actually moved the stock was the $27.5B operating income and the AWS acceleration underneath it — not the EPS headline.
AWS: $42.2B, +36.7% YoY — the fastest growth rate in 18 quarters, and a fifth consecutive quarter of acceleration, per CNBC's AWS-specific coverage and Yahoo Finance. AWS operating margin expanded to ≈39%, up 650 basis points year over year. AWS backlog hit $496B, up from $364B the prior quarter, per DigiTimes — management said on the call that "the lion's share" of 2027 AWS capacity is already reserved by customers.
Amazon also raised FY2026 cash capex guidance to ≈$220B, up from ≈$200B, citing higher memory costs plus continued AI/cloud buildout, per Seeking Alpha and Data Center Knowledge.
⚠️ The other side of the ledger: trailing-twelve-month free cash flow turned negative, ≈−$7.6B, the first negative FCF print in recent history, driven directly by the AI capex ramp, per Investing.com's Q2 recap.
Stock reaction: AMZN rose ≈14.9% on July 31, its best single day in 11 years, per The Motley Fool and StockAnalysis. A wave of price-target hikes followed the same morning — Goldman Sachs to $375, JPMorgan and Barclays to $365, Citi to $350 — summarized in CNBC's July 31 analyst roundup.
🔮 Coming Up (next 6 months)
≈October 22, 2026 — Q3 2026 earnings ⚠️ expected, not yet company-confirmed. Consensus is EPS $1.90–$1.96 on revenue ≈$204B, per Investing.com's AMZN earnings calendar and MarketBeat (which explicitly flags the date as estimated). This is the print the rolled November $240 calls are now positioned for — watch AWS for a sixth straight quarter of acceleration, backlog progression from $496B, the Q4 holiday guide, and the first look at FY2027 capex.
November 30 – December 4, 2026 — AWS re:Invent, Las Vegas ✅ confirmed via AWS's own event page, historically the venue for Trainium/Inferentia announcements — falls just after the November expiry.
≈Late September 2026 — possible fall devices event. Amazon has run a hardware event in late September in recent years (2025's was September 30), but no 2026 date has been announced. If it holds to pattern, this is the only company-controlled event that would land inside the September expiry window — underscoring how comparatively quiet the September cycle is next to November.
Note on the Q3 guide itself: Amazon's own guidance calls for $197.0B–$202.0B in Q3 net sales, below the ≈$204B street consensus, per Seeking Alpha — partly a timing effect since Prime Day moved into June this year, pulling volume forward into Q2.
🎲 Price Targets & What the Levels Say
Using the gamma structure and implied-move data together:
- Base case: AMZN gravitates around the massive $270 gamma wall near-term, with $275–$280 as the immediate ceiling and $260 the first support shelf. The weekly implied range of $262.71–$279.19 captures this chop well.
- Bull case: A clean break above the $275/$280 resistance stack opens room toward $285–$300, where meaningful (though thinner) call gamma sits. The September implied-move upper bound of $302.09 and the average sell-side price target of $319.53 (per StockAnalysis's forecast page) both sit well above current gamma resistance — consistent with the bull thesis that AWS reacceleration plus a de-risked capex backlog justifies a higher multiple.
- Bear case: A slip below $260 gamma support risks accelerating toward $250, which is itself a very strong support wall (≈52.8B gamma). The bear case is grounded in real numbers too: negative FCF (≈−$7.6B TTM), ≈$119B of long-term debt funding the buildout, and a sell-side low target of $207 (StockAnalysis).
The rolled position's $240 strike sits below all of these near-term technical levels — it's already deep in the money and would need a meaningful pullback (below the $250 support wall) before it comes under real pressure.
💡 Trading Ideas
🛡️ Conservative — Watch, Don't Chase
The stock just moved ≈15% in one day and sits near its all-time high. Buying calls here to "catch up" to this flow means paying elevated post-earnings premium at a technically extended level. Better to wait for a pullback toward the $260 or $250 gamma support zones, or simply hold existing shares and let this data point inform your view rather than trigger a new trade.
⚖️ Balanced — Defined-Risk Call Spread Into the September Expiry
If you want cheaper exposure to continued AWS-driven strength without earnings-event risk, a call spread expiring before September 18 (e.g. within the August 21 monthly cycle) avoids the binary Q3 print entirely — you're betting on trend continuation, not a surprise. Size small; the implied move already prices a ≈7.7% swing by August 21 ($250.11–$291.79).
🚀 Aggressive — November Calls, Own the Earnings Print (Mirrors the Institutional Roll, Smaller Size)
Following the same logic as this trade — owning calls that expire after the ≈October 22 Q3 report — is a legitimate way to play continued AWS momentum into the next catalyst. But size this far smaller than the $98M headline suggests: November premium is going to be expensive precisely because it straddles an earnings event, and a disappointing Q3 guide (or a reversal in the Anthropic mark-to-market gain) could hit hard from these elevated levels. Only risk capital you can afford to lose outright.
⚠️ Honest Risk + What the Tape Cannot Prove
- We do not know who placed this trade, their broker, their order ID, or whether they had a pre-existing hedge, dividend/borrow motive, or other book we can't see. OPRA data never reveals identity or intent — only price, size, timing, and mechanism.
- The 1,000,000-share stock block at 11:34:04 is an INFERRED hedge link, not a proven one. It printed 3 minutes 51 seconds after the option cross, at a nearby price ($267.375) and a size close to the package's computed net delta (+983,250 shares). That's a strong circumstantial match, but OPRA cannot prove the same desk executed both, or that the stock trade was even a hedge for this specific options package rather than something else entirely.
- ✅ The September $220 call's open/close status is now RESOLVED — it was a close. Size (10,000) was below prior OI (14,567), so the same-day tape could not prove whether this was purely a close, purely a new short, or some mix. The August 3 next-day OPRA snapshot settled it: OI fell 14,567 → 6,592 (−7,975). Our "primarily closing" read was correct and the roll framing is confirmed. The one residual limit: ≈20% of the sale was contracts changing hands rather than being retired, so a small transfer component exists inside the close.
- This roll reflects one desk's positioning, not a market consensus. It came alongside a wave of bullish analyst price-target hikes, but options flow — even a large, well-structured roll — is one data point, not a signal to blindly copy. Position sizing, your own risk tolerance, and your own view on AWS execution and the Anthropic-gain-adjusted valuation should drive your decision, not this print alone.
- Options trading involves substantial risk of loss and may not be suitable for all investors. This analysis is for educational purposes only and is not financial advice. Always do your own research and consider your own risk tolerance before trading.
About Amazon.com, Inc.: Amazon operates North America and International retail, third-party marketplace and advertising businesses, and Amazon Web Services, the largest public cloud provider, with a market cap of ≈$2.91 trillion in the Consumer Discretionary — Broadline Retail sector.
Last updated: 2026-08-03 — next-day OPRA open interest confirmed the roll: Nov $240 call OPEN (2,429 → 26,796, +24,367), Sep $220 call CLOSE (14,567 → 6,592, −7,975).