🐋 AMZN $52.17M Call Buying Spree — And We Just Watched Our Own OI Prediction Come True
📅 August 3, 2026 | 🔥 Unusual Activity Detected
✅ UPDATE — August 4, 2026 pre-market: both legs confirmed OPEN. The Nov-20 $240 call rose 26,796 → 34,053 (+7,257) against a 7,250-lot print — ≈100% fresh. The Jan-2027 $335 call rose 3,148 → 14,432 (+11,284) against 10,999 traded. Nothing here was a close. See the ✅ RESOLVED box.
🎯 The Quick Take
AMZN wasn't just active today — it was the most bullish single name on the entire board, with two separate call-buying trades totaling $52.17M in premium. First, a lit, at-the-offer buyer paid $13.09M for January 2027 $335 calls, 17.4% out of the money — the cleanest directional signal of the session. Then, at 12:26:42, a $39.08M block cross bought 7,250 deep-in-the-money Nov-20-2026 $240 calls — the exact same strike and expiry a desk rolled into just three trading days earlier. Better yet: we can prove that earlier call was right. We predicted that Friday's roll would push open interest up by at least ≈22,571 contracts — it actually rose by 24,367 (2,429 → 26,796). Today's follow-on buy shows that same position is still being built.
📊 Company Overview
Amazon.com Inc. (AMZN) trades on the Nasdaq (NASDAQ: AMZN) and is the world's largest online retailer and third-party marketplace operator. Retail-related sales make up roughly 74% of total revenue, with Amazon Web Services (AWS) contributing about 17% and advertising services around 9% — but AWS is the segment that moves the stock these days.
- Market Cap: ≈$3.06–3.08 trillion — AMZN's furious two-session repricing (+15.32% July 31, +4.90% August 3) pushed the market cap through $3 trillion for the first time, closing today at $284.88 per MarketBeat and StockAnalysis price data
- Exchange: Nasdaq (primary listing XNAS)
- Sector: Consumer Discretionary — e-commerce, cloud computing (AWS), and digital advertising (SIC classification: Retail-Catalog & Mail-Order Houses)
- Current Price: ≈$284–285 through today's session; day range $278.00–$287.20, essentially at the 52-week high
- YTD Performance: +23.8% (from $230.82 on January 1, 2026, per MarketBeat)
💰 The Option Flow Breakdown
📊 Trade 1 — ⚡ LIT — 10:26:54 · BUY 10,999 × Jan-15-2027 $335 CALL @ $11.90
| Time | Symbol | Buy/Sell | Type | Expiration | Premium | Strike | Day Volume | Prior OI | Size | Spot | Option Price | Option Symbol | Mechanism |
|---|---|---|---|---|---|---|---|---|---|---|---|---|---|
| 10:26:54 | AMZN | BUY | CALL $335 | 2027-01-15 | $7.14M | $335 | 12,136 | 3,148 | 5,999 | $285.30 | $11.90 | AMZN20270115C335 | ⚡ LIT |
| 10:26:54 | AMZN | BUY | CALL $335 | 2027-01-15 | $5.95M | $335 | 12,136 | 3,148 | 5,000 | $285.30 | $11.90 | AMZN20270115C335 | ⚡ LIT |
| Combined | BUY | CALL $335 | 2027-01-15 | $13.09M | $335 | 12,136 | 3,148 | 10,999 | $285.30 | $11.90 | ⚡ LIT |
- 💸 Both clips printed at the ask — this buyer paid up in the open market, no discount.
- 🎯 Strike sits ≈17.4% above spot, ≈5.5 months to expiration. Delta ≈+340,199 shares.
- 📊 Size (10,999) clears prior OI (3,148) — mostly a fresh position. Confidence: HIGH.
📊 Trade 2 — 🤝 BLOCK CROSS — 12:26:42 · BUY 7,250 × Nov-20-2026 $240 CALL @ $53.90
| Time | Symbol | Buy/Sell | Type | Expiration | Premium | Strike | Day Volume | Prior OI | Size | Spot | Option Price | Option Symbol | Mechanism |
|---|---|---|---|---|---|---|---|---|---|---|---|---|---|
| 12:26:42 | AMZN | BUY | CALL $240 | 2026-11-20 | $39.08M | $240 | 7,296 | 26,796 | 7,250 | $284.42 | $53.90 | AMZN20261120C240 | 🤝 BLOCK CROSS |
- 💸 Single-leg negotiated block — a broker matched a known buyer and seller off the lit book. NBBO at the print was $52.25 / $54.15; the trade printed at $53.90, which is ≈87% of the way toward the ask — the print location is consistent with a buyer, but because this is a cross (not a lit trade), there was a known counterparty on the other side, so this is a softer directional signal than Trade 1's lit aggression.
- 🎯 Deep in the money. Spot $284.42, intrinsic value $44.42 — of the $53.90 paid, only ≈$9.48 is time value (≈17.6% of the price). Delta ≈+603,272 shares, or ≈0.83 delta per contract — this behaves much more like owning stock than a typical options bet.
- 📊 Prior OI 26,796; size 7,250 is ≤ prior OI — open vs. close is NOT provable from today's tape alone. Confidence: MEDIUM.
Combined today: $52.17M of call buying ($13.09M + $39.08M), and a combined package delta of ≈943,471 shares — roughly $268M of share-equivalent notional exposure across the two trades, with no offsetting equity hedge found on either leg.
⭐ Follow-Through Confirmed — The OI Prediction That Actually Landed
This is the part of today's flow that's genuinely rare, because we can show our own homework checked out:
- Friday, July 31, 2026: a desk rolled out of September $220 calls and into 25,000 Nov-20-2026 $240 calls. We flagged that as a proven open at the time and predicted open interest would rise by at least ≈22,571 contracts (size 25,000 minus the starting OI base of 2,429).
- The next-day OI snapshot resolved it: open interest went from 2,429 → 26,796 — a build of +24,367, exceeding our predicted floor. The prediction landed.
- Today, that same desk (or at minimum, the same position) added another 7,250 contracts to the identical $240 strike and Nov-20-2026 expiry, via a negotiated block cross.
Read this plainly: this is follow-through, not a fresh idea. Someone has been building a large, deep-in-the-money Nov-20-2026 $240 call position across multiple sessions now — first via a 25,000-contract roll, and now via an additional 7,250-contract block. Combined with the lit $335 January buy, AMZN is showing more organized, sustained bullish positioning today than any other name on the board. This is also a live demonstration of exactly why the next-day OI check matters: it's not a formality, it's the mechanism that turns "probably opened" into "proven opened."
✅ RESOLVED — Next-Day OI Is In (August 4, 2026 pre-market)
The OPRA open-interest snapshot timestamped August 4, 2026 ≈06:30 ET reflects the close of business August 3 — the definitive open-vs-close test we flagged when this published. Here is what it says.
| Leg | Baseline OI (Aug-3 snap) | Resolving OI (Aug-4 snap) | Δ | Print size | Δ as % of print | Verdict |
|---|---|---|---|---|---|---|
| Nov-20-2026 $240 call (bought) | 26,796 | 34,053 | +7,257 | 7,250 | ≈100.1% | ✅ OPEN (BTO) |
| Jan-15-2027 $335 call (bought) | 3,148 | 14,432 | +11,284 | 10,999 | ≈102.6% | ✅ OPEN (BTO) |
Verdict: both legs are genuine new longs. The $240 call was the provisional one — 7,250 traded against 26,796 already open, so today's tape could not prove open vs. close. The OI answer is unambiguous: open interest rose by essentially the full print, so not one contract of that block was an existing holder unwinding. The $335 call added slightly more open interest than our block traded, meaning other buyers opened alongside it. Both legs are BTO. The bullish read published August 3 stands, fully confirmed.
🤓 What This Actually Means — Plain English
Two very different mechanisms, two very different confidence levels — don't merge them:
Trade 1 is genuinely lit. It hit the displayed order book and paid the ask, meaning somebody actively consumed real, public liquidity. When a trade takes liquidity like that, the buy/sell read is reliable — there's a real aggressor. Order type: BTO, HIGH confidence. This reads as a standalone, freshly-initiated directional bet: no hedge, no offsetting leg, a genuine wager that AMZN's post-earnings run continues meaningfully higher over the next ≈5.5 months.
Trade 2 is a negotiated block cross — a broker matched a known buyer and seller ahead of time, off the public book. That means there is a known counterparty on the other side who already agreed to this price; nobody "aggressed" the lit market for it. The 87%-toward-the-ask print location is a soft clue pointing to a buyer, but it's not the same quality of evidence as Trade 1's lit tape. What we can say with more confidence is the structure and continuity: this is the same $240 strike, same Nov-20-2026 expiry, that this desk already proved they opened in size three sessions ago. Order type: BTO, MEDIUM confidence, classified as adding to an existing position, not a new idea.
The motive, read honestly: Trade 1 looks like fresh, high-conviction speculation on continued upside — a real bet with real premium at risk, structured for leverage (17% OTM, ≈0.31 delta). Trade 2 looks like position-building, not lottery-ticket buying — at ≈$53.90 for ≈$9.48 of time value and ≈0.83 delta, this is a capital-intensive, high-delta, almost stock-like way to hold large upside exposure, likely because the buyer wants leveraged-but-not-explosive participation and doesn't want to compete for a strike far out of the money. Together, they paint a picture of a market participant (or participants) who got more bullish on AMZN after Q2 earnings, not less — one adding a moonshot, the other doubling down on an already-proven core position. We cannot know if it's the same desk behind both trades; the tape doesn't tell us that.
📈 Technical Setup / Chart Check-Up
YTD Performance Chart
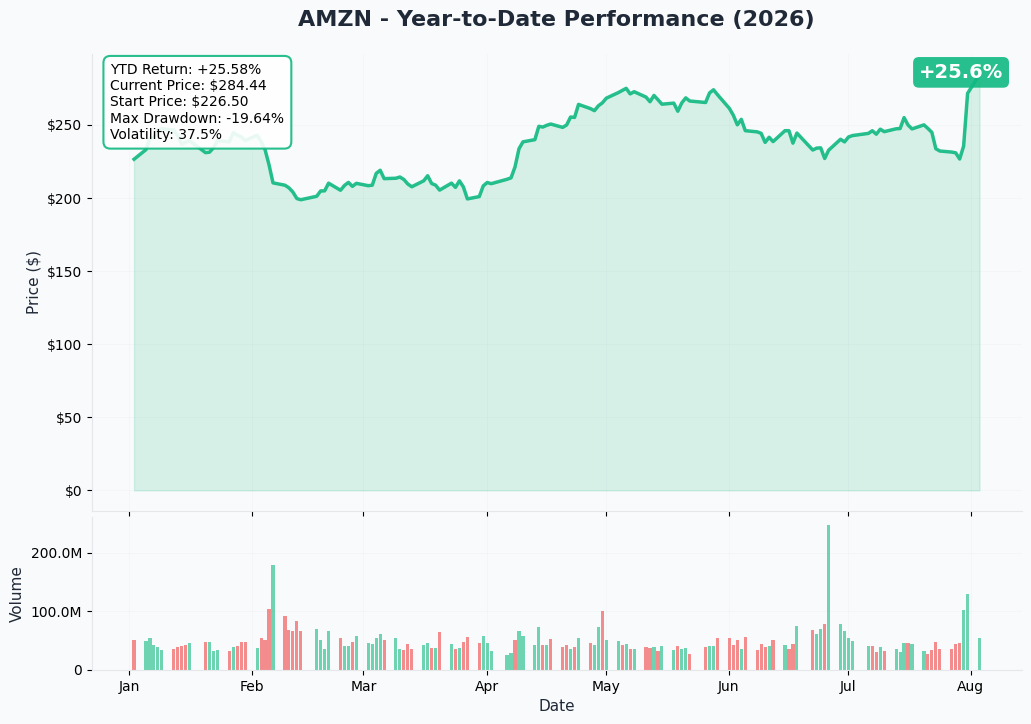
AMZN is +23.8% year-to-date (from $230.82 on January 1, 2026), and nearly all of that gain has compressed into the last several trading days. The stock reported Q2 2026 results after the close on July 30, then logged a confirmed +15.32% single-session gain on July 31 on 128.4M shares — roughly 2.6× average volume — widely described as its best day in about a decade, though the precise "11-year" ranking couldn't be independently verified from the retrieved price history. By today's close (August 3, +4.90% to $284.88), AMZN had pushed through a $3 trillion market cap for the first time. Both of today's call buyers are pressing an already-massive move, not front-running one — the good news is already priced in to a real degree.
Gamma-Based Support & Resistance Analysis
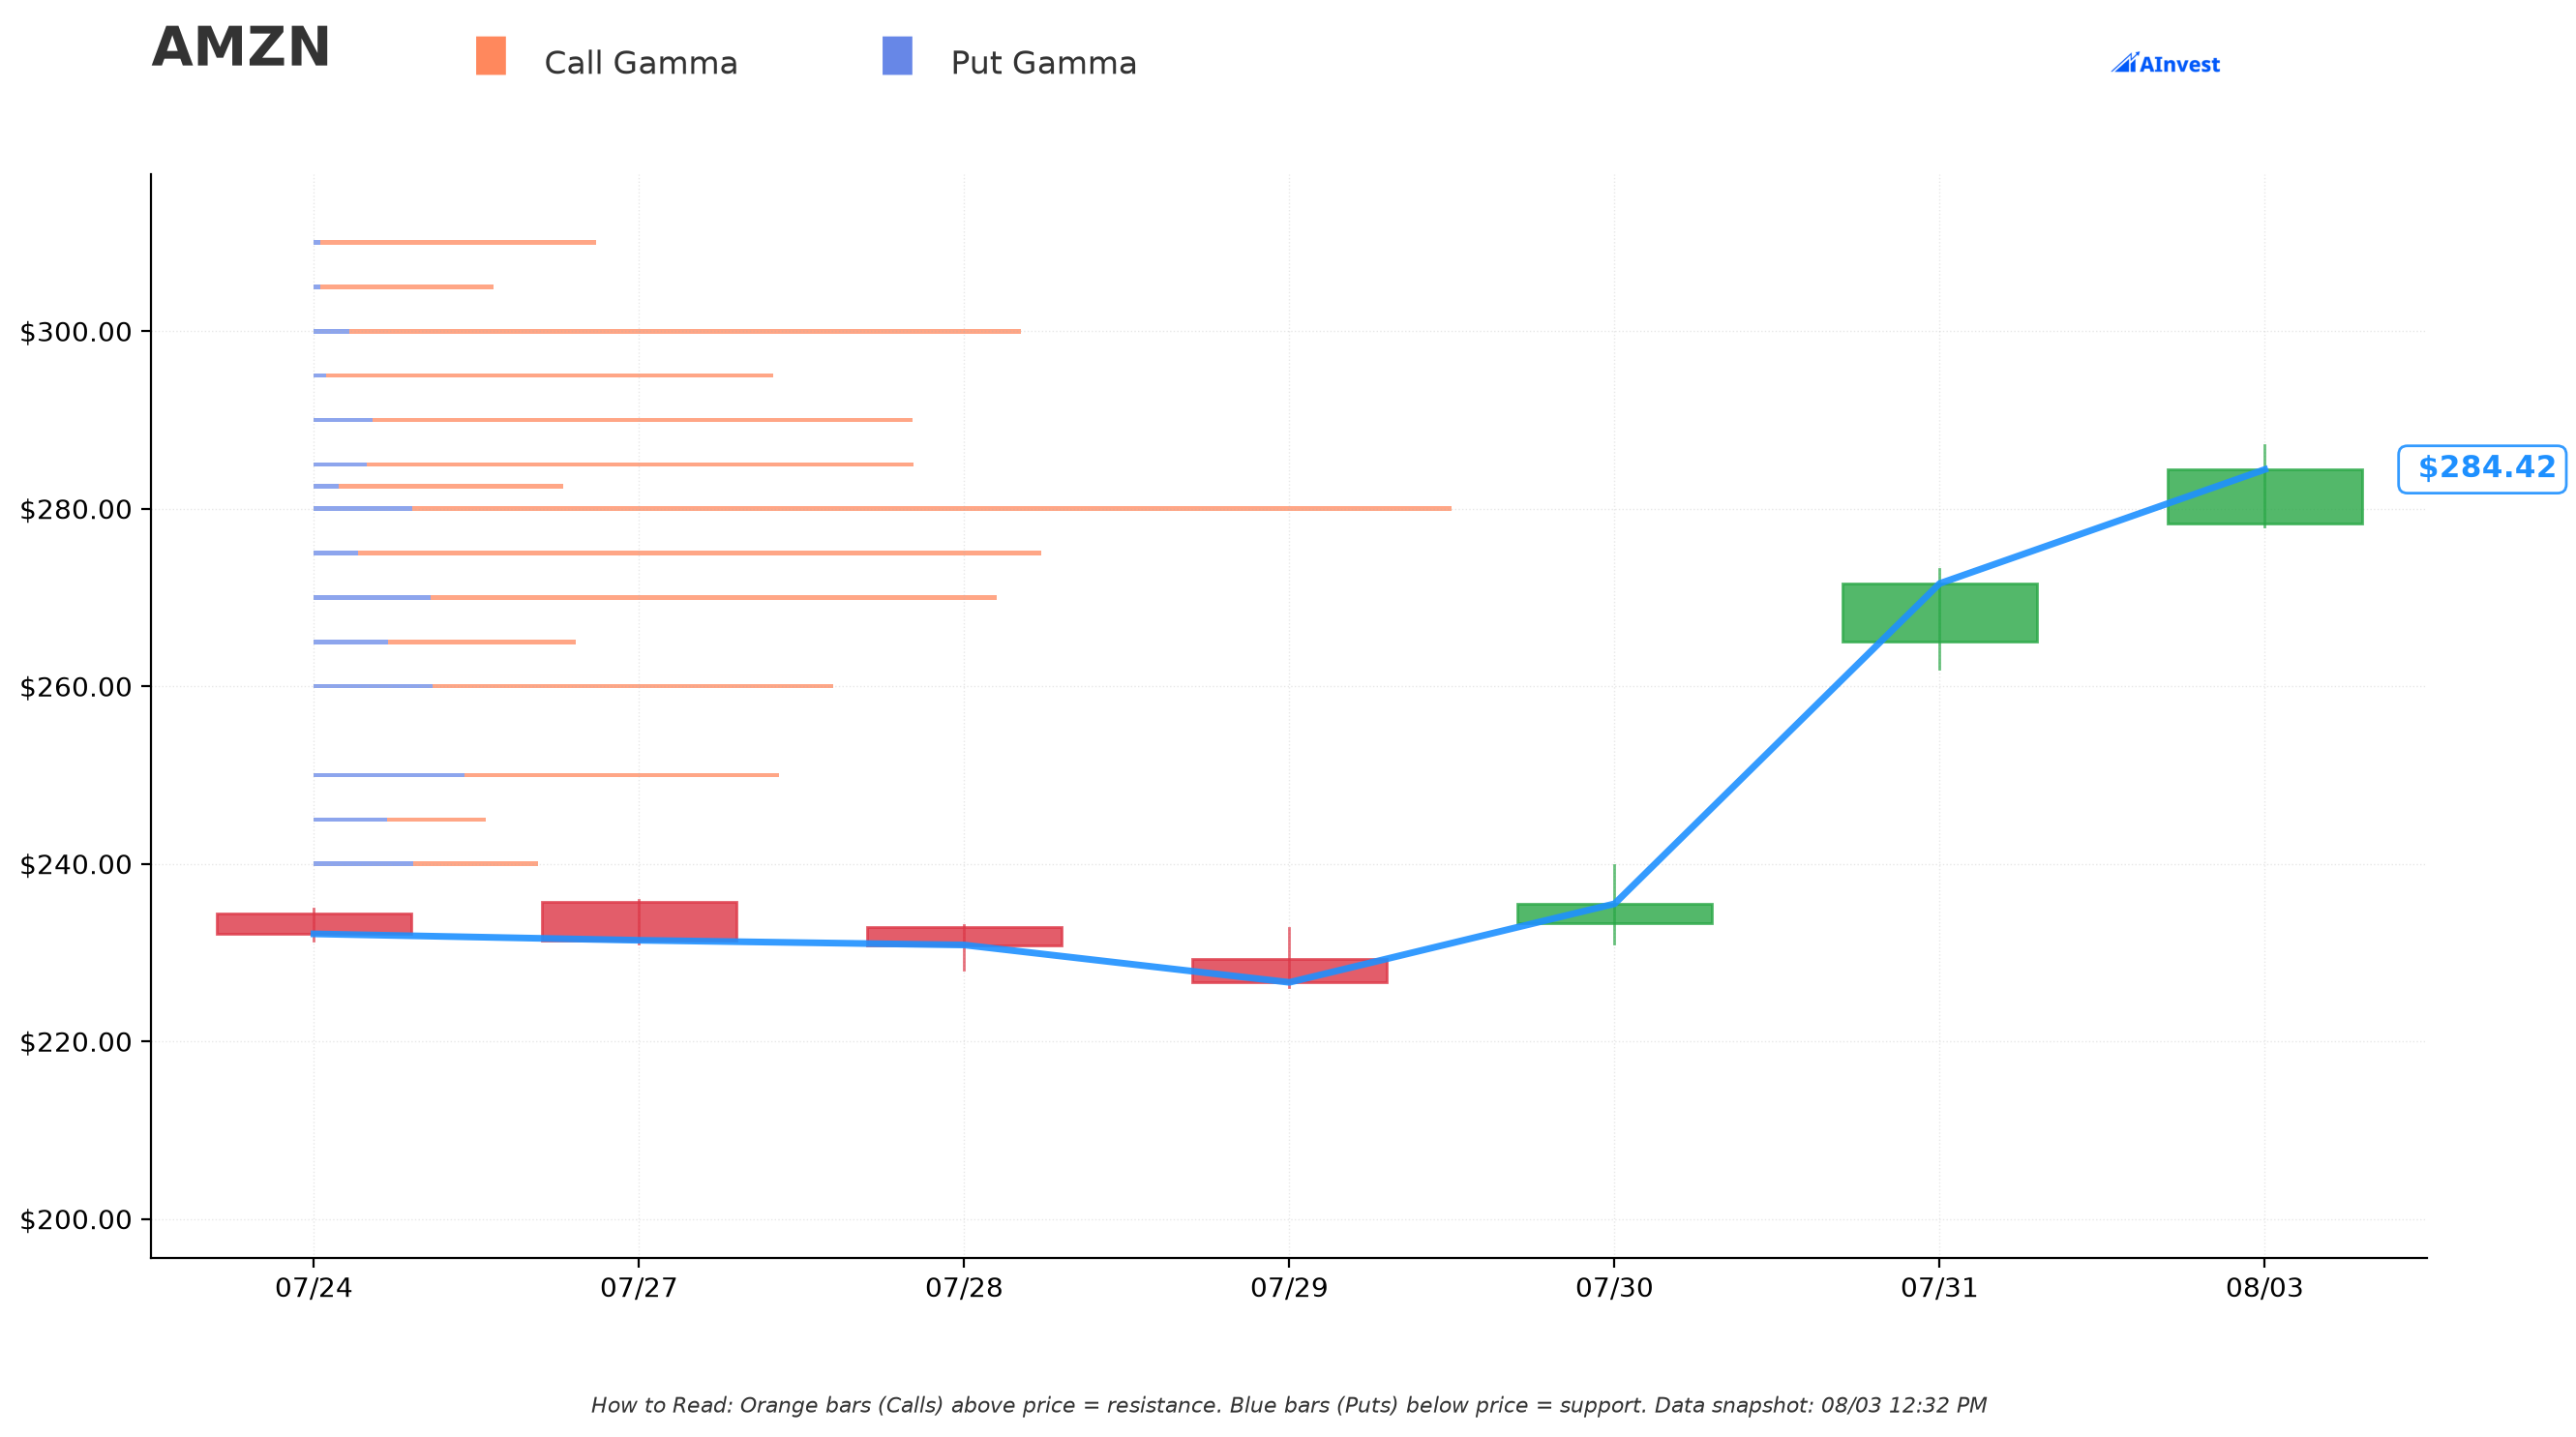
Current Price: ≈$284–285
- 🟠 $285 — 38.5B total gamma, essentially right at spot
- 🟠 $290 — 38.5B gamma, ≈1.9% above spot
- 🟠 $300 — 45.4B gamma, the strongest resistance wall on the board, ≈5.5% above spot
- 🟠 $310 / $320 / $330 — progressively thinner gamma (18.2B / 15.5B / 8.2B)
- 🔵 $280 — 72.8B gamma, the single strongest level in the entire chain, ≈1.6% below spot
- 🔵 $275 / $270 — 44.5B / 42.7B gamma, both "Very Strong" support
- 🔵 $240 — 14.3B gamma, a real (if moderate) support wall — and it's exactly where Trade 2's strike sits, ≈15.6% below spot
What this means for traders: dealers are positioned most heavily around $280–$300 — that's the near-term battleground. Trade 1's $335 strike barely registers on the gamma map at all (≈1.3B total gamma versus 45B+ at $300) — it's beyond where meaningful dealer positioning exists today, so there's no wall to fight but also no dealer flow pulling price there. Trade 2's $240 strike, by contrast, sits at an actual support zone — reinforcing that this is a deep, defensible position rather than a speculative reach. This is our own read of the dealer positioning data, not proof of where price goes next.
Implied Move Analysis
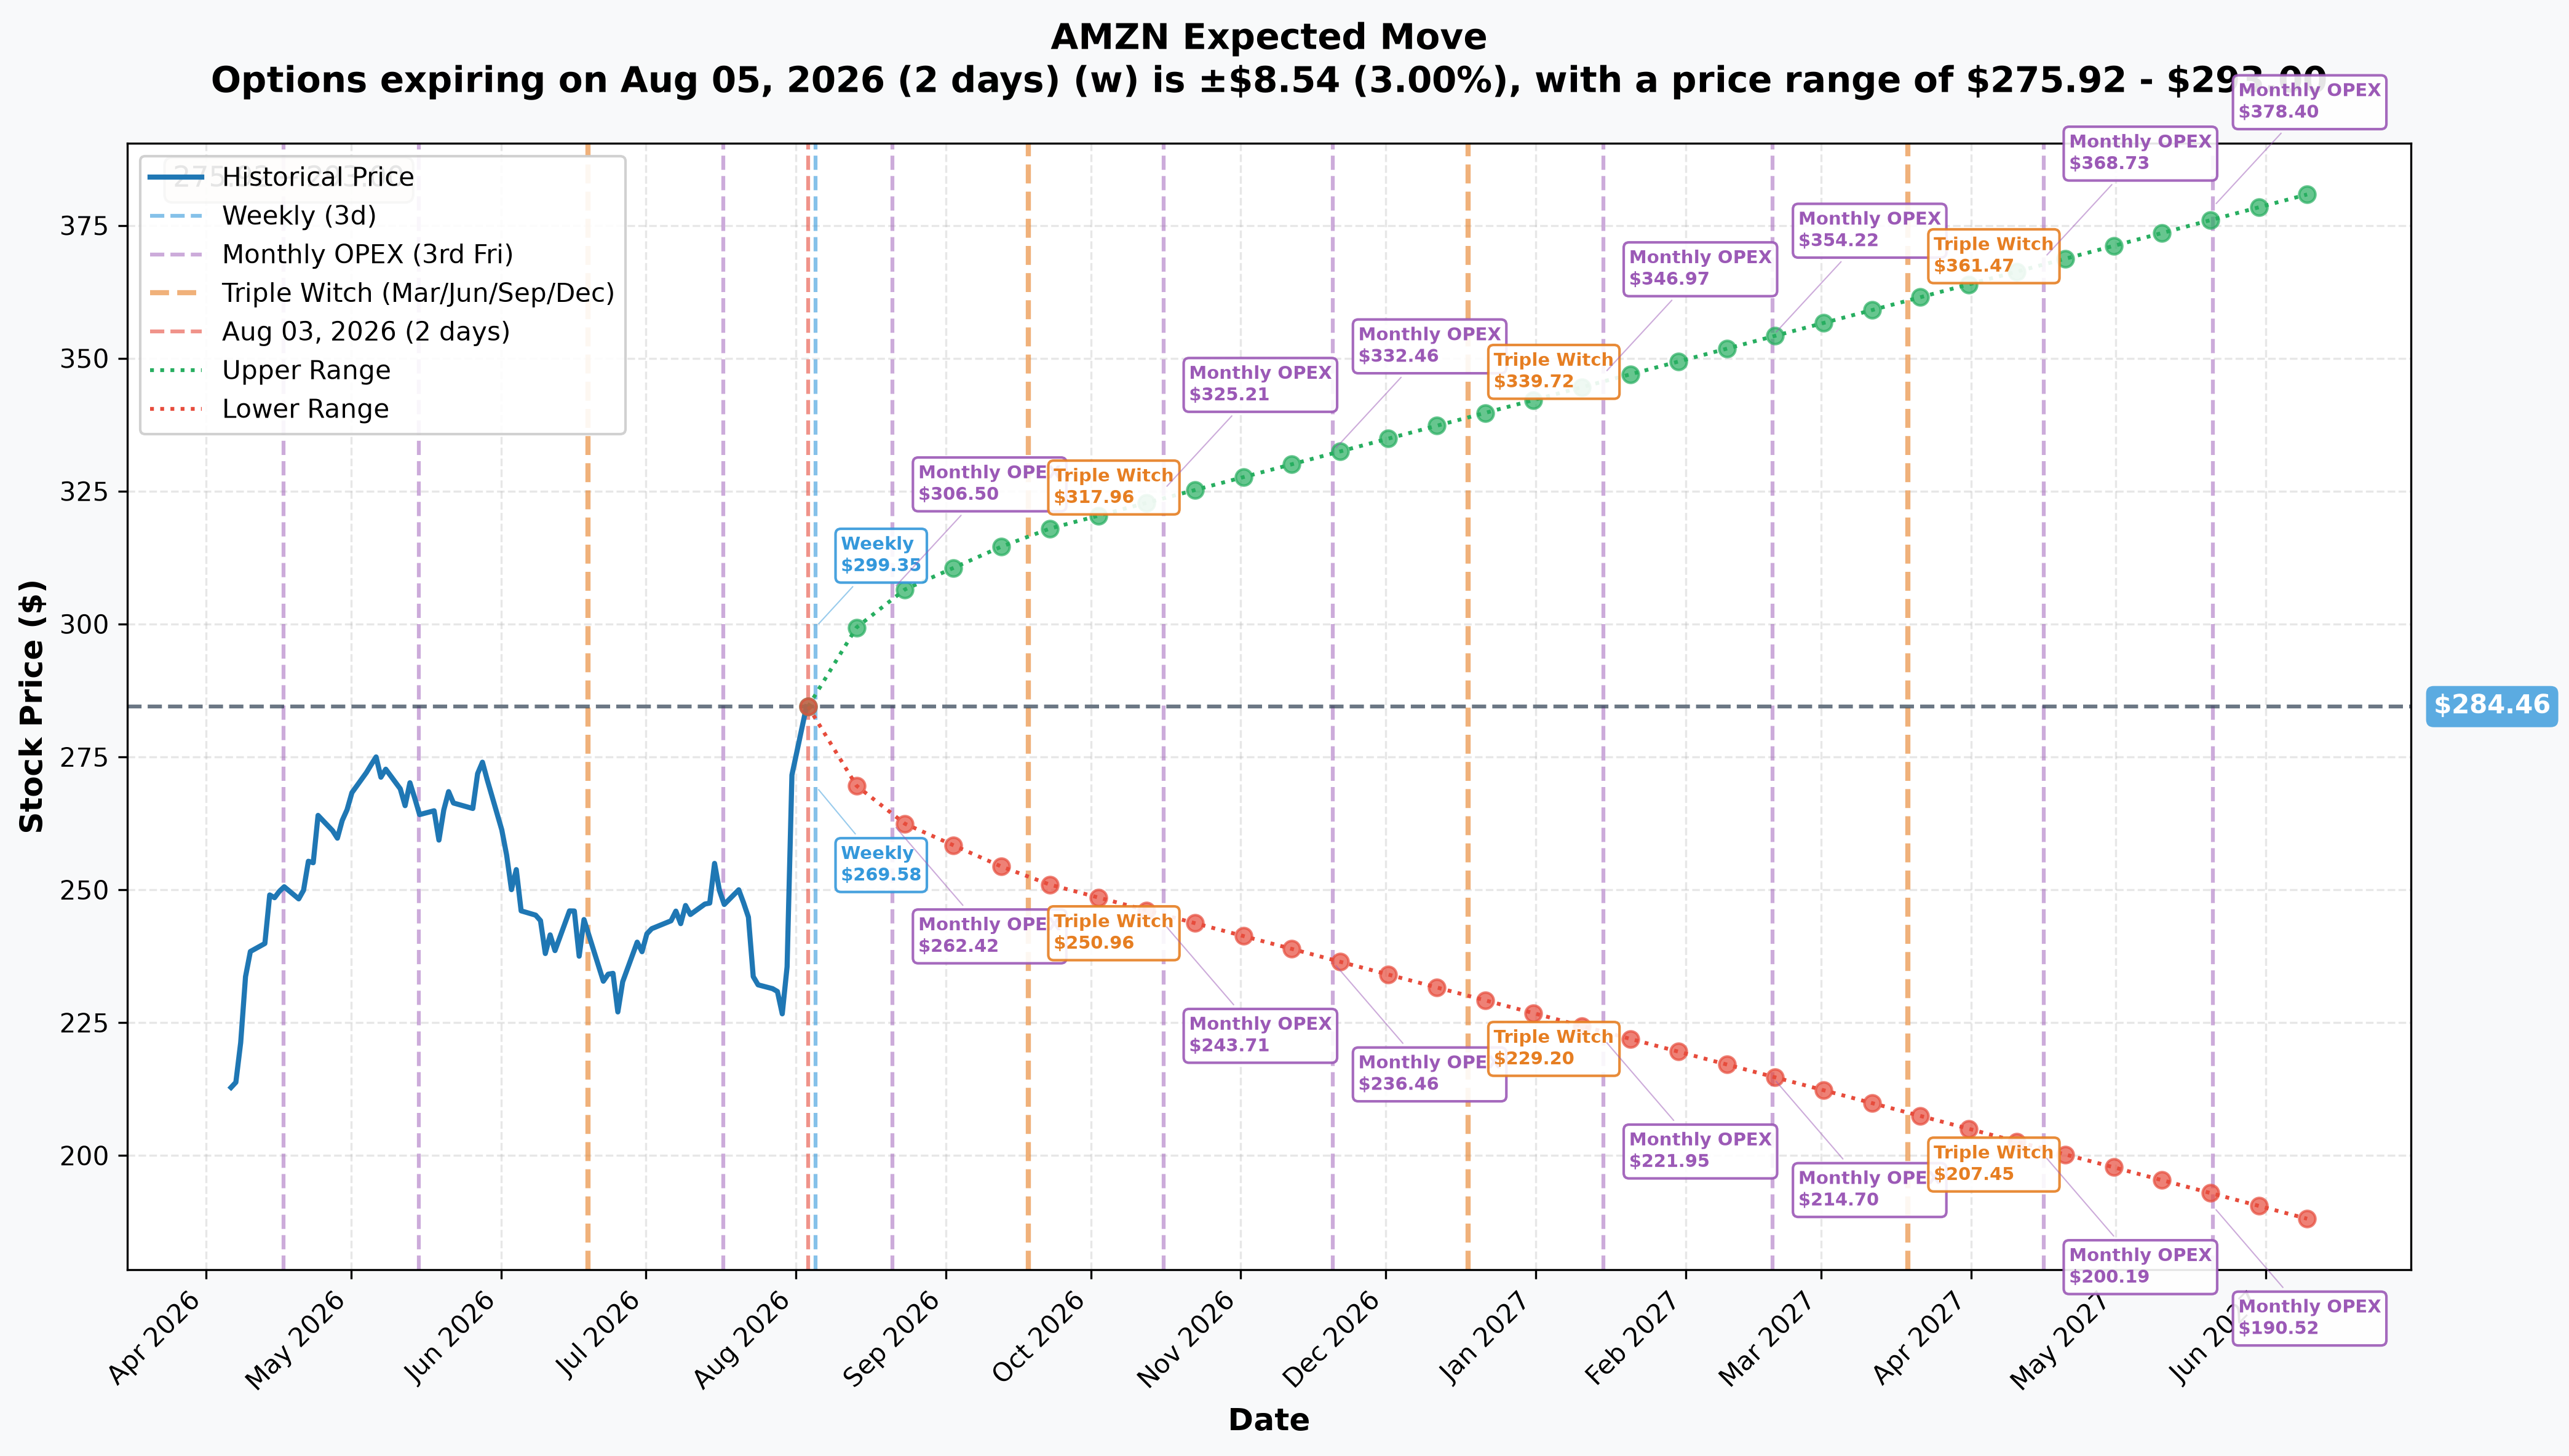
Options market pricing for upcoming expirations (spot ≈$284–285):
- 📅 Weekly (Aug 5 — 2 days): ±3.0% (±$8.54) → Range: $275.92 – $293.00
- 📅 Monthly OPEX (Aug 21 — 18 days): ±7.46% (±$21.23) → Range: $263.23 – $305.69
- 📅 Quarterly Triple Witch (Sep 18 — 46 days): ±11.44% (±$32.53) → Range: $251.93 – $316.99
- 📅 Nov 20, 2026 OPEX (109 days — TRADE 2'S EXPIRATION): Range: $236.46 – $332.46
- 📅 Jan 15, 2027 OPEX (166 days — TRADE 1'S EXPIRATION): Range: $221.95 – $346.97
Trade 1 ($335 strike, Jan 2027): the cone's upper bound ($346.97) sits above the strike — the market prices this move as achievable within a normal one-sigma range, not an extreme tail. Consistent with that, the ≈0.31 delta on this contract implies a rough ≈31% market-implied probability of finishing in the money. Notably, this call's breakeven at expiration is $346.90 — almost exactly the implied-move cone's own upper bound of $346.97. Likely coincidence, but it means the market is pricing the exact move this trade needs as roughly a one-sigma event.
Trade 2 ($240 strike, Nov 2026): already deep in the money, this position only needs the stock to hold above its $293.90 breakeven (strike $240 + premium $53.90) — just ≈3.3% above the $284.42 print spot — to be profitable at expiration. That's a dramatically lower bar than Trade 1's ≈21.6%-to-breakeven math. The cone's lower bound ($236.46) sits just below the $240 strike, meaning there's a real (if modest) probability priced in of the stock dipping below the strike itself by expiration — but even in that scenario, this deep-ITM buyer only loses back time value, not the intrinsic value already baked into the position at entry.
🎪 Catalysts
✅ Already Happened (Past Catalysts)
Q2 2026 Earnings — July 30, 2026, after market close
This is the catalyst that set both of today's trades in motion. According to Amazon's own investor relations release and MarketBeat's earnings coverage:
- 💰 Revenue of $200.6B, up 20% year-over-year, beating the ≈$196.16B consensus by roughly $4.4B (Investing.com)
- ☁️ AWS revenue grew 37% year-over-year to $42.2B (the trade brief's ≈36.7% figure rounds to the same number) — its fastest pace in 18 quarters, on a $496 billion contract backlog and a $169B annualized run rate
- 📈 Operating income jumped 43% to $27.5B; AWS alone delivered $16.6B of that (≈39% AWS operating margin) — ≈60% of total company profit from ≈21% of revenue
- 🏗️ 2026 capex guidance raised to $220B from $200B, almost entirely earmarked for AI infrastructure — management said AI demand should outstrip capacity "well into 2027 and beyond"
- 🚀 The stock logged a confirmed +15.32% single-session gain on July 31 (2.6× average volume), and by today's close (August 3) had pushed through a $3 trillion market cap for the first time
🚨 The fine print that matters for anyone reading this as a clean "blowout": the headline $5.75 GAAP EPS (vs. a $1.82 estimate) is heavily inflated by a $53.4 billion pre-tax, non-operating, non-cash gain — primarily a mark-to-market revaluation of Amazon's stake in AI startup Anthropic. Net income of $62.6B exceeds operating income of $27.5B by ≈$35B, almost entirely this accounting mark, not new cash. A rough back-of-envelope "clean" EPS excluding the gain lands closer to ≈$2.00–$2.10 — still a real beat versus the $1.82 estimate, but nothing like the headline number suggests. This mark can also reverse in a future quarter if Anthropic's valuation falls. (Figures per Amazon's IR release; the "clean EPS" estimate is our own arithmetic, not a reported figure.)
Also worth knowing: sell-side price targets jumped hard the next session (July 31) — Benchmark to $400, Goldman Sachs to $375, JPMorgan to $365, Citigroup to $350 — but the trailing 12-month consensus still sits at $322.56 ("Moderate Buy"/"Strong Buy," 56+ of ≈59–62 analysts rate it Buy), because stale pre-earnings targets haven't rolled off yet. DA Davidson is the lone bear at $250 (implying ≈−7.6% downside from here). Notably, Trade 1's $335 strike sits below every fresh post-earnings target except Roth Capital's $325 and DA Davidson's bearish $250 — meaning several desks already see fundamental room above this strike, even though the lagging consensus average does not yet. (Source: MarketBeat price targets.)
Friday, July 31, 2026 is also its own catalyst of sorts for this flow specifically: that's when the underlying Nov-20-2026 $240 call position was first built via the 25,000-contract roll that today's Trade 2 adds to.
📅 Upcoming — INSIDE BOTH Expiry Windows
Q3 2026 Earnings — expected in the ≈October 27 – November 5, 2026 window (NOT yet officially confirmed)
Amazon has not set an exact date; MarketBeat lists it as "estimated," anchored to Q3 2025's October 30, 2025 report date. This is the only earnings print that falls inside either expiry — ≈late October, well before Trade 2's Nov-20-2026 expiry and Trade 1's Jan-15-2027 expiry.
⚠️ Read Amazon's own Q3 guidance carefully — it points to deceleration, not more acceleration. The company guided Q3 net sales to $197.0–$202.0B (+9% to +12% YoY) — roughly half of Q2's +20% — and operating income to $22.5–$26.5B, a range that sits below Q2's actual $27.5B at both ends. Whether that's Amazon's typical sandbagging or a genuine sequential slowdown is the central question into October, and it's the most important variable for both of today's bullish bets. (Guidance figures per Amazon's IR release.)
📅 Upcoming — OUTSIDE BOTH Expiry Windows
Q4 2026 / Holiday-Quarter Earnings — expected ≈early February 2027
Amazon reported Q4 results on February 5, 2026 (FY2025) and February 6, 2025 (FY2024) — both in early February (MarketBeat earnings history). Following that pattern, Q4 2026 earnings would land roughly three weeks after both of today's options expire — neither trade captures Amazon's biggest seasonal-shopping quarter. Worth noting: Q4 2025 was the one recent quarter Amazon actually missed on EPS ($1.95 vs. $1.97 expected) — so this expiry structure also sidesteps the most recent disappointing print, for whatever that's worth.
🎲 Price Targets & Scenarios
📈 Bull Case — stock keeps climbing past $300+
Q3 earnings (≈late Oct/early Nov) beats the company's own conservative-sounding guidance, AWS growth holds near 37% rather than decelerating toward the guided +9–12%, and momentum clears the thin gamma zone above $300 toward Trade 1's $346.90 breakeven by January. This case gets support from fresh sell-side targets already sitting at $350–$400 (Benchmark, Goldman, JPMorgan, Citigroup) — well above both option strikes. Trade 2 is already comfortably profitable well before that — it only needed $293.90.
🎯 Base Case — consolidation in the $270–$310 range
Q3 comes in roughly in line with the company's own guidance (+9–12% revenue growth, a real deceleration from Q2's +20%), and the heaviest gamma concentration ($280–$300) acts as a magnet/pivot zone while the market digests both the post-earnings move and the guidance reality check. Trade 2 stays solidly in-the-money and profitable through this range; Trade 1 likely loses meaningful time value without a further push higher.
📉 Bear Case — give-back toward $250–$270
A stock up this much, this fast, on a headline EPS beat that was ≈95% a non-cash accounting mark, carries real mean-reversion risk — especially if Q3 confirms the deceleration the company itself guided to, or if the ≈$59B capex funding gap (implied by $220B guided capex against ≈$161B trailing operating cash flow) starts to worry investors about negative free cash flow. DA Davidson's lone $250 target (the sole bearish call among covering analysts) sits in this zone. In this scenario Trade 1's $335 calls expire worthless (full $13.09M lost). Trade 2 would still retain real intrinsic value down to $240, but its remaining $9.48 of time value and any gains above $240 would erode — the built-up profit cushion from the deep-ITM entry would shrink or disappear depending on how far the pullback goes.
💡 Trading Ideas
🛡️ Conservative: Watch, Don't Chase
AMZN just had its best two-day stretch in over a decade and touched a historic $3T market cap the same day as this flow. The conservative play is to let the move breathe and wait for a pullback toward the $280 or $275 gamma support zones before adding any bullish options exposure.
⚖️ Balanced: Mirror the Deep-ITM Approach (Trade 2 Style)
A high-delta, deep-in-the-money call like the Nov-20-2026 $240 call behaves much more like owning shares at a discount to outright stock, with defined downside to the premium paid. It requires far less of a move to profit (≈3.3% here) than an out-of-the-money bet, at the cost of tying up more capital per share of exposure.
🚀 Aggressive: Mirror the Lit Long Call (Trade 1 Style)
Buying the Jan-15-2027 $335 call at far smaller size is the direct way to mirror the higher-conviction, higher-payoff bet. With a ≈31% delta-implied probability of finishing in the money, size this as a small speculative allocation, not a core position.
⚠️ Risk Factors — What These Trades Actually Need, Honestly
- Trade 1 needs a ≈21.6% move to breakeven, not just the 17.4% to reach the strike — AMZN needs to clear $346.90 by January 15, 2027. If it closes at or below $335, the full $13.09M premium is lost.
- Trade 2 needs a much smaller ≈3.3% move to breakeven ($293.90), but $39.08M of capital is committed to get there, and it's still an unhedged, directional position — a sharp pullback below $240 would erase the entire built-up gain.
- Combined, $52.17M is at risk across two structurally different bets with no offsetting hedge found on either leg. This is concentrated, one-directional exposure to a single name that just made a historic move.
- Time decay works against Trade 1 every day it doesn't move, and even Trade 2 carries ≈$9.48 of time value that bleeds away by Nov-20-2026 regardless of direction.
- Both trades are chasing strength, not anticipating it. Buying calls after a confirmed +15.32% single-session gain and a first-ever $3 trillion market cap crossing means mean reversion after moves this large and fast is a real, statistically common outcome — not a fringe scenario.
- The headline earnings beat was distorted, and the company itself guided to deceleration. ≈95% of the Q2 EPS "beat" over $1.82 came from a $53.4B non-cash Anthropic mark-to-market gain, not operating performance — the cleaner beat was closer to $2.00–$2.10. And Amazon's own Q3 guidance ($197.0–$202.0B revenue, +9–12% YoY; $22.5–$26.5B operating income) implies real deceleration from Q2's +20% growth and sits below Q2's actual operating income at both ends. Both of today's bullish bets are, in effect, wagers that this guidance proves conservative.
- Capex is outrunning cash flow. The $220B FY2026 capex guide against ≈$161B trailing operating cash flow implies a funding gap of roughly $59B, and trailing free cash flow is already negative (roughly −$7.6B to −$11.6B depending on definition). If AI infrastructure demand doesn't materialize as assumed, Amazon is exposed to heavy depreciation on underutilized assets.
- There's no short-squeeze fuel here. Short interest is only ≈0.99% of shares outstanding — any further rally has to come from genuine fundamental buying, not short covering, which is a higher bar.
- The stock is already at its 52-week high with limited room below it ($284.88 against a $287.20 high), trading at a forward P/E near 29x. The lagging 12-month analyst price-target consensus of $322.56 implies only ≈13% upside from here — a real but not enormous cushion for two trades this large.
- What the tape cannot prove: we don't know if the same desk placed both trades, why, whether either is part of a larger portfolio strategy we can't see, or whether there's offsetting exposure entirely off the options tape (short stock elsewhere, other hedges). Trade 2's cross mechanism means there's a known counterparty we cannot identify. Trade 1's lit tape tells us this was aggressive buying — it does not tell us the buyer's full picture.
- Open/close is not yet fully resolved on either leg — see the ⏳ callout above. Come back tomorrow morning for the OI confirmation, especially on Trade 2, where today's tape genuinely cannot prove opening vs. a transfer among existing holders.
Disclaimer: Options trading involves substantial risk of loss and is not suitable for all investors. This analysis is for educational purposes only and is not financial advice. A 17.4% out-of-the-money call requiring a ≈21.6% move to breakeven is a low-probability, high-payoff structure; a deep-in-the-money call still carries full premium risk and ties up significant capital. Most retail traders should size any similar position as a small allocation relative to their portfolio. Past performance does not guarantee future results. Always do your own research and consider consulting a licensed financial advisor before trading.
Last updated: August 4, 2026 — next-day OPRA open-interest resolution added (✅ RESOLVED box above). Original analysis published August 3, 2026.