🛰️ ASTS $1.68M Far-OTM Call Cross — But Shares Traded Alongside It, So Don't Call This a Bullish Bet Yet
📅 2026-08-12 | 🤝 Stock-and-Options Cross Detected
✅ Updated 2026-08-13 pre-market — the next-day OPRA open interest confirmed the open, almost exactly on the published number. Open interest on the February-2027 $125 call rose 42 → 1,986 (+1,944) against a 1,950-lot print — we predicted ≈1,992. That is 99.7% of the size landing as genuinely new contracts, with only ≈6 lots of transfer. The BTO label stands. See the ✅ RESOLVED box.
🎯 The Quick Take
At 13:15:34 ET, a desk opened 1,950 February 19, 2027 $125 calls at $8.60 (≈$1.68M) against a spot of $74.10 — a strike sitting ≈69% out of the money, priced at 100% time value. Prior open interest was just 42 contracts, so this is a genuine new position, not a close.
But here's the catch: the print carries a "stock+options cross" tag, meaning shares traded alongside the calls as one package. That paired equity leg means we cannot tell you this is a bullish bet — it could just as easily be a hedged volatility trade tied to AST SpaceMobile's outstanding convertible bonds. Read the whole breakdown below before you draw a conclusion the tape itself can't support.
🏢 Company Overview — What You'd Actually Be Buying
AST SpaceMobile (NASDAQ: ASTS) builds a direct-to-device (D2D) satellite broadband network — large phased-array satellites in low-Earth orbit (the "BlueBird" constellation) that connect straight to ordinary, unmodified smartphones by re-using carriers' own spectrum from space. It sits in the Technology sector, Communication Equipment industry.
- Market cap: ≈$29.0B on 389.17M shares outstanding
- Cash: $2.3B at 2026-06-30, ≈$3.7B pro forma after the July convertible raise
- Burn: trailing free cash flow −$1,638M — against that liquidity, roughly two years of runway at the current pace
🚨 Correcting a common misconception: this is NOT pre-revenue
ASTS already books real revenue — $115.3M trailing twelve months, $31.5M in Q2 2026 alone, more than double Q1's $14.7M. What it does not have yet is commercial subscriber service. The company itself describes 2026 as building toward "scaled non-commercial usage" with strategic carrier partners. That $29.0B market cap against $115.3M of trailing sales works out to ≈241.77x sales — you're paying up almost entirely for a story that hasn't converted to a subscription business yet, not for a company doing nothing at all.
💰 The Trade, Plain English
A single block printed as a stock-and-options cross — shares traded alongside the calls in the same negotiated print, with a known counterparty on the other side. This is not an aggressive sweep lifting offers in the open market; it's a pre-arranged package.
| Field | Detail |
|---|---|
| Time | 13:15:34 ET |
| Buy/Sell | BUY (reported by the print, not independently proven — see below) |
| Call/Put | CALL |
| Expiration | 2027-02-19 |
| Premium | ≈$1,677,000 (1,950 × 100 × $8.60) |
| Strike | $125.00 |
| Volume | 2,000 |
| Prior Open Interest | 42 |
| Size | 1,950 |
| Spot | $74.10 |
| Option Price | $8.60 |
| Option Symbol | ASTS20270219C125 |
Tag: 🤝 BLOCK CROSS (stock+options cross)
Distance out of the money: ≈69%. Value composition: 100% time value — there's zero intrinsic value in this option today. Breakeven at expiry: $133.60, ≈+80% above spot.
✅ RESOLVED — A Clean Open, 99.7% of the Print Became New Contracts
Updated 2026-08-13 pre-market. Resolving OPRA snapshot timestamped August 13 (reflects the August 12 close, after this print); baseline is the August 12 snapshot (reflects the August 11 close, before this print).
| Leg | Baseline (Aug-12) | Resolving (Aug-13) | Δ | Print size | What we published | Verdict |
|---|---|---|---|---|---|---|
| Feb-19-2027 $125 call (bought) | 42 | 1,986 | +1,944 | 1,950 | "OI rising to roughly 42 + 1,950 ≈ 1,992" | ✅ OPEN (BTO) — 99.7% of size |
Confirmed as clean as this gets. Only ≈6 contracts of the 1,950 print matched against existing holders; the rest created brand-new open interest. The new position is real and it is the size the tape showed.
What this does not resolve: the paired stock leg. Open interest confirms the option side opened, but it says nothing about whether the accompanying share trade left the package delta-neutral. The article's caution against reading this as a directional call is unchanged.
🤓 What This Actually Means — Plain English
Let's decode three separate things, because they're easy to blur together.
1. What "69% out of the money, 100% time value" means. The $125 strike is nowhere near today's $74.10 stock price — the option has zero intrinsic value, so every dollar of the $8.60 paid is pure time value, a bet on movement and time, not on where the stock is right now. For the buyer to make a dime by expiry, ASTS has to close above $133.60 — that's not "up a little," that's up ≈80% in about six months.
2. What the paired equity leg does to the directional signal. This is the part that changes everything. Because shares traded alongside the calls in the same cross, this was not a clean, naked call purchase. It was a package. If the equity side was short stock, the combination is a delta-hedged position — the desk is betting on volatility and on the far tail of outcomes, not on the stock reaching $133.60 outright, because the short shares offset the option's upside delta. If the equity side was long stock, the package looks more like financing or a facilitation trade than a directional call purchase. We don't have the equity tape in front of us, so we genuinely don't know which it is — and that's exactly why no bullish headline belongs on this trade.
3. What the convertible-arbitrage alternative would mean. Here's the detail that makes the hedged reading credible rather than speculative: AST SpaceMobile has two convertible bond issues outstanding — the July 2026 notes convert into stock at $79.57, and their capped call caps out at $149.20. The $125 strike on today's trade sits right in the corridor between those two numbers. That's exactly the zone where a desk managing convertible-bond exposure would naturally be positioned — hedging or re-striking a book, not placing a directional wager. This is at least as plausible an explanation as a bullish bet, and it's the same shape of trade the desk put on in NET today. Treat it as a strong hypothesis, not a proven fact — only the equity tape can settle it definitively, and that data wasn't available for this analysis.
Bottom line: the headline number is $1.68M. The honest read is "a desk opened a new far-out call position as part of a stock-plus-options package; direction is unproven." Don't let the dollar figure do the talking for a structure that explicitly withholds directional proof.
📈 Technical Setup
📊 One-Year Chart
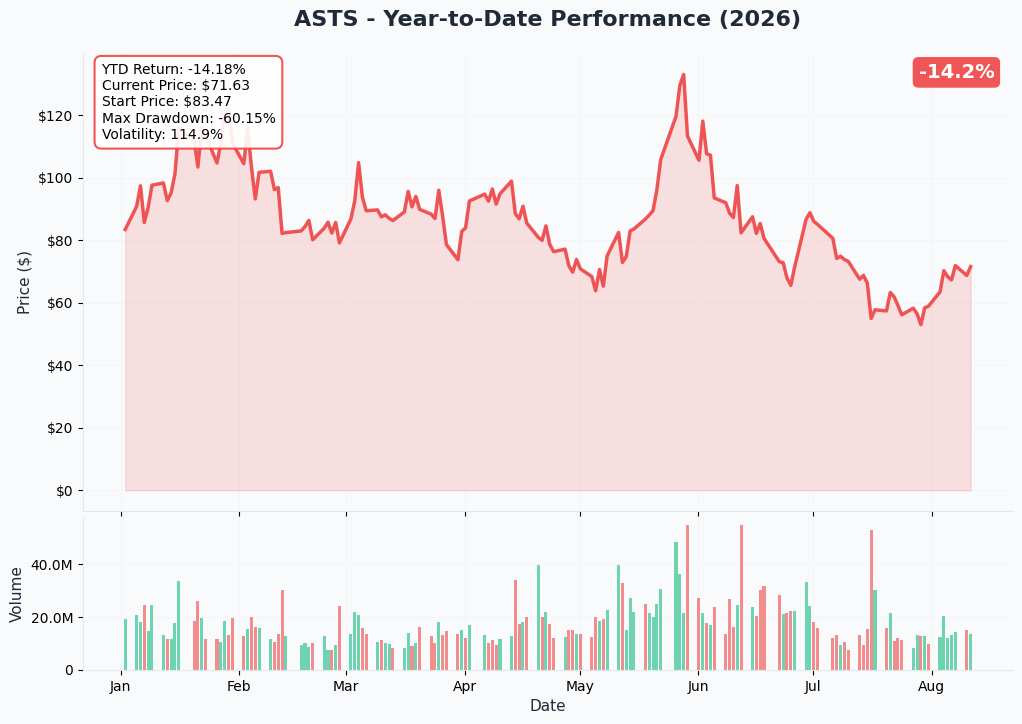
⚠️ A data conflict worth flagging plainly, not papering over: our own one-year chart, built from daily bars from August 2025 through August 2026, shows ASTS down ≈14% over that window. The only other source available for this analysis reports a 52-week change of +62.02%. Both numbers cannot describe the same twelve months. Our chart's window most likely captures a stretch anchored closer to late 2025/early 2026 pricing, while the +62.02% figure appears to reflect a true trailing 52 weeks starting near the 52-week low of $36.08. We could not obtain reliable daily prices before June 2026 to resolve this definitively, so we are not asserting a single settled one-year return number here — what both sources agree on is that ASTS is trading far below its highs after round-tripping an enormous move in 2026.
🎯 Gamma Support & Resistance
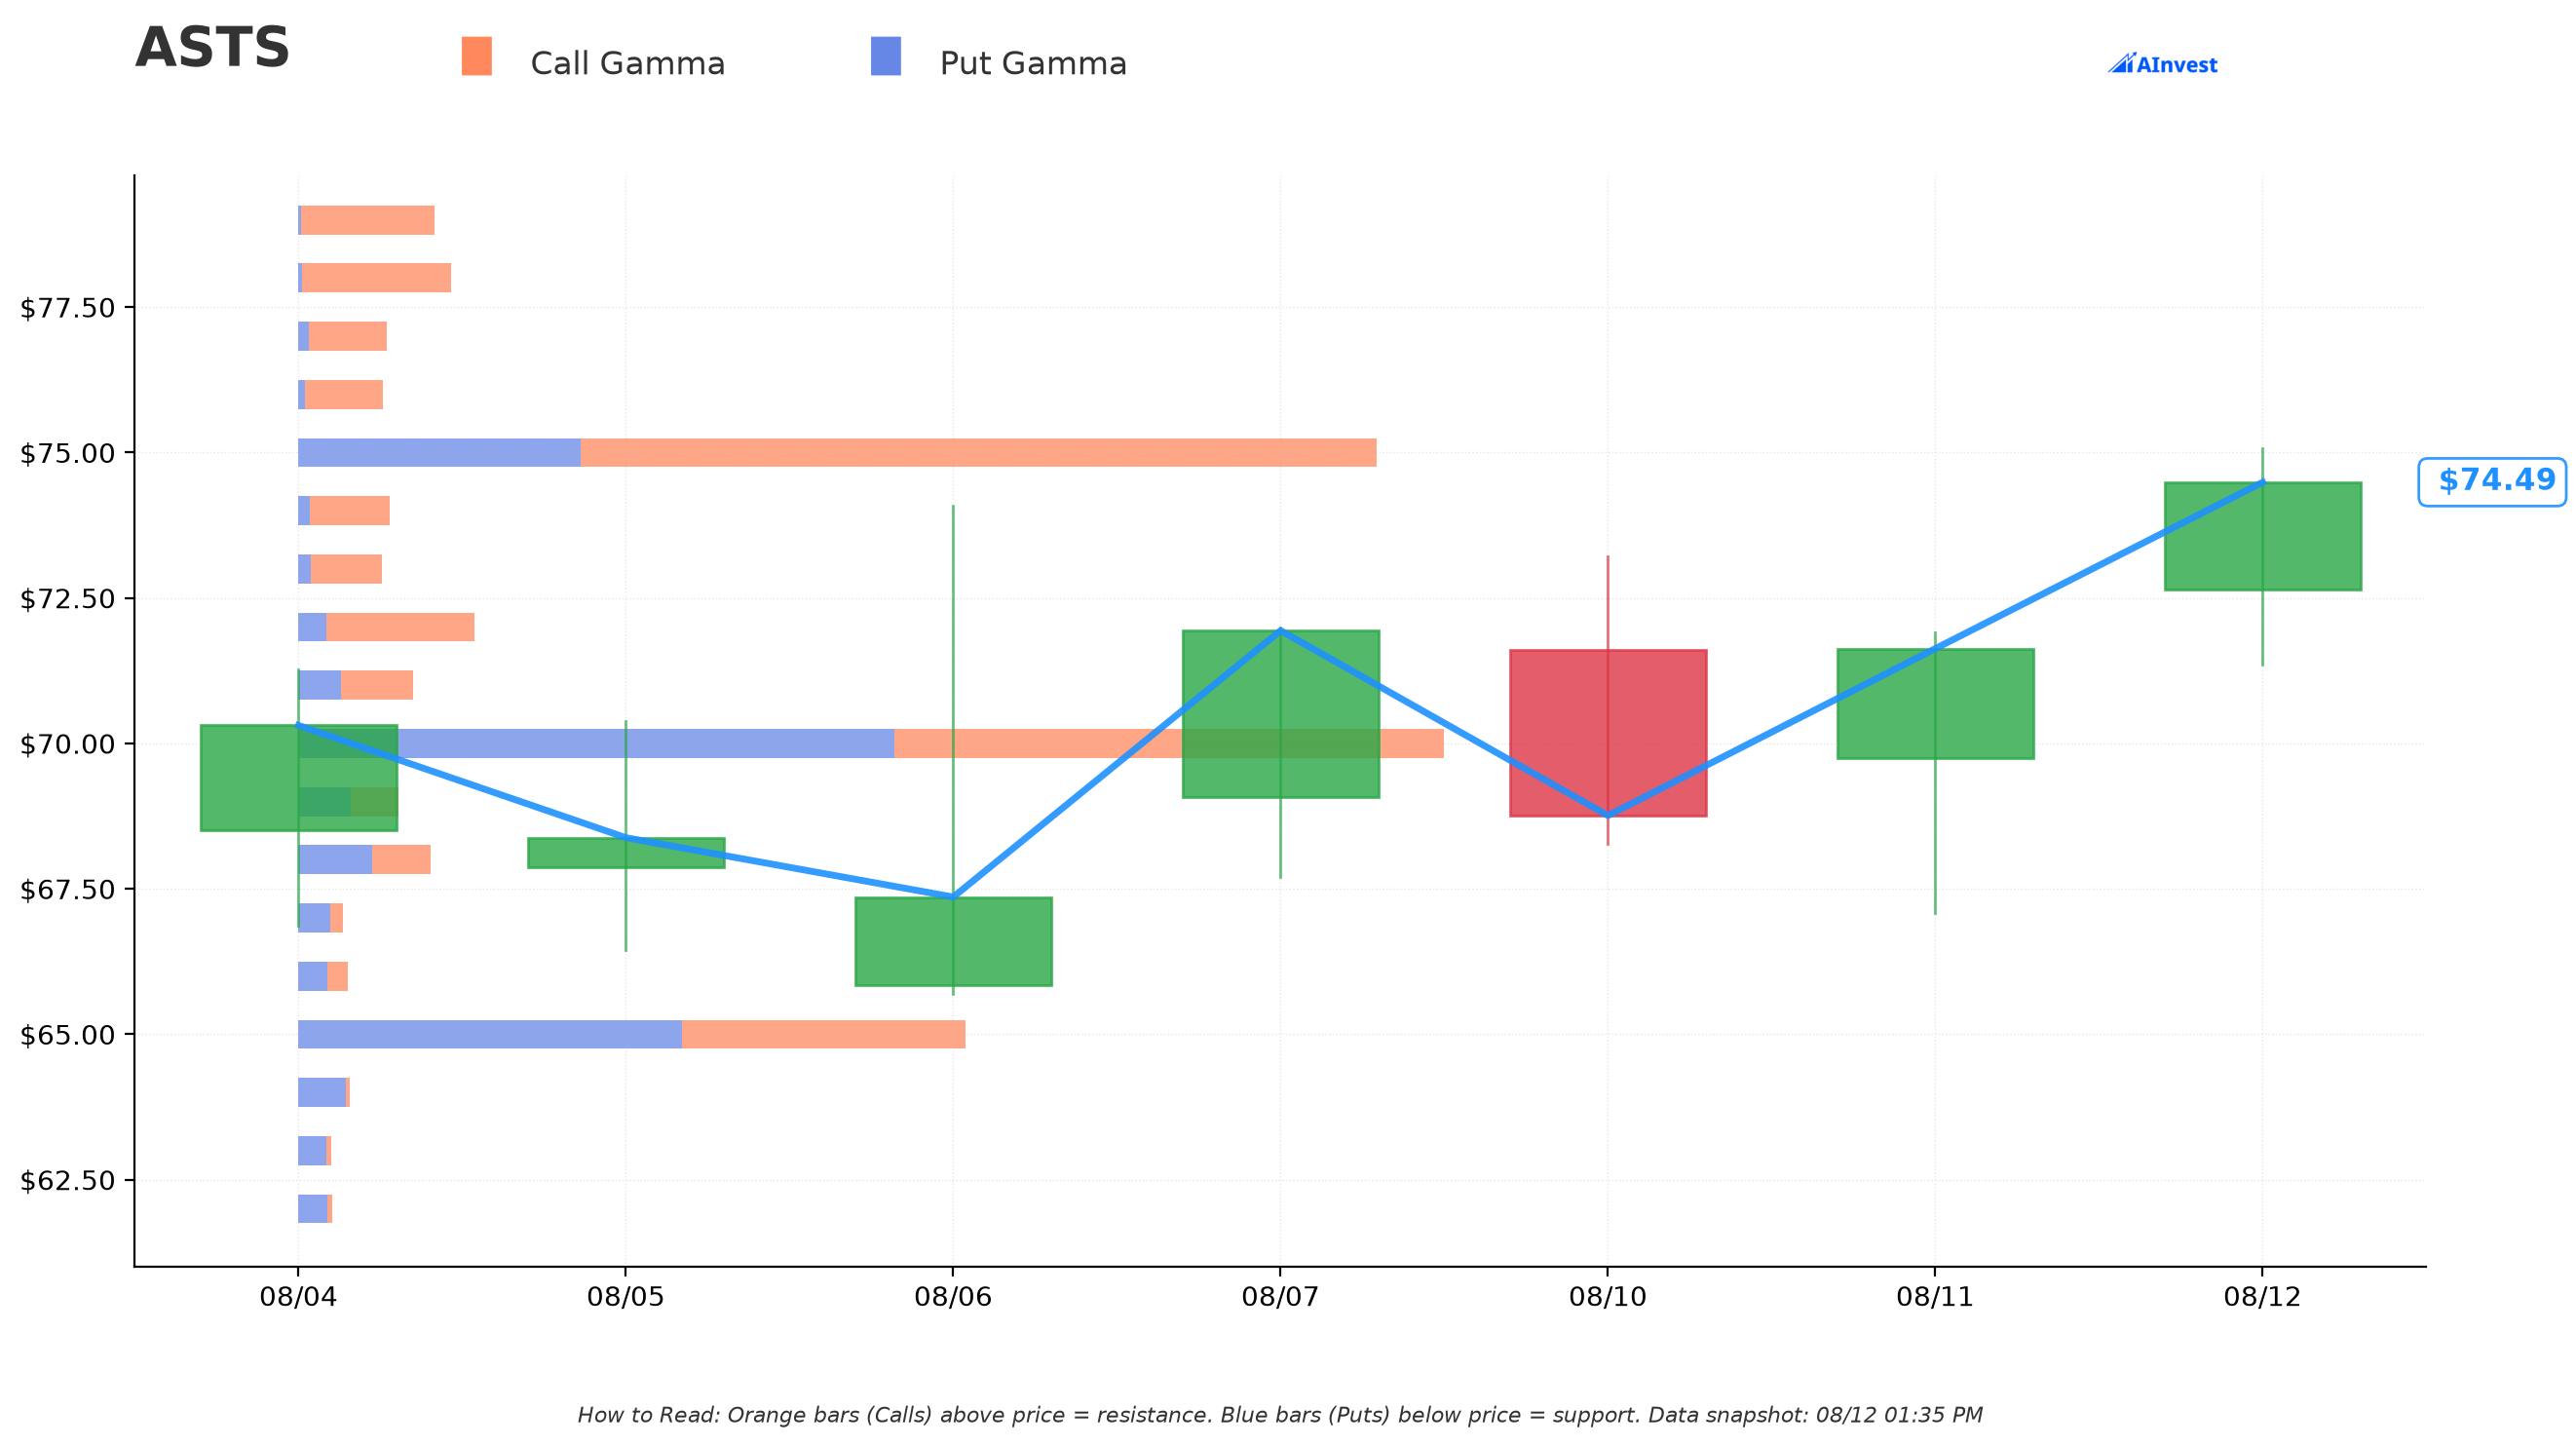
Spot for this read: $74.47.
- 🟠 Resistance: $75 (Strong) — sitting basically on top of spot, the nearest wall in the chain
- 🟠 Secondary resistance: $80 (Strong)
- 🔵 Support: $70 (Strong) — the nearest floor below spot
Translation: dealer hedging flows currently box the stock into a tight $70–$75 band day to day. That's a world away from the $125 strike this trade targets — this is a longer-horizon bet, not something the gamma structure is going to walk toward on its own.
📏 Implied Move
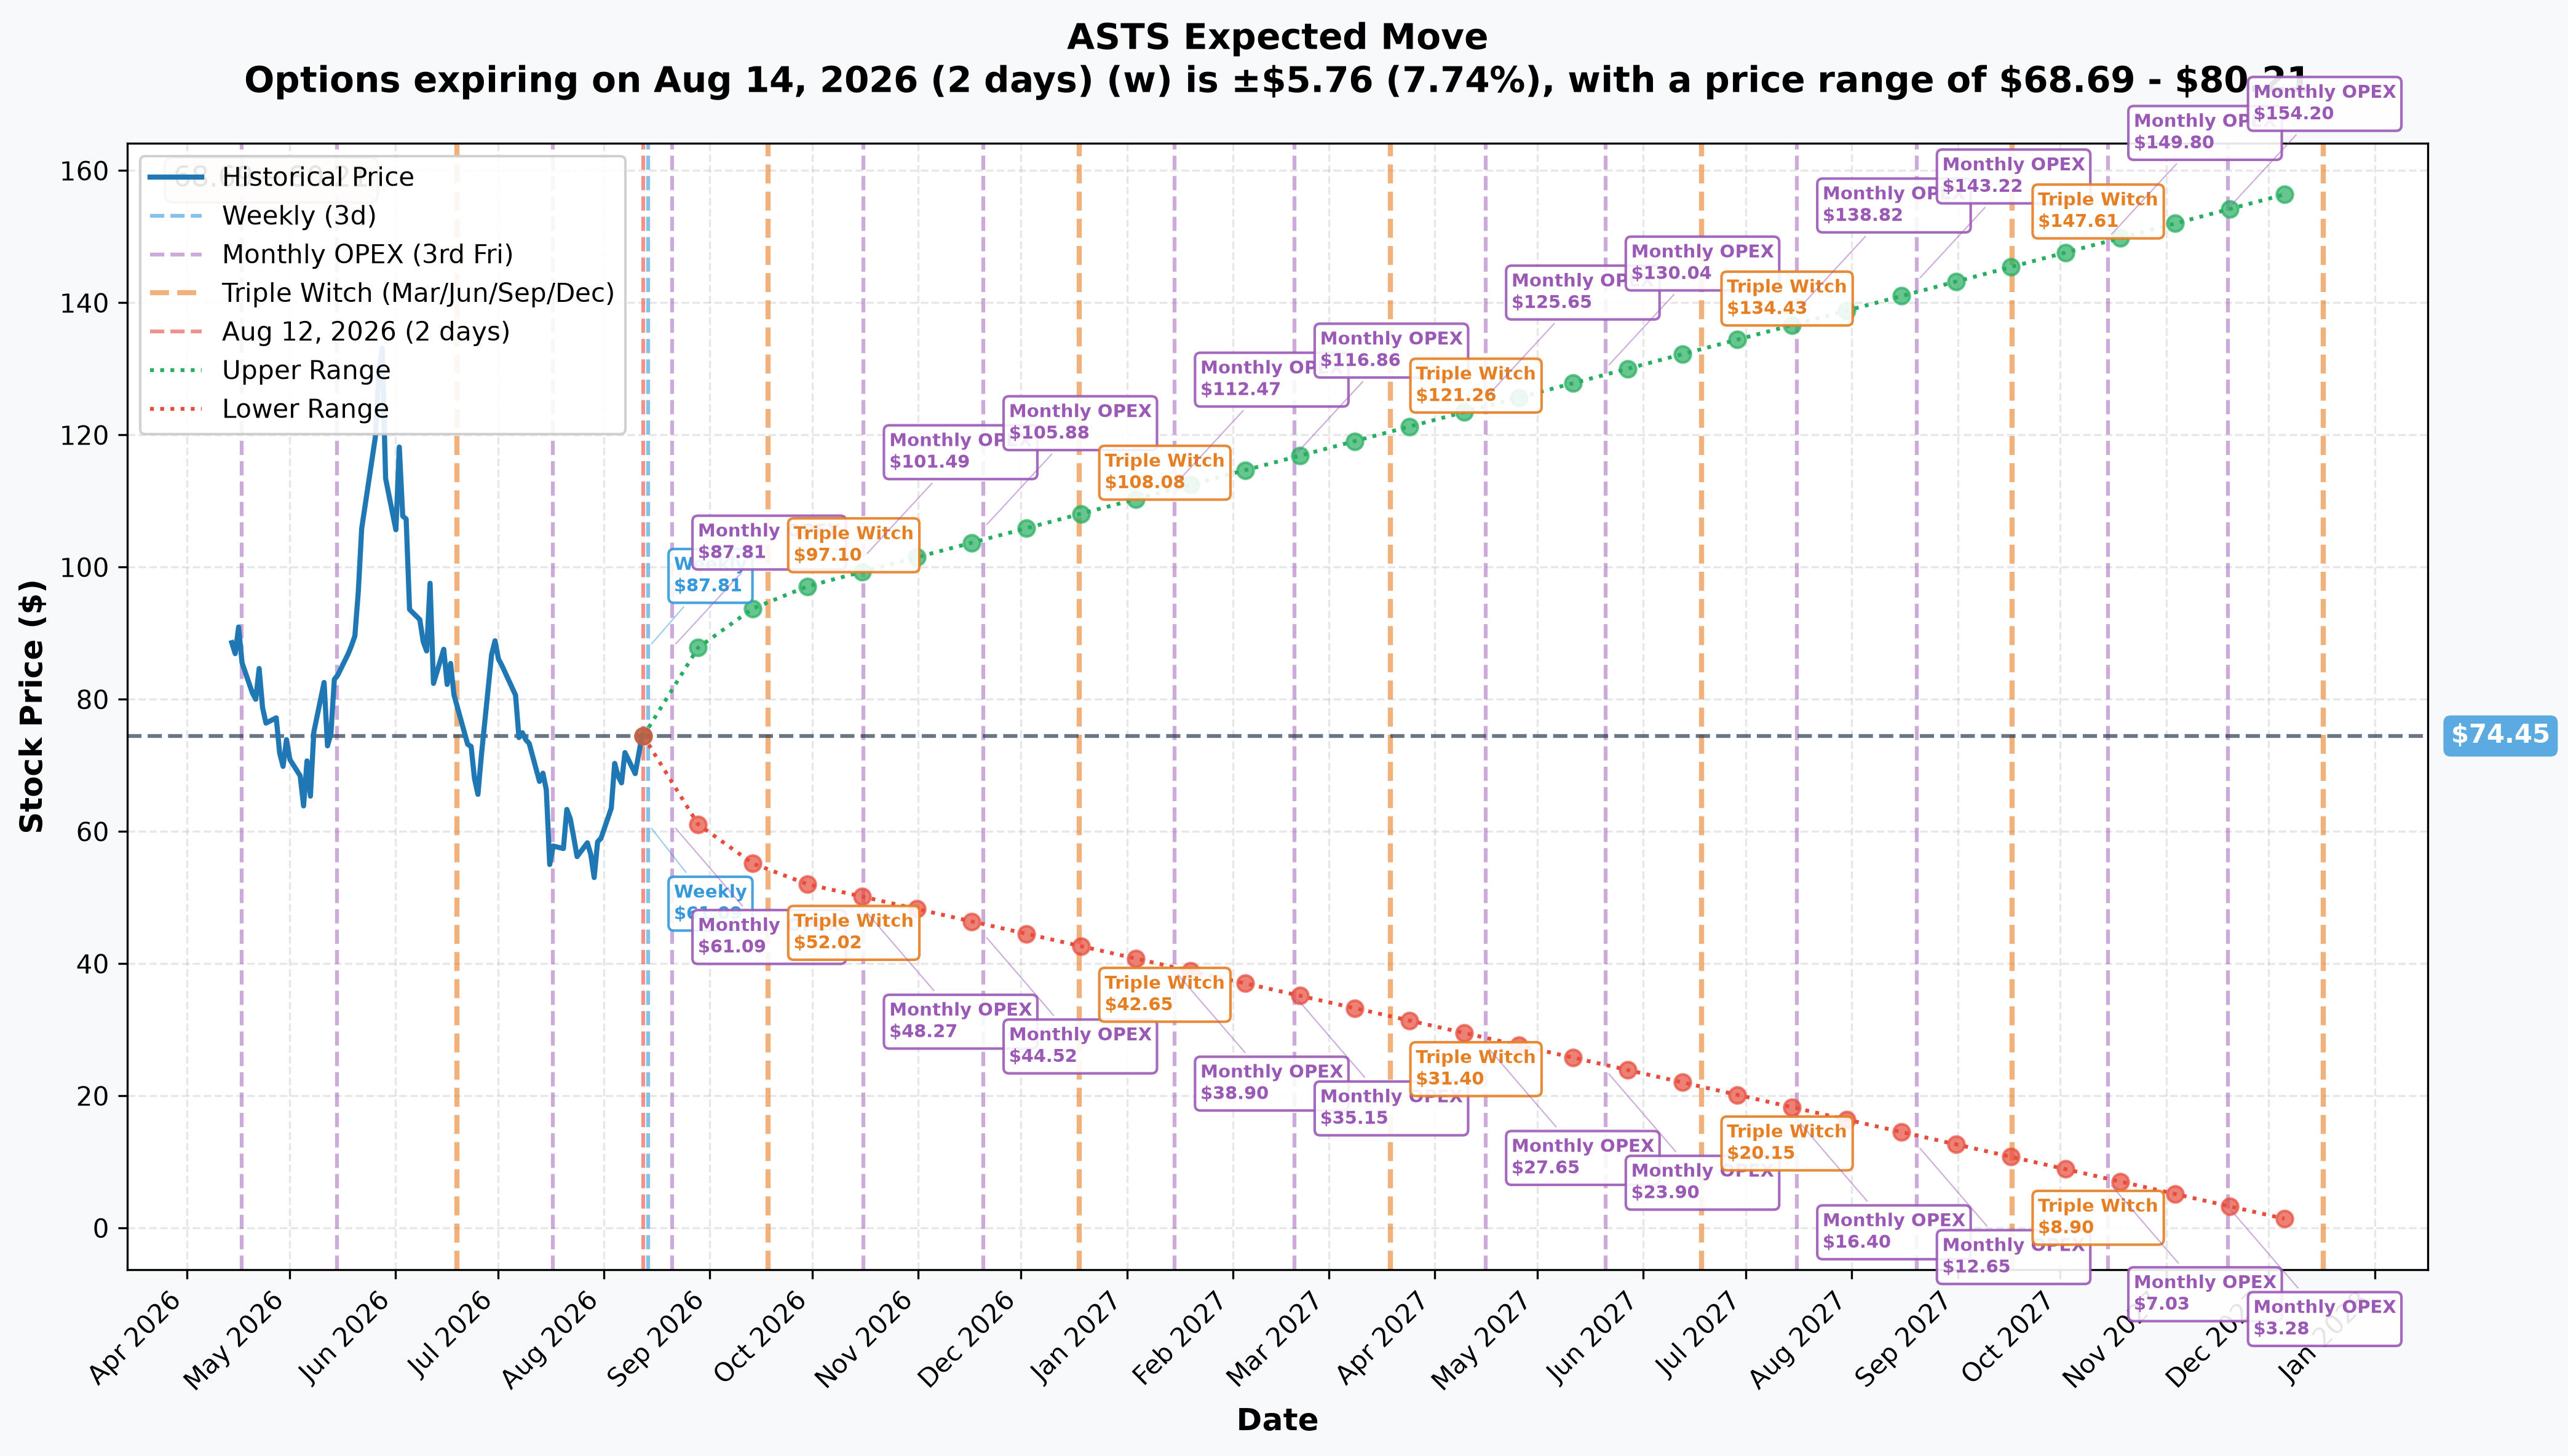
The options market is pricing serious movement, and the further out you look, the wilder it gets:
- To August 14, 2026 (2 days): ±7.74% → range $68.69 – $80.21
- To August 21, 2026 (9 days): ±14.47% → range $63.68 – $85.22
- To September 18, 2026 (37 days): ±28.39% → range $53.31 – $95.59
Even the five-week range tops out at $95.59 — still ≈$38 short of the $133.60 breakeven this trade needs by February. Getting there requires either a catalyst nobody's currently modeling, or a lot more of these five-week ranges stacked on top of each other in the same direction.
Why volatility is priced this hot — and it's earned, not a mispricing
- Beta of 2.74 — nearly triple market risk before any company-specific news
- Short interest 15.25% of shares outstanding — a standing squeeze mechanism
- 52-week range of $36.08–$133.86 — a 3.7x low-to-high spread inside one year
- A literal satellite total loss on April 19 (BlueBird 7, mis-orbited and de-orbited)
- Two capped-call convertible bond structures outstanding, creating natural hedging flows through strikes like $125
- 2x leveraged ASTS ETFs launched May 21, 2026, mechanically amplifying daily swings
None of that is a mispriced option — it's a fairly priced reflection of a genuinely volatile situation.
🎪 Catalysts
What already happened (last 3 months)
The dominant story of the last three months was dilution, not launches, and the stock's reaction proves it. On 2026-07-15, AST priced $1.0 billion of convertible notes (upsized to $1.15B by 2026-07-21), conversion price $79.57, capped call at $149.20 — the stock fell −17.04% in a single session, and July closed at $58.98, down −33.63% for the month from $118.17 on June 2. Compare that to the two actual satellite launches in the same window: BlueBirds 8, 9, 10 on June 17 moved the stock +3.87%, and BlueBirds 11, 12, 13 on August 5 moved it −2.74%. The market has stopped paying for launch cadence and started charging for dilution.
Other recent events:
- 2026-04-19 — BlueBird 7 mis-orbited on New Glenn-3 and subsequently de-orbited, a total-loss event the company said insurance should cover
- 2026-04-22 — FCC granted commercial authority for up to 248 satellites using 700/800 MHz spectrum coordinated with Verizon, AT&T and FirstNet — already granted, not pending
- 2026-08-06 — European network-integration MOUs with Vodafone, Orange, Telefónica, Deutsche Telekom and Vodafone Ukraine across 8 countries — explicitly preliminary, no dates, no financial terms; stock −1.49%
- 2026-08-10 — Q2 2026 results: revenue $31.5M, net loss $230.9M, 13 satellites in orbit, full-year guidance of $150–200M reaffirmed; stock +4.17%
The guidance arithmetic is the central risk here. First-half 2026 revenue totals $46.2M, against reaffirmed full-year guidance of $150–200M — meaning the back half of the year needs to produce 2.2x to 3.3x everything the first half generated. Meanwhile the company has 13 satellites in orbit against a guided 45 by year-end 2026, at a realized cadence of just two launches in roughly 16 weeks. Worth noting pointedly: the Q2 release did not restate a year-end satellite count.
Analyst tape turned neutral, not bearish, over the trailing week: on 2026-08-11, UBS trimmed to $78 (Neutral), Piper Sandler trimmed to $98 (Overweight), while Cantor Fitzgerald raised its target to $90 (Overweight). Consensus rating is Hold.
What's still ahead (through expiration, and beyond)
- Estimated late September – mid October 2026: BlueBirds 14, 15, 16 launch — company confirms readiness, no date announced yet
- "Late 2026" (guided): TELUS Canada beta service milestone
- Estimated early-to-mid November 2026, not yet announced: Q3 2026 earnings — the first checkpoint on whether the H2 revenue ramp is on pace
- December 31, 2026 (guided target): the 45-satellite year-end goal — against 13 in orbit today, this looks unlikely to be hit on the evidence
- Undated: the U.S. mobile-network-operator joint venture (AT&T/T-Mobile/Verizon) — no terms, no timeline disclosed
- Undated: the ≈$1 billion Japan J-LEO award with Rakuten — preliminary selection only, no award date
⏱ The expiration alignment is unfavourable, and that matters. Everything above through the 45-satellite target and Q3 earnings falls inside the February 19, 2027 window. But the report that actually judges whether the $150–200M full-year revenue guidance and the 45-satellite target were met — the Q4/FY2026 results — is estimated for ≈early March 2027, AFTER this option expires. That makes ASTS the fourth name on today's board whose option dies just before the report that would settle its own thesis, joining AVGO, META and IBM. You get the anticipation of the number; you don't get to hold the contract long enough to see it graded. And the two catalysts genuinely large enough to move a $29B company by the ≈80% this trade needs — the U.S. MNO joint venture and the Japan J-LEO award — are both undated. They might land inside the window. Nothing published says they will.
🎲 Four Ways to Read This Trade
🎲 The YOLO trader
You want the $125 call outright, no hedge, full conviction that ASTS breaks $133.60 by February. Know exactly what you're signing up for: the desk that printed this trade may have been delta-hedged with a paired stock leg, meaning they weren't taking the naked risk you'd be taking. Position tiny — this loses 100% of premium unless ASTS rallies ≈80% past a level no analyst on the Street currently forecasts.
📈 The swing trader
The gamma structure says $70–$75 is where the stock lives day to day right now, well below where this call needs to go. If you want exposure to the launch cadence and Q3 earnings catalysts that fall inside this window, a nearer-dated, closer-to-the-money call captures more of the realistic move without needing the stock to erase its entire 2026 decline. Watch the BlueBird 14/15/16 launch window and the Q3 print for entries and exits.
💰 The premium collector
The ≈28% five-week implied move is expensive to buy and correspondingly rich to sell — but selling naked calls into a name with 15.25% short interest and a track record of ≈20%+ single-day gaps is a real squeeze risk, not a theoretical one. A defined-risk credit spread well above the $95.59 five-week implied-move ceiling is the more survivable way to harvest this premium.
🌱 The beginner
This trade is a good teaching example, not a good template to copy. The lesson: a big premium number and a reported "BUY" label don't automatically mean "someone is confidently bullish." When shares trade alongside the options in the same cross, the option's directional signal gets diluted or erased entirely — you need the stock-side data to know what's really being expressed, and often that data isn't available to retail traders at all. When you can't tell, the responsible move is to not draw a conclusion.
⚠️ Honest Limits — What We Cannot Prove
Direction is unproven, and that's the headline risk of relying on this trade as a signal. The stock-and-options cross means a paired equity leg exists that we could not examine; until someone pulls the equity tape at 13:15:34 ET, whether this package is bullish, hedged, or financing-related cannot be determined from the options print alone.
The one-year return figure is a genuine, unresolved data conflict. Our chart shows ≈−14% over the past year; the only other available source shows +62.02%. Both cannot be correct for the same window, and we're not picking one to report as fact.
Beyond those two, several other gaps constrain this analysis and should temper how much weight you put on any single number here:
- No company filing text was read. Attempts to pull SEC filings directly returned errors, so every financial figure above comes from a secondary financial-data source rather than the primary 10-Q/8-K text.
- The investor-relations press-release index is script-rendered and returned no article list on a direct fetch; press-release content was sourced through an aggregator that reproduces the releases rather than the company's own page.
- No options-surface data (implied volatility skew, term structure, open-interest distribution across strikes) was obtainable for this session — every statement above about why volatility is priced where it is rests on inference from sourced underlying facts (beta, short interest, realized moves), not on a direct volatility-surface read.
- No spectrum or regulatory filing source was found covering any pending FCC applications beyond the already-granted April 2026 authorization — that's a gap in the research, not evidence nothing is pending.
Options trading carries substantial risk of loss and may not be suitable for all investors. This entire ≈$1.68M position expires worthless unless ASTS rises to a level, and holds it, that no analyst currently covering the stock is forecasting. Nothing here is a recommendation to buy or sell.
View ASTS · View the ASTS Feb-2027 $125 call
Last updated: 2026-08-13 (pre-market) — the next-day OPRA open-interest snapshot confirmed the open. Feb-2027 $125C 42 → 1,986 (+1,944 against 1,950, 99.7% of size): OPEN (BTO). The ⏳ callout was replaced with the ✅ RESOLVED box; no thesis or title change was required.