🔄 AVGO: A Desk Sold $7.74M of Downside for a Financed $490 Call Bet — But the Sizes Don't Match
📅 2026-08-12 | 🤝 Block Cross Detected
✅ Updated 2026-08-13 pre-market — the next-day OPRA open interest confirmed both legs as fresh opens. The February-2027 $370 put rose 67 → 2,662 (+2,595) against 2,600 sold, and the $490 call rose 82 → 2,087 (+2,005) against 1,800 bought — the call leg landed 11% above the print, meaning other buyers layered onto the strike behind the block. Both STO / BTO labels stand. See the ✅ RESOLVED box.
🎯 The Quick Take
At 12:24:08 ET, a desk printed a negotiated 🤝 block cross: sold 2,600 Broadcom February-2027 $370 puts at $29.77 (≈$7.74M collected) and bought 1,800 February-2027 $490 calls at $35.88 (≈$6.46M paid), for a net credit of ≈$1.28M. Both legs are proven fresh opens (prior open interest just 67 and 82). This is a risk reversal — a synthetic long — but the sizes are not 1-for-1: 2,600 puts against 1,800 calls means the downside obligation is ≈44% larger than the upside claim. And the calendar has a catch: the ">$100B fiscal-2027 AI revenue" story that would justify the $490 call never gets a single delivered quarter of proof before this option expires.
🏢 What Broadcom Actually Is
Broadcom Inc. (NASDAQ: AVGO) designs and supplies semiconductor devices and infrastructure software across two reported segments — Semiconductor Solutions (networking, custom AI accelerators, wireless, server/storage connectivity, broadband) and Infrastructure Software (anchored by VMware) — per the company profile. It's headquartered in Palo Alto, led by CEO Hock Tan, employs ≈33,000 people, and has traded on Nasdaq since its August 6, 2009 IPO (company profile).
Classification: Technology sector, Semiconductors industry (company profile) — GICS Information Technology / Semiconductors & Semiconductor Equipment.
Snapshot (2026-08-12):
| Metric | Value |
|---|---|
| Sector / Industry | Technology / Semiconductors |
| Market cap | ≈$1.99–2.00 trillion (statistics) |
| Shares outstanding | ≈4.76B (statistics) |
| Price at print | $419.46 |
| 52-week range | $281.87 – $495.00 (quote page) |
| Trailing P/E | 69.25 |
| Forward P/E | 26.40 (statistics) |
| Beta (5Y) | 1.47 (statistics) |
| Dividend | $2.60/yr annualized, ≈0.62% yield, 15-year growth streak (dividend page) |
| Fiscal year end | Late October / early November — a 52/53-week calendar, NOT December (company profile) |
The gap between the 26.40 forward P/E and 69.25 trailing P/E (statistics) is the single most important valuation fact here: the market is already pricing a huge forward earnings step-up. That's the assumption this whole trade sits on top of.
One thing to know before anything else: Broadcom's fiscal year does not end in December — it ends in late October/early November. That's why "fiscal Q3 2026" reports in September and "fiscal Q4 2026" reports in December, a full calendar quarter later than most investors expect from the name. This matters directly to the expiration math below.
The two-business split
- Semiconductor Solutions — fiscal Q2 2026 revenue $15,009M, +79% year over year, ≈68% of total revenue (Q2 FY2026 results).
- Infrastructure Software (VMware) — fiscal Q2 2026 revenue $7,178M, +9% year over year, ≈32% of total, at a ≈79% operating margin with 17% ARR growth (Q2 FY2026 call transcript).
Custom AI accelerators (XPUs) are the growth engine inside the semiconductor segment: AI semiconductor revenue was $10.8B in fiscal Q2 2026, +143% year over year (Q2 FY2026 results).
💰 The Trade, in Plain English
A desk sold 2,600 February 19, 2027 $370 puts at $29.77, collecting ≈$7.74M, and bought 1,800 February 19, 2027 $490 calls at $35.88, paying ≈$6.46M — leaving a net credit of ≈$1.28M. Both legs printed at the same second, 12:24:08 ET, as a negotiated block cross — a known counterparty took the other side off the lit book, no urgency, no chase.
Flag this early: the sizes are unequal. 2,600 puts against 1,800 calls is a ≈1.44:1 ratio, not a clean one-for-one risk reversal. The put side is ≈44% larger than the call side, so the downside obligation outweighs the upside claim in raw contract count — even though the premiums collected ($7.74M) and paid ($6.46M) land close together.
📊 Full Trade Details
| Field | Leg 1 (PUT) | Leg 2 (CALL) |
|---|---|---|
| Time | 12:24:08 ET | 12:24:08 ET |
| Buy/Sell | SELL (reported — see direction caveat) | BUY (reported — see direction caveat) |
| Call/Put | PUT | CALL |
| Expiration | 2027-02-19 | 2027-02-19 |
| Premium | ≈$7.74M collected | ≈$6.46M paid |
| Strike | $370 | $490 |
| Volume | 2,600 | 2,000 |
| OI (prior) | 67 | 82 |
| Size | 2,600 | 1,800 |
| Spot | $419.46 | $419.46 |
| Option Price | $29.77 | $35.88 |
| Option Symbol | AVGO20270219P370 | AVGO20270219C490 |
| Order Type | STO — short put, proven open | BTO — long call, proven open |
| Mechanism | 🤝 BLOCK CROSS (negotiated, off-book) | 🤝 BLOCK CROSS (negotiated, off-book) |
Net structure: Risk Reversal / Synthetic Long — short 2,600 Feb-2027 $370 puts, long 1,800 Feb-2027 $490 calls, net credit ≈$1.28M.
✅ RESOLVED — Both Legs Opened, and the Call Strike Drew Extra Buyers
Updated 2026-08-13 pre-market. Resolving OPRA snapshot timestamped August 13 (reflects the August 12 close, after this print); baseline is the August 12 snapshot (reflects the August 11 close, before this print).
| Leg | Baseline (Aug-12) | Resolving (Aug-13) | Δ | Print size | What we published | Verdict |
|---|---|---|---|---|---|---|
| Feb-19-2027 $370 put (sold) | 67 | 2,662 | +2,595 | 2,600 | "rise from 67 toward ≈2,667" | ✅ OPEN (STO) — 99.8% of size |
| Feb-19-2027 $490 call (bought) | 82 | 2,087 | +2,005 | 1,800 | "rise from 82 toward ≈1,882" | ✅ OPEN (BTO) — 111% of size |
The risk reversal is real and it is new. The put leg captured 99.8% of its print as net new open interest; the call leg captured 111%, i.e. roughly 205 contracts of additional buying arrived at the $490 strike beyond the block itself. Neither leg was an existing position changing hands.
The size mismatch the article flagged is confirmed, not explained away. 2,600 puts against 1,800 calls remains an asymmetric package — the resolution proves both sides opened at those sizes; it does not reveal why the desk chose the ratio, and it cannot see any share or futures hedge sitting alongside it.
Direction is still reported, not tape-proven. This printed as a negotiated cross that took no liquidity, so the BUY/SELL tags remain the reported side. Open interest proves new, not who.
🤓 What This Actually Means — Plain English
A risk reversal combines selling a put and buying a call, and the economics work like owning stock without paying for it outright: sell downside insurance to someone else, use the cash you collect to fund upside exposure. Here, selling the $370 puts brings in ≈$7.74M; buying the $490 calls costs ≈$6.46M; the desk nets ≈$1.28M and still gets paid for putting on a bullish structure. That's why it's called a synthetic long — the payoff shape mimics owning shares, financed by taking on a real downside obligation instead of paying cash.
The obligation is real and specific. Selling 2,600 puts at $370 means the seller must buy 260,000 shares of Broadcom at $370 each — a $96.2M commitment — if the stock is below $370 at expiration and the buyer exercises. That's not an abstraction: the $370 strike sits above the $369.34 close from just six weeks ago (July 1, 2026). This obligation has been tested recently, not in some distant hypothetical.
Why the unequal sizes matter. A textbook risk reversal is roughly 1-for-1: the put funds the call and the two sides offset. Here, 2,600 puts against 1,800 calls is a 1.44:1 ratio — the desk is carrying more downside obligation (in contracts) than upside exposure. That tilts the risk: below $370, losses scale off 260,000 shares' worth of exposure; above $490, gains scale off only 180,000 shares' worth. The premium dollars are close ($7.74M vs $6.46M) because the puts are cheaper per-contract than the calls are expensive, but the contract-count mismatch is the real story — this is a bullish bet that's been built with more downside on the table than upside.
Bottom line in plain terms: this is a bullish trade, financed by a real promise to buy 260,000 shares at $370 if Broadcom falls there, in exchange for a shot at upside above $490 on only 180,000 shares' worth of calls — all while collecting ≈$1.28M today. It is not free money. It is a paid-to-wait bet that Broadcom holds above a level it touched six weeks ago, wrapped around a smaller bet that it makes a new all-time high.
📈 Chart Check-Up
YTD Price Action
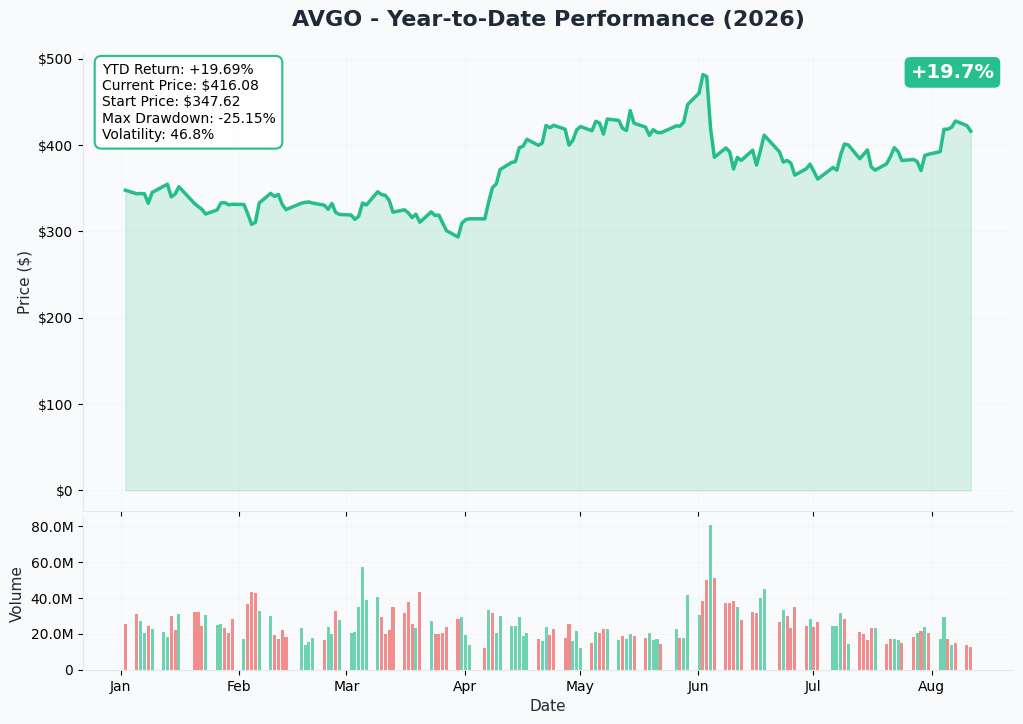
Broadcom's last three months tell the real story, and it's not the flat headline it looks like. Year to date the stock is ≈+21.7% ($344.80 → $419.46), but the trailing three months are almost dead flat at ≈+0.2% ($418.61 → $419.46) — reached only by a violent round trip: +18% to a $495.00 all-time high around June 2–3, then a ≈−25% collapse to a $369.34 close on July 1, then +14% back to today's level. The stock fell that hard on a beat — the June 3 fiscal Q2 report topped both revenue and EPS estimates, but the AI chip guidance "missed lofty estimates" (Investor's Business Daily). That's the backdrop for both strikes in today's trade: the $370 put sits right at a level the stock has visited within the current quarter, and the $490 call needs to reclaim a high the stock only just fell away from.
Gamma Support & Resistance
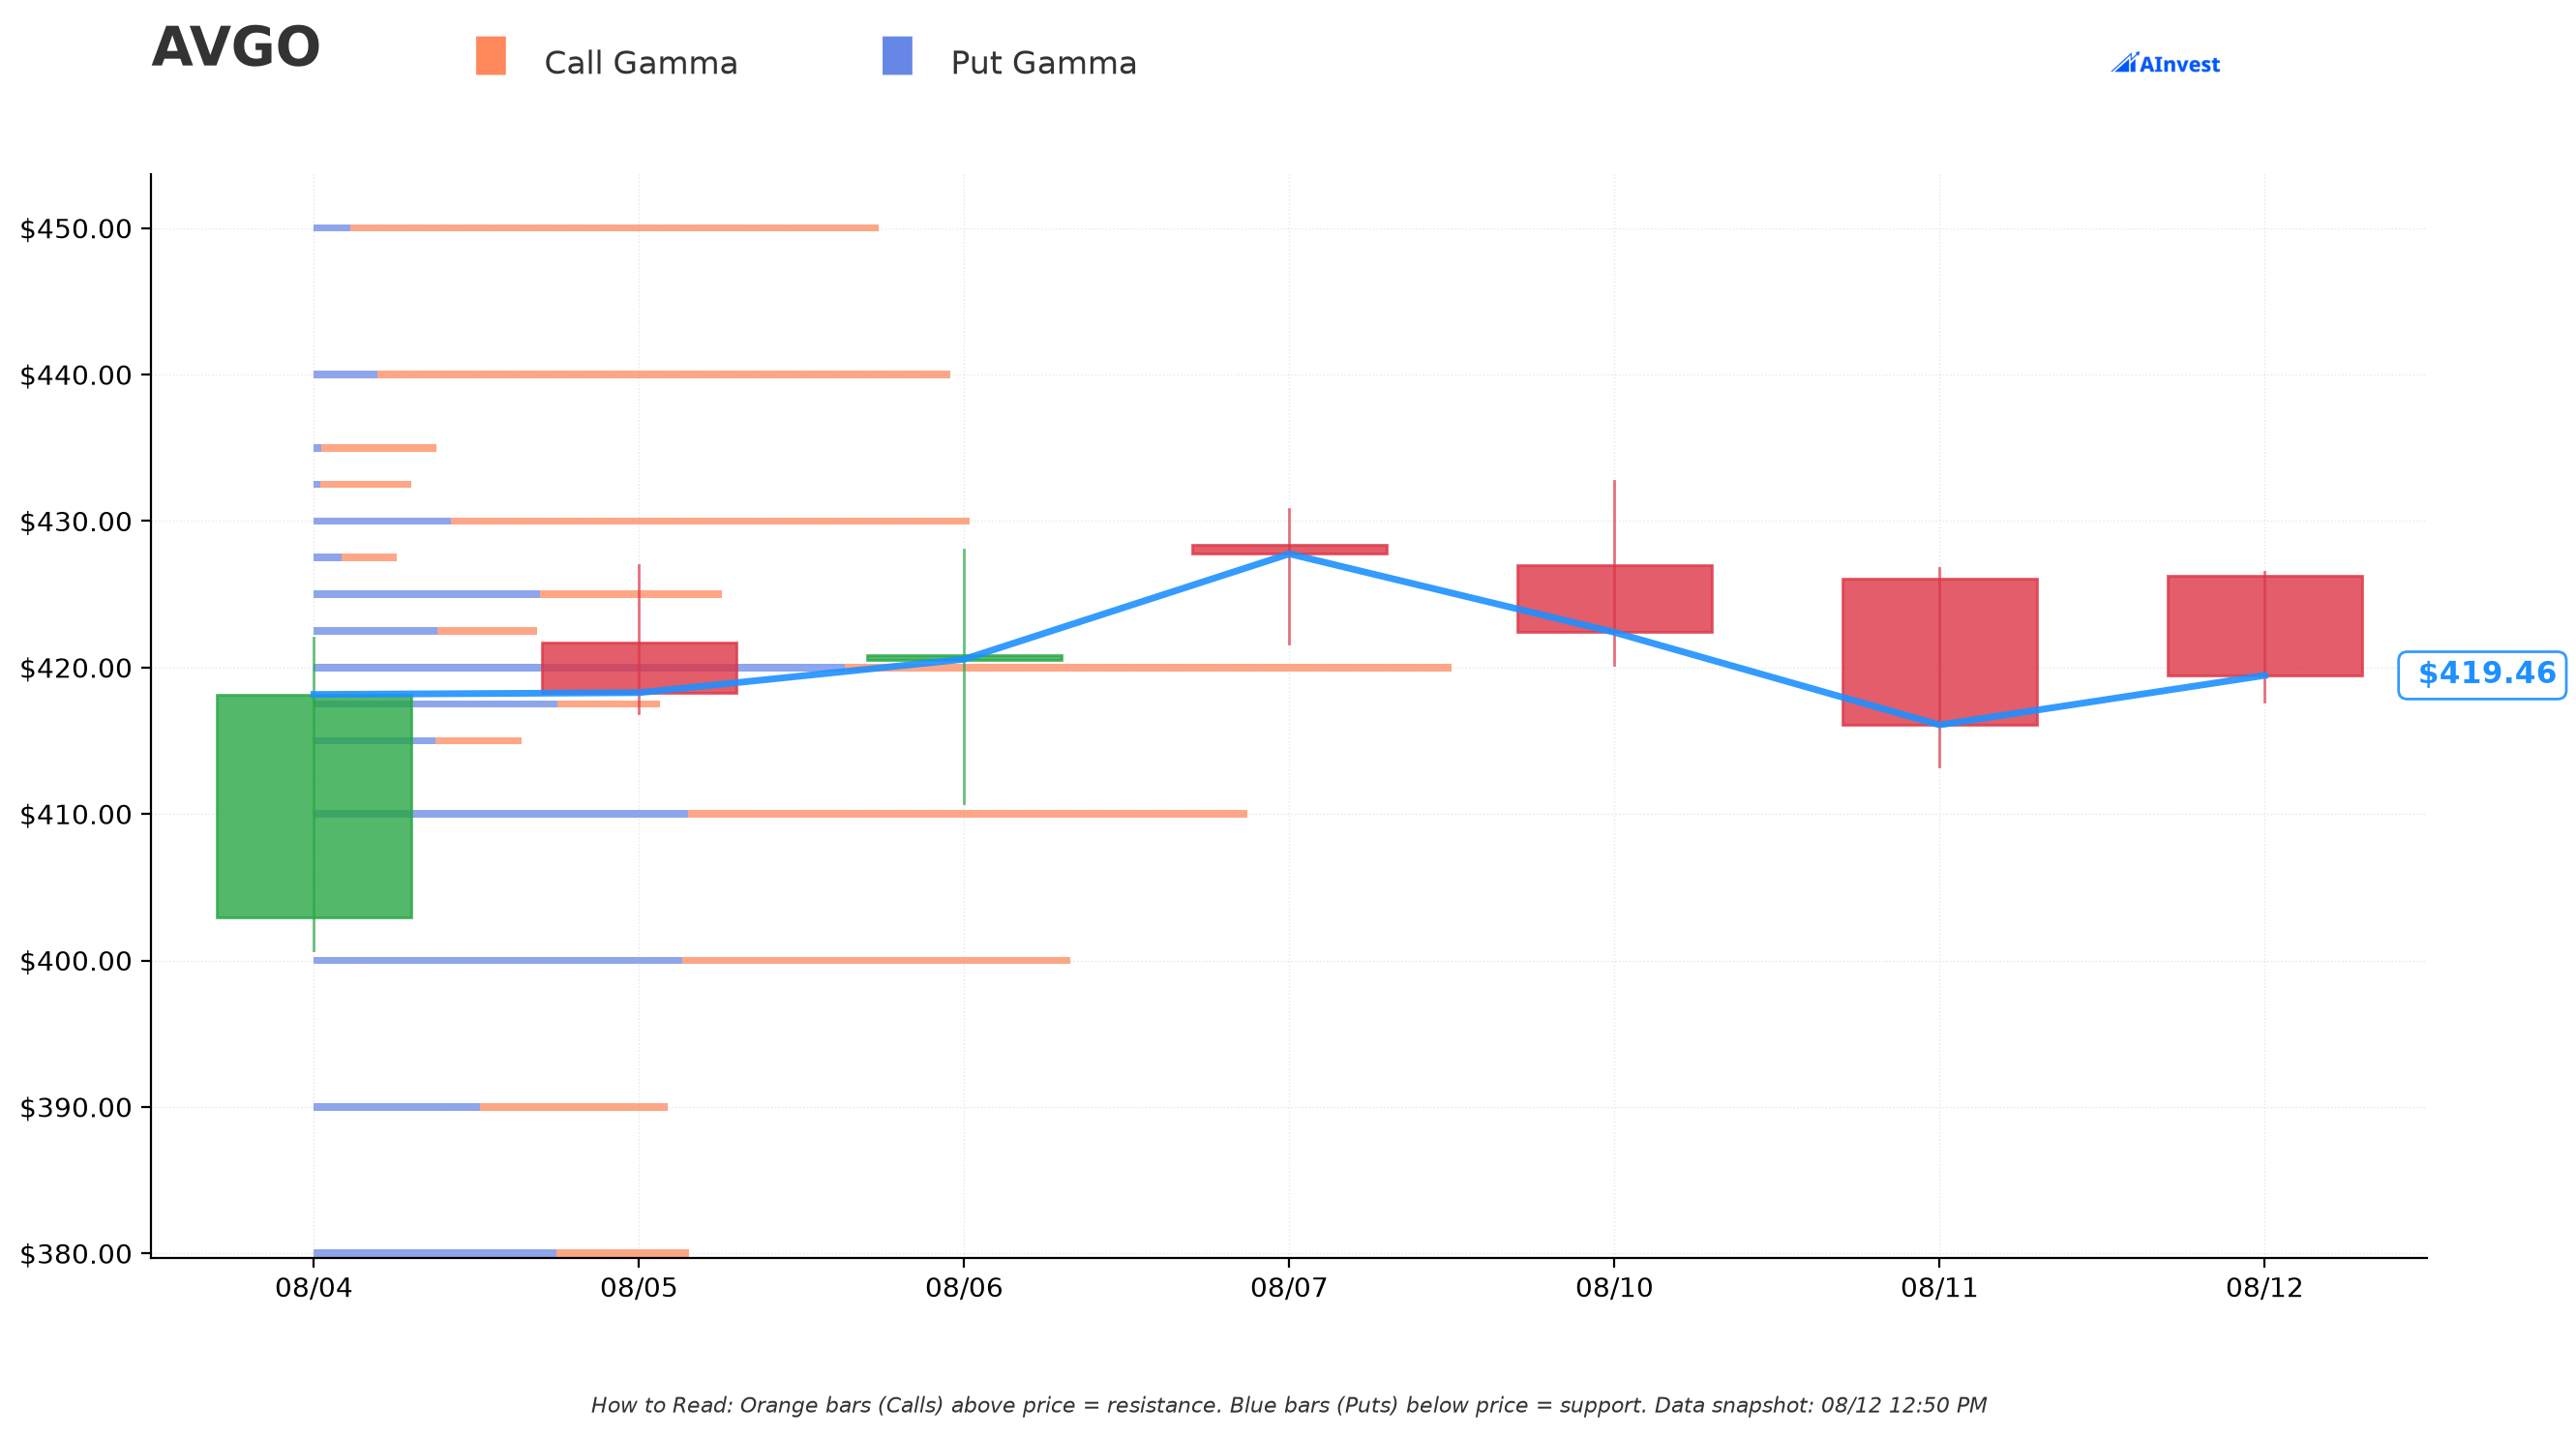
Referenced to a $419.54 spot, the gamma model flags $420 as Very Strong resistance — essentially right on top of today's price — and $410 as Very Strong support, ≈2.3% below spot. In plain terms: dealer hedging flows are clustered tightly around today's level, with $420 and $410 forming the nearest walls in either direction. Further out, $430 and $440 show up as secondary Very Strong resistance, and $400 as the next Very Strong support band. None of this reaches anywhere near the $370 put strike or the $490 call strike — gamma structure like this is a same-day positioning map, useful for the next few sessions, not a 6-month forecast for an option that runs to February 2027.
Implied Move
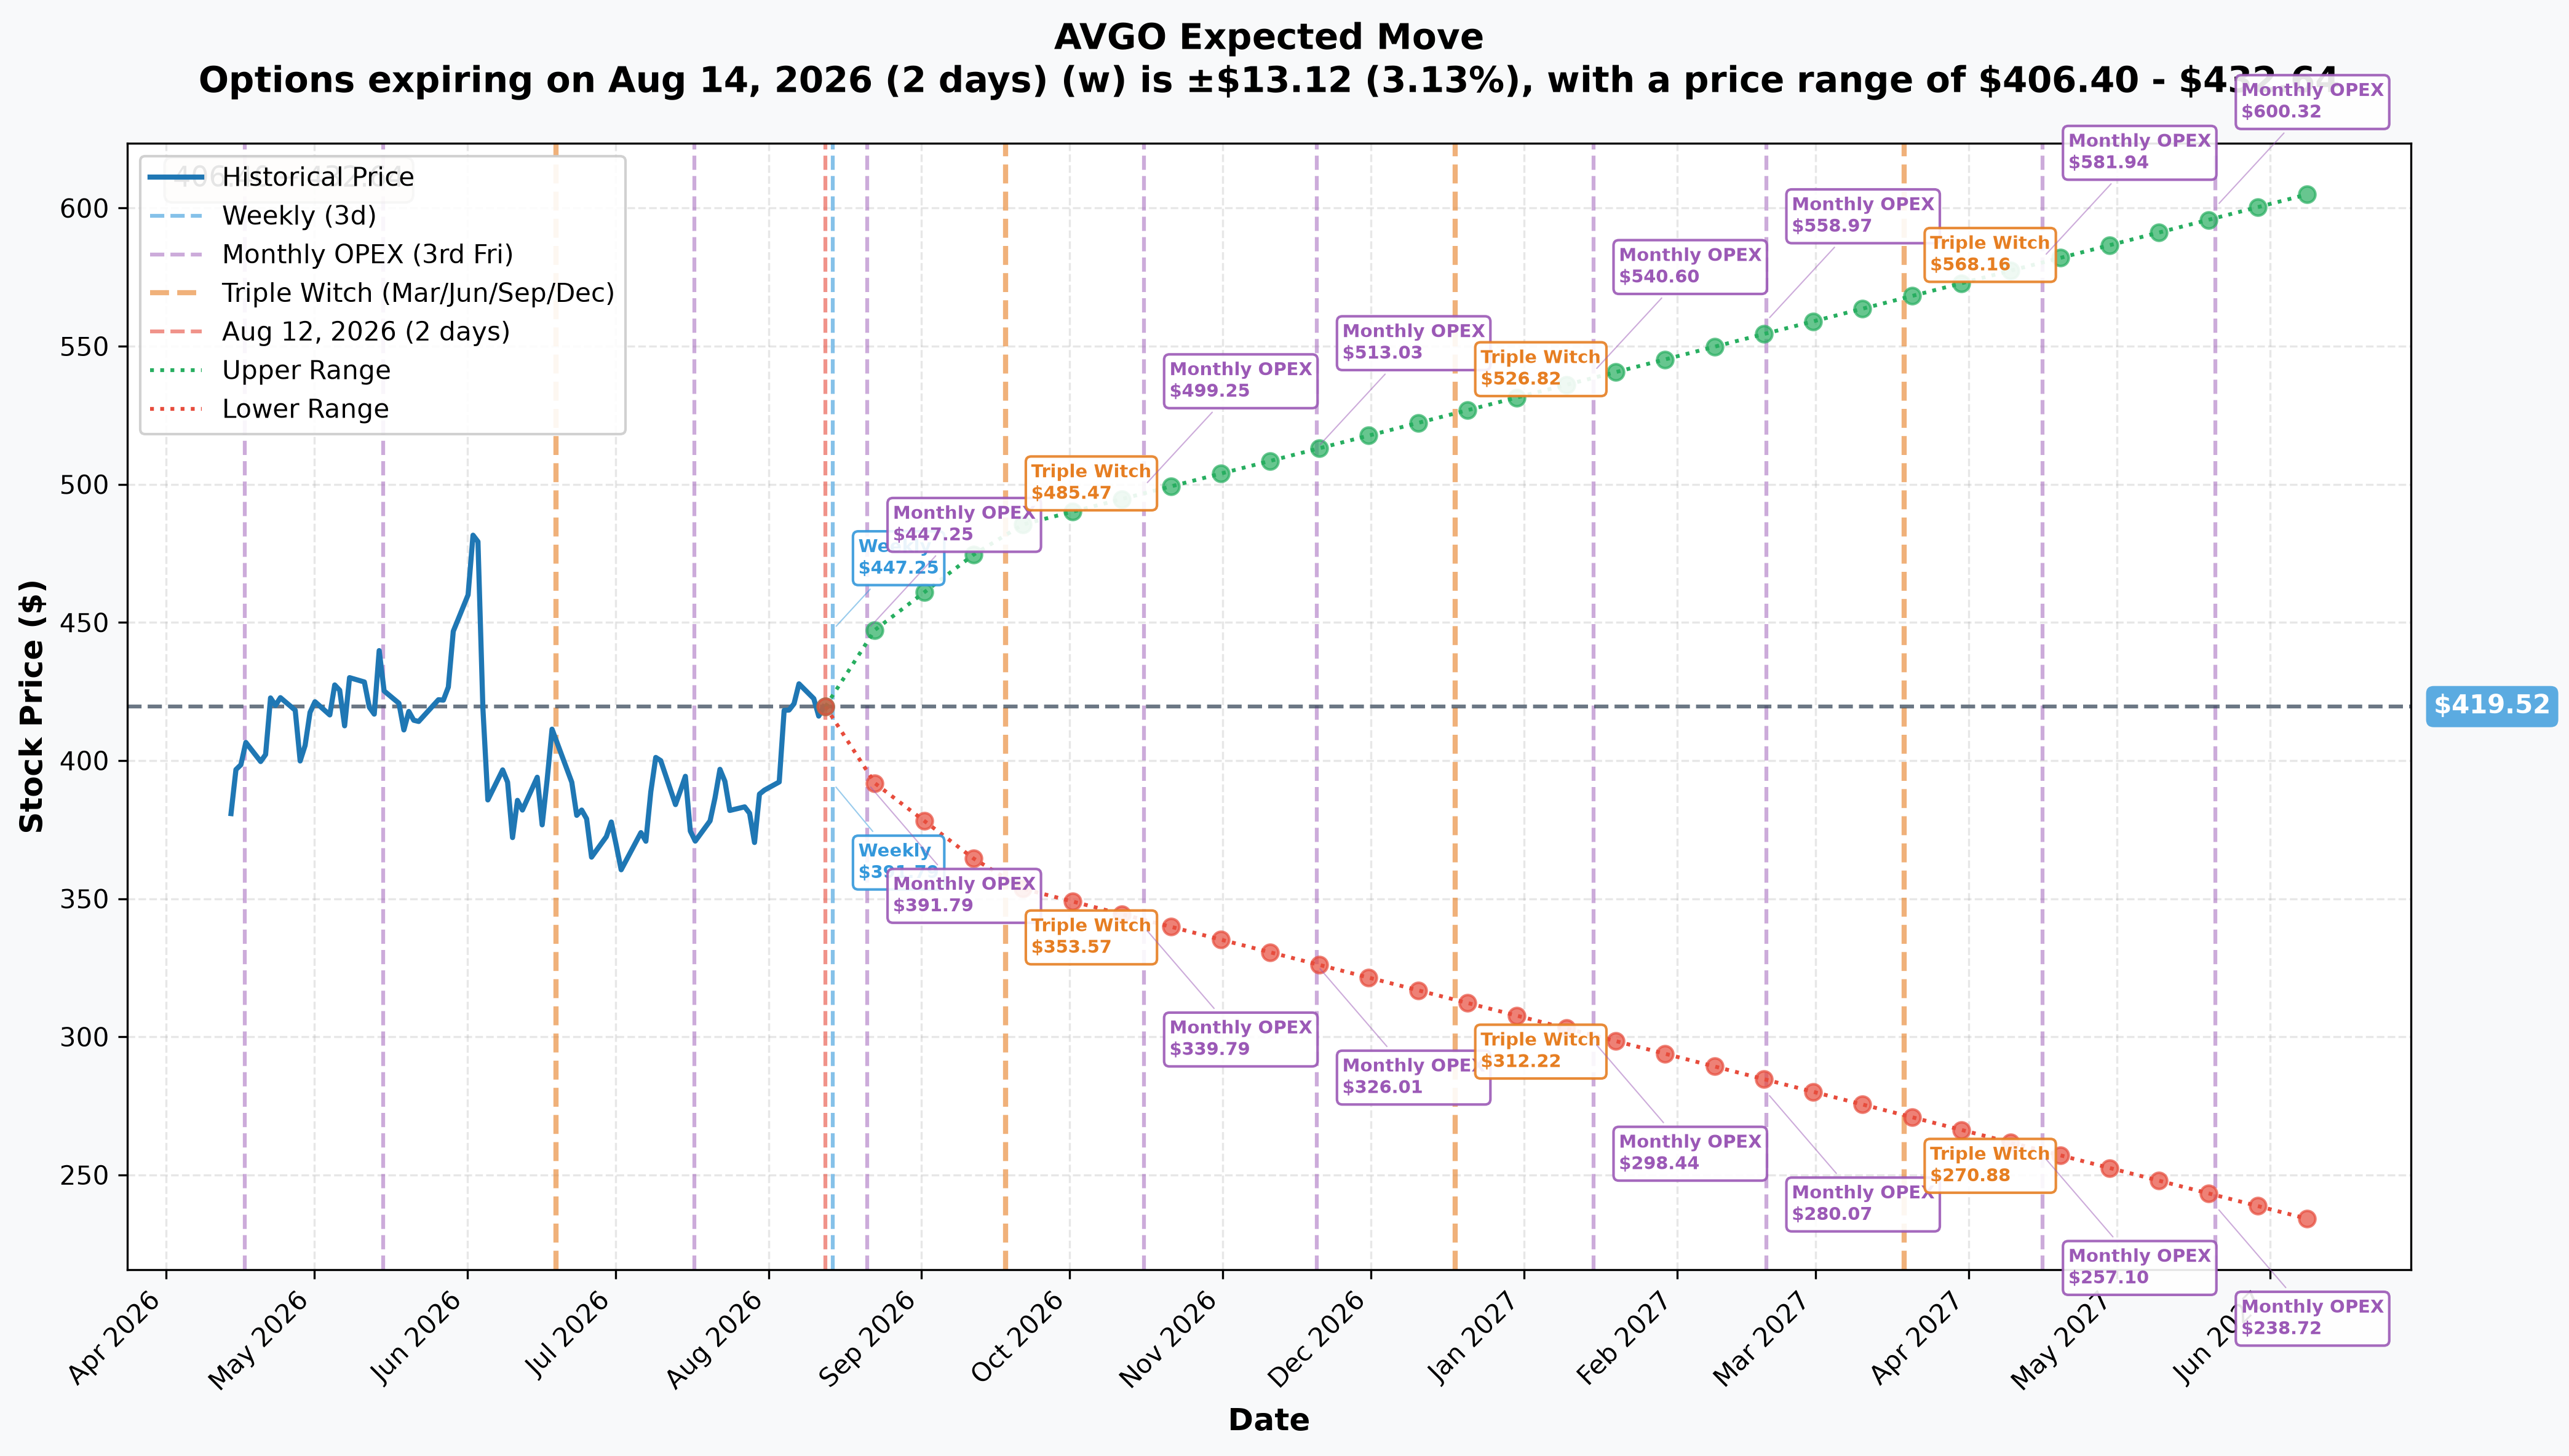
The options market is pricing:
- ±3.13% to August 14 ($406.40 – $432.64) — this week
- ±6.29% to August 21 ($393.15 – $445.89) — monthly OPEX
- ±15.39% to September 18 ($354.95 – $484.09) — the next triple-witch, ≈37 days out
Look at that last range closely: the September 18 lower bound, $354.95, is already below the $370 short put strike. That's more than five weeks before Broadcom even reports its next earnings (September 2 falls inside this window). It means the options market is currently pricing a real, non-trivial chance that the stock trades through $370 well before the actual February 2027 expiration — this isn't a remote tail the desk is selling insurance against, it's a level inside the market's own one-month expected range.
🎪 Catalysts
Keep these separate: the catalyst dates below are when things actually happen. The traded option expires 2027-02-19 — that date is a deadline, not a catalyst.
⚠️ The decisive calendar finding
Exactly two quarterly reports land inside the life of this option:
- Fiscal Q3 2026 — September 2, 2026, after the close. Company-confirmed (Broadcom announcement, coverage). Just 21 days from today.
- Fiscal Q4 + full-year 2026 — ≈December 10, 2026. Estimated from the December 11, 2025 precedent (Q4 FY2025 release).
Here's the part that matters most: fiscal Q1 2027 ends inside this window (≈January 31, 2027) but reports outside it — ≈early-to-mid March 2027, roughly 13 days after the February 19, 2027 expiration (pattern from the March 4, 2026 Q1 FY2026 release — source). That means the ">$100 billion of fiscal-2027 AI semiconductor revenue" management reiterated on the June 3 call (Q2 FY2026 call transcript) never gets a single delivered quarter of proof inside this option's life. Both the September and December prints only offer guidance about FY2027 — the first actual FY2027 number arrives after this trade is already settled.
That makes the ≈December 10 print the single most important event for the $490 call. It's Broadcom's full fiscal-year report, historically where next-year guidance gets framed and where the dividend increase tends to land.
The business case behind the bullish leg
Fiscal Q2 2026, reported June 3, 2026 (quarter ended May 3, 2026): revenue $22,187M, +48% year over year, non-GAAP EPS $2.44 against a $2.40 consensus, AI semiconductor revenue $10.8B, +143%, free cash flow $10,262M, adjusted EBITDA margin 69% (Q2 FY2026 results). Semiconductor Solutions revenue was $15,009M (+79%); Infrastructure Software (VMware) was $7,178M (+9%) at a ≈79% operating margin and 17% ARR growth (Q2 FY2026 call transcript).
Guidance for fiscal Q3 2026: revenue ≈$29.4B, with AI semiconductor revenue ≈$16.0B, >200% year over year, and gross margin guided down to ≈74% on AI mix, not pricing erosion (Q2 FY2026 call transcript). Management also disclosed AI bookings exceeding $30B against $10.8B shipped — a ≈2.8x book-to-bill — full fiscal 2026 AI revenue guided to ≈$56B (+≈180%), and reiterated fiscal 2027 AI semiconductor revenue "in excess of $100 billion" (Q2 FY2026 call transcript).
A derived number, clearly labeled as researcher arithmetic, not a company disclosure: if fiscal 2026 AI revenue totals $56B and the second half doubles the first half as management stated, first-half AI revenue is ≈$18.7B and second-half is ≈$37.3B. With Q2 at $10.8B, that implies Q1 was ≈$7.9B; with Q3 guided to $16.0B, the implied fiscal Q4 AI quarter works out to ≈$21B — a number that would print at the ≈December 10 report, exactly the event this option most needs to go its way.
Customer wins. Management named six core custom-accelerator (XPU) customers on the June 3 call (Q2 FY2026 call transcript): Anthropic added "another 5 gigawatts of next-generation TPU-based compute beginning in 2027"; OpenAI has a "contractual commitment to deploy 1.3 gigawatts in 2027" inside the previously announced 10-gigawatt collaboration (Broadcom/OpenAI release); Meta committed to "3 gigawatts through the end of 2028," but its deliveries start H2 2027 — outside this option's window; and two additional customers placed $6 billion of purchase orders, with shipments beginning late 2026. On June 24, 2026, OpenAI and Broadcom revealed "Jalapeño," their first co-developed inference chip (CNBC) — tangible proof the 10 GW deal is shipping product. On July 25, 2026, Samsung and Broadcom signed a memorandum of understanding valued at more than $200 billion across memory, foundry and packaging through 2030 (Samsung Semiconductor newsroom, CNBC) — this is a supply-side commitment, Broadcom buying capacity, not a revenue win, and it's worth being precise about that distinction since some headlines read the opposite way.
The bear case — real weight, because the price path is the story
Broadcom fell ≈25% peak-to-trough on a beat. The June 3 report topped both revenue and EPS estimates and the stock still dropped from $495 to $369.34 by July 1 because the AI chip guide "missed lofty estimates" (Investor's Business Daily). Gross margin is explicitly guided down to ≈74% as AI mix rises. Customer concentration is real — six named XPU customers, and Meta's much larger 3 GW commitment doesn't start delivering until H2 2027. And there's an escalating EU antitrust matter targeting the ≈79%-margin VMware segment: Broadcom lost its court bid to suspend a Commission document-production request on August 3, 2026 (Reuters) — a live, unresolved process with no fixed decision date, aimed squarely at the part of the business that isn't AI-cyclical.
Analysts remain broadly positive but split: MarketBeat shows 28 Buy / 4 Hold / 0 Sell across 32 analysts with an average target of $493.24 — essentially at the $490 long-call strike, meaning the trade is buying a level Wall Street's central estimate says is roughly fair value 12 months out, on an option with only ≈6 months to run. A second source, stockanalysis.com's quote page, shows a higher average target of $527.88. Erste Group Bank downgraded to Hold on July 7, 2026 on valuation concerns (coverage), and the low end of published targets, $375–$380 (MarketBeat), sits essentially right at the short put strike.
Dividends inside the window
Two ex-dividend dates fall inside the option's life, both estimated from the historical pattern of Broadcom's ex-dates clustering on the ≈20th–23rd of the last month of each fiscal quarter (dividend history):
- ≈September 21, 2026 — ≈$0.65
- ≈December 21, 2026 — ≈$0.65, or higher; this is historically where the annual dividend raise lands. The prior increase went from $0.59 to $0.65 with the December 2025 payment (dividend history).
Total ≈$1.30 of dividends detach from the stock inside the life of this option, possibly more if December brings a raise. Get the mechanism right: ex-dividends drive early exercise of in-the-money calls, not puts — a call holder exercises early specifically to capture a dividend before it goes ex, so if the $490 call is ever deep in the money near a December ex-date, early-exercise risk on that leg is real. For the short $370 put, the dividend's relevance runs through the forward-price effect (dividends lower the forward price the put is priced against, making it mechanically slightly more valuable) and the "paid to wait" motive: a desk willing to be short 260,000 shares' worth of exposure at $370 is signaling comfort owning Broadcom at a level where the forward P/E compresses from 26.4x toward roughly 23x, with a growing dividend as part of the compensation for waiting.
🎭 How Different Traders Should Read This
🎲 The YOLO trader
There's no lottery ticket in the structure itself — a 6-month risk reversal on a $2T semiconductor name, crossed as a negotiated block, is an institutional financing trade, not a leveraged flyer. If you want pure directional torque, the $490 call alone (long only, no short put funding it) is the closer analog, but understand it needs a new all-time high above $495 just to have intrinsic value, and the street's own average price target ($493.24) sits right at that strike with only ≈6 months to get there. The real YOLO risk in this structure isn't the call — it's forgetting that the short put side carries a genuine $96.2M obligation on 260,000 shares if Broadcom revisits a level it touched six weeks ago.
📈 The swing trader
The gamma levels are your near-term map: $420 Very Strong resistance sits essentially on top of spot, $410 Very Strong support ≈2.3% below. The implied-move cone gives you the realistic near-term range — ±3.13% to August 14, ±6.29% to August 21, and critically, ±15.39% to September 18 already reaches down to $354.95, below the $370 strike. That September range is your signal: the market is pricing real odds of testing $370 well before the September 2 earnings catalyst even lands. Watch how price behaves around $410 and $420 through the next few weeks — a clean break of $410 puts the market's own pricing on the same page as the short put's risk.
💰 The premium collector
This structure is worth studying even if you wouldn't build it exactly this way. The seller collected ≈$7.74M for the obligation to buy 260,000 shares at $370 — a strike that's above where the stock closed just six weeks ago and at the low end of published analyst targets ($375–$380). That's not a remote-tail sale; it's a bet on a level that's been tested this quarter. If you're running anything similar — even a smaller, single-leg version — size it as if you might actually own the shares at $370, because a beat-driven ≈25% drawdown already happened once this year on this exact name. The financed call side (funded by the put, not by fresh cash) is the more defensible piece of this trade; the naked downside obligation is where the real risk sits.
🌱 The beginner
Selling a put means promising to buy stock at a set price if the buyer wants to sell it to you; buying a call means paying for the right to buy stock later at a set price. Put the two together and you get a risk reversal: sell the put to collect cash, use that cash to help pay for the call. The result behaves like owning the stock, financed instead of paid for in cash. Here, the seller is promising to buy 260,000 Broadcom shares at $370 each — a $96.2M commitment — while also buying the right to profit above $490 on a smaller 180,000-share equivalent. If Broadcom stays between $370 and $490, the put obligation never triggers and the call likely expires worthless — the desk simply keeps the ≈$1.28M net credit. If Broadcom falls below $370, the desk can be forced to buy stock well above the market price, with a loss that grows the lower it goes. This is not free money — it's compensation for a real, sizeable obligation on a stock that has already fallen 25% once this year, on a beat.
⚠️ Honest Limits — What the Tape Can't Prove
- The BUY/SELL labels are reported, not tape-proven. This printed as a negotiated block cross that took no liquidity — the percentage-across-the-spread and IV-change reads that apply to lit, liquidity-taking trades don't apply here.
- Counterparty and motive are invisible. OPRA shows the print, not who was on either side, whether the seller is hedged elsewhere, or whether this is one leg of a larger book.
- Research-process gaps, disclosed honestly: the session's search budget was exhausted before this report, so link discovery relied on direct page fetches rather than broad search; Broadcom's own investor-relations site repeatedly timed out, so primary release content came via newswire copy and earnings-call transcript mirrors rather than the issuer's own page directly; SEC EDGAR filings returned errors, so nothing here is sourced to a 10-Q or 8-K.
- All dates marked "estimated" are pattern extrapolations, not company statements — specifically the ≈December 10, 2026 Q4 report, the ≈March 2027 Q1 report, and both the ≈September 21 and ≈December 21, 2026 ex-dividend dates. Broadcom has not published a fiscal 2027 reporting calendar that could be retrieved.
- The ≈$21B implied fiscal Q4 2026 AI revenue figure is researcher arithmetic, derived from the disclosed $56B full-year guide and the "second half doubles first half" statement — it is not a company disclosure.
- Unverified or lower-confidence items: the exact September and December 2026 S&P 500 rebalance effective dates could not be confirmed; the December 2026 Nasdaq-100 reconstitution dates are extrapolated from the prior cycle; the literal GICS sub-industry string could not be independently verified against an S&P Dow Jones Indices source; the current pace of share buybacks under the $10B authorization (expiring December 31, 2026) is unverified — only the dividend cash outlay was discussed on the Q2 call; no Broadcom investor day or analyst day could be confirmed inside this window, which is an absence of evidence, not evidence of absence.
Options trading involves substantial risk, including the potential loss of more than the amount invested. Selling puts carries the obligation to buy stock at the strike regardless of where the market has moved — a short put on a $2 trillion stock that fell 25% on a beat six weeks ago is a real obligation, not free money. This is not a recommendation to buy or sell any security; size any position according to your own risk tolerance and do your own diligence.
Last updated: 2026-08-13 (pre-market) — the next-day OPRA open-interest snapshot confirmed both legs. Feb-2027 $370P 67 → 2,662 (+2,595 against 2,600): OPEN (STO); $490C 82 → 2,087 (+2,005 against 1,800, 111% of size): OPEN (BTO). The ⏳ callout was replaced with the ✅ RESOLVED box; no thesis or title change was required.