🛡️ BE's $24M Two-Year Collar: Capping Upside at $350 to Fund Cheap Crash Protection at $110 (Net ≈Costless)
📅 July 29, 2026 | 🔥 Unusual Activity Detected
✅ Updated July 30, 2026 — both collar legs confirmed as fresh opens, and both came in above our published targets. Call open interest rose 839 → 4,801 (+3,962) against a predicted ≈4,250; put open interest rose 73 → 4,068 (+3,995) against a predicted ≈3,490. The near-costless two-year collar is fully new protective structure on both sides. Detail in the ✅ RESOLVED box below.
🎯 The Quick Take
Someone just wrapped a 2-year protective collar around 3,415 contracts of Bloom Energy — selling the Jun-2027 $350 calls while buying the Jun-2027 $110 puts, both at once, both brand-new positions. The two legs are worth ≈$12M each, but because the call premium collected (≈$12.06M) almost exactly offsets the put premium paid (≈$11.84M), the net cost is essentially $0 — a ≈$220K credit. This is not a bullish call sale for income and not a naked bearish bet — it reads as someone capping their upside far above the market to buy cheap crash insurance far below it, on a stock that has already round-tripped violently this year. 👀
📊 Company Overview
Bloom Energy (BE) designs and builds solid-oxide fuel cells — "Bloom Energy Servers" — that generate electricity on-site from natural gas, biogas, or hydrogen through an electrochemical reaction rather than combustion, delivering fast-to-deploy, grid-independent power. The 2026 thesis is that AI data centers need multi-gigawatt power now, faster than utility grid interconnects can deliver, making Bloom's on-site microgrids a primary power source for hyperscalers rather than just backup generation.
- Market Cap: ≈$47B (down from a peak near $87.6B in June 2026 when the stock traded near $300)
- Sector/Industry: Capital Goods / Electrical Equipment — solid-oxide fuel cells & on-site power generation
- Current Price: ≈$161.58 at the moment this trade printed (the stock has since whipsawed toward ≈$170 intraday as the Q2 earnings beat digests)
💰 The Option Flow Breakdown
📊 What Just Happened
Mechanism: listed two-leg combo — one order, executed electronically. This is not a negotiated block cross and not a lit sweep; both legs printed together as a single package.
| Time | Buy/Sell | Call/Put | Expiration | Premium | Strike | Volume | OI | Size | Spot | Option Price | Option Symbol |
|---|---|---|---|---|---|---|---|---|---|---|---|
| 12:33:01 | SELL | CALL | 2027-06-17 | $12.06M | $350 | 4,300 | 839 | 3,415 | $161.58 | $35.30 | BE20270617C350 |
| 12:33:01 | BUY | PUT | 2027-06-17 | $11.84M | $110 | 4,300 | 73 | 3,415 | $161.58 | $34.65 | BE20270617P110 |
🧮 The net-credit math:
- Collected on the $350 call: 3,415 × $35.30 × 100 = $12,055,900
- Paid on the $110 put: 3,415 × $34.65 × 100 = $11,835,975
- Net = ≈$219,925 CREDIT — essentially costless. The eye-catching "$12M" per-leg number is notional/gross premium, not capital at risk. This trader put on a wide, two-year risk-reversal for close to zero net cash.
✅ RESOLVED — Both Legs Opened, Both Above Target (July 30, 2026, ≈06:30 ET)
Both legs' size (3,415) was far larger than the prior open interest (839 calls, 73 puts before this print), so both already looked like fresh opens rather than closes. The official OPRA snapshot timestamped 2026-07-30 (reflecting the EOD July 29 close) confirms it on both sides:
| Leg | Baseline OI (Jul 29 snap) | Resolving OI (Jul 30 snap) | Δ | Headline print | Full package vol | Predicted | Verdict |
|---|---|---|---|---|---|---|---|
| Jun-17-2027 $350 C | 839 | 4,801 | +3,962 | 3,415 | 4,291 | ≈4,250 | ✅ OPEN (STO) — beat target |
| Jun-17-2027 $110 P | 73 | 4,068 | +3,995 | 3,415 | 4,292 | ≈3,490 | ✅ OPEN (BTO) — beat target |
What the numbers say:
- Both legs exceeded the published predictions. The put strike went from a near-empty 73 contracts to 4,068 — a ≈56-fold build from essentially nothing.
- The reason Δ runs slightly above the 3,415-lot headline print is that the headline was the largest single clip inside a larger worked package: the strikes traded 4,309 calls and 4,303 puts for the session, of which ≈4,291 on each side printed as one multi-leg electronic combo (cond 130). ΔOI accounts for ≈92% of that package on both legs — a clean, near-complete open with only a small transfer component.
- The symmetry is the tell. Both legs opened in nearly identical size (+3,962 / +3,995). A collar only works if both sides go on together, and open interest now proves they did. This was not a call sale that happened to coincide with put buying — it was one structure.
- The trade forensic originally carried only MEDIUM confidence because a 180-day lookback cannot rule out an older position. That caveat is now retired for both legs: HIGH confidence, fresh open, both sides.
- Tape re-verified: no cancellation codes (the 40-44 family) on either strike. Attribution is clean.
Bottom line: the near-costless two-year collar is confirmed as brand-new protective structure — nothing here was a close, a roll, or a transfer.
🤓 What This Actually Means — Plain English
Forget "bullish" or "bearish" labels for a second — this is a collar, also called a risk reversal: you sell an out-of-the-money call to collect premium, and use that premium to buy an out-of-the-money put further away. Here's the order-type breakdown:
- 🔴 STO the $350 call (Sold-To-Open, LOW→MEDIUM confidence fresh open): this trader gave up any stock upside above $350 — about +117% from the $161.58 reference spot — between now and June 2027. In exchange, they collected $35.30/share.
- 🟢 BTO the $110 put (Bought-To-Open, MEDIUM confidence fresh open): this trader bought the right to sell at $110 — about −32% below spot — through June 2027, paying $34.65/share for that floor.
Put those together and you get a structure that gives away almost nothing to get almost nothing in net cash, but changes the risk profile completely: from $110 up to $350, this position does essentially nothing (no premium at risk either way). Below $110, it's protected — losses are capped. Above $350, gains are capped — the upside beyond that level effectively belongs to whoever bought the call.
Why does this matter? A trader who does this is very likely protecting an existing long position (shares, or long calls, or a large unrealized gain) rather than making a fresh speculative bet. Bloom is up roughly 1,000%+ over the trailing year, so "lock in the win, buy cheap insurance" is a completely rational move for a large holder — especially on a name that already fell ≈47% from its June peak once this year. This is downside-protection / bearish-lean positioning, not premium-collection income, and not a naked directional wager.
One more wrinkle worth flagging honestly: the paired equity tape around this print shows only an ≈89,200-share stock block — far short of the ≈240,000 shares that would be needed to fully delta-hedge a combo this size. So as far as the visible tape shows, this looks like an essentially unhedged, options-only structure — the protection is coming purely from the options themselves, not from an accompanying stock trade we can see.
📈 Technical Setup / Chart Check-Up
YTD Performance Chart
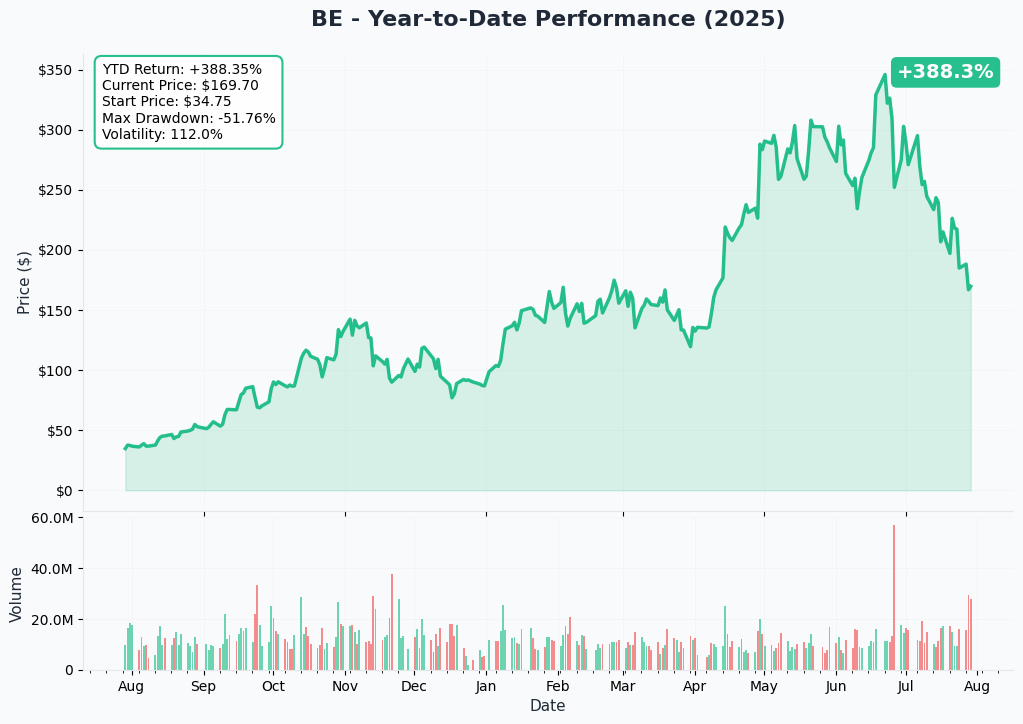
Bloom's chart tells the whole story in one picture: a monster run fueled by AI-datacenter power deals, a violent ≈47% drawdown after the July 8 short-seller report, and now a sharp bounce off the record Q2 print. This is a beta ≈3.74 stock — more volatile than roughly 90% of the market — so both the rally and the crash you see on this chart are entirely normal behavior for BE, not aberrations.
Gamma-Based Support & Resistance Analysis
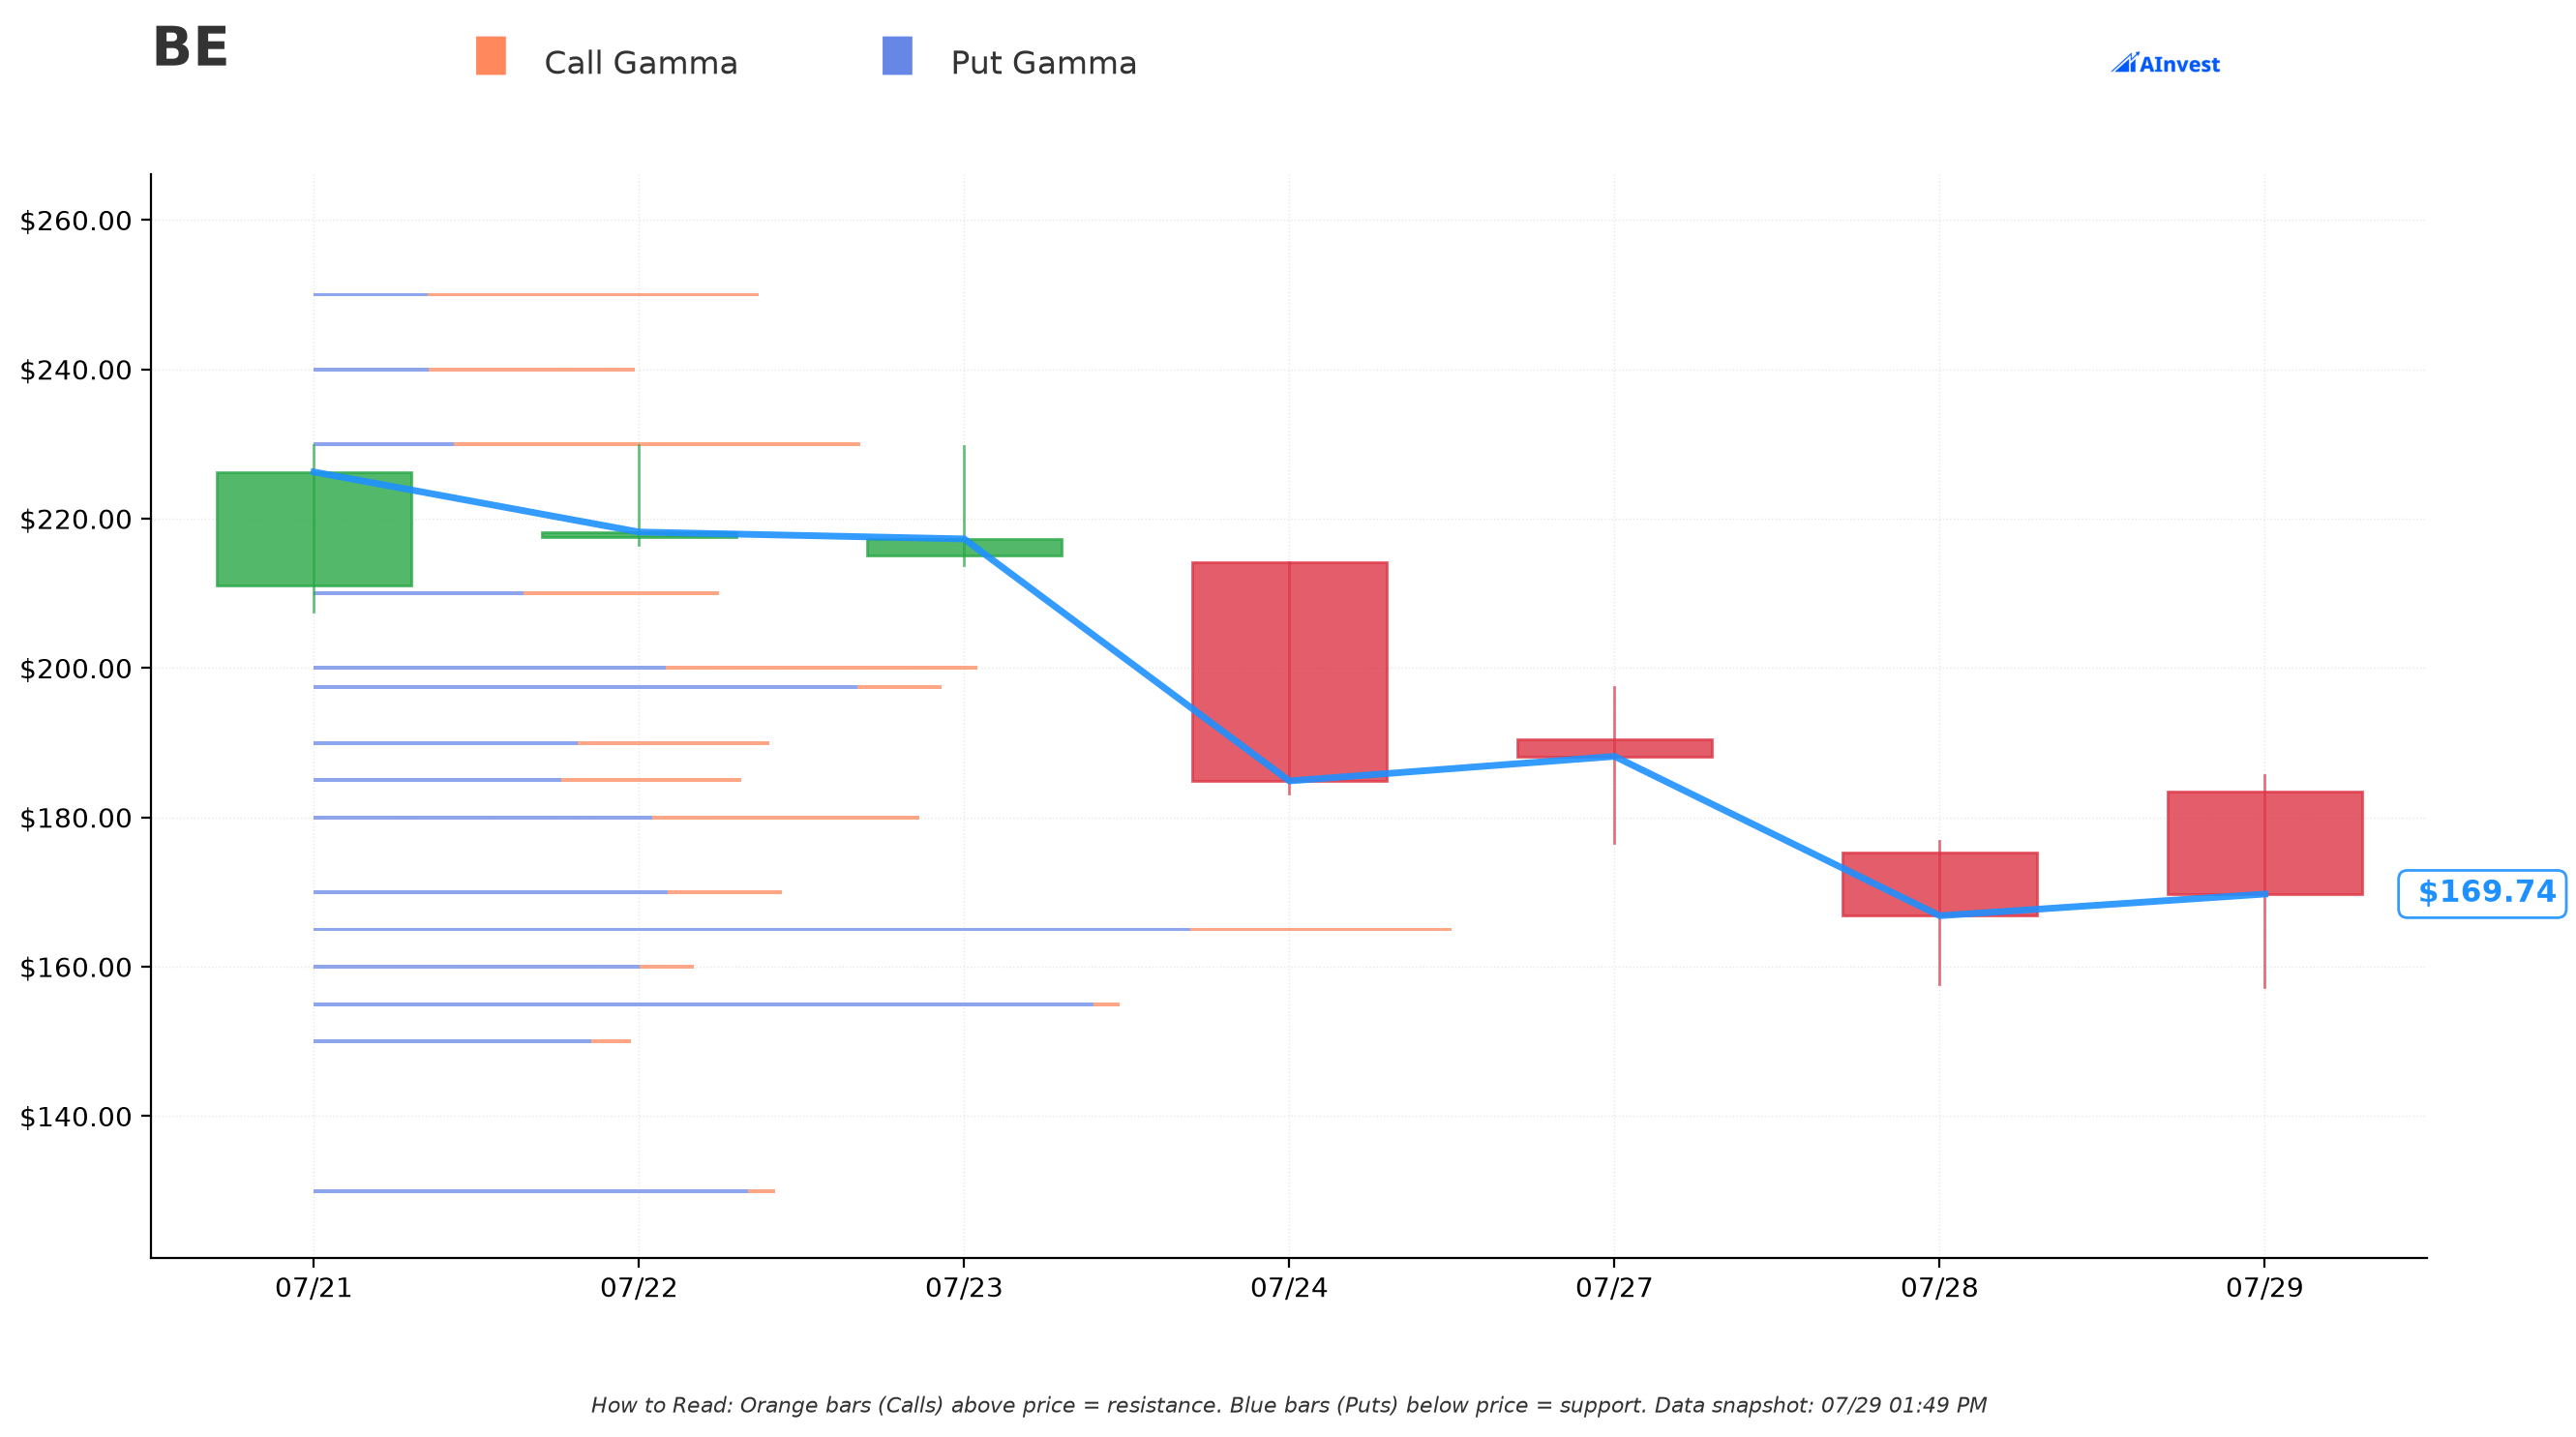
The gamma map (current snapshot price ≈$170.15) flags only one clean level: a Strong support wall at $165 (≈3.0% below the snapshot price), built almost entirely from put open interest (put gamma $4.30 vs call gamma $1.29 at that strike — total exposure $5.59). Scanning the rest of the chain near spot ($150–$200), net gamma is negative at almost every strike — puts dominate calls across the board — which is a hallmark of a name where a lot of holders have already been buying downside protection. No resistance wall was flagged above spot today, consistent with a stock that doesn't have an obvious gamma "ceiling" pinning it down right now — moves in either direction can travel further before dealer hedging pushes back.
Zooming out to the collar's own strikes: at $350, total gamma is tiny (≈$0.88, mostly call-side) — the far upper strike sits well outside where dealers are actively hedging today. At $110, gamma is modest but put-heavy (≈$0.63, mostly puts) — a level that already has some crash-scenario positioning built into it, which this new put simply adds to.
Implied Move Analysis
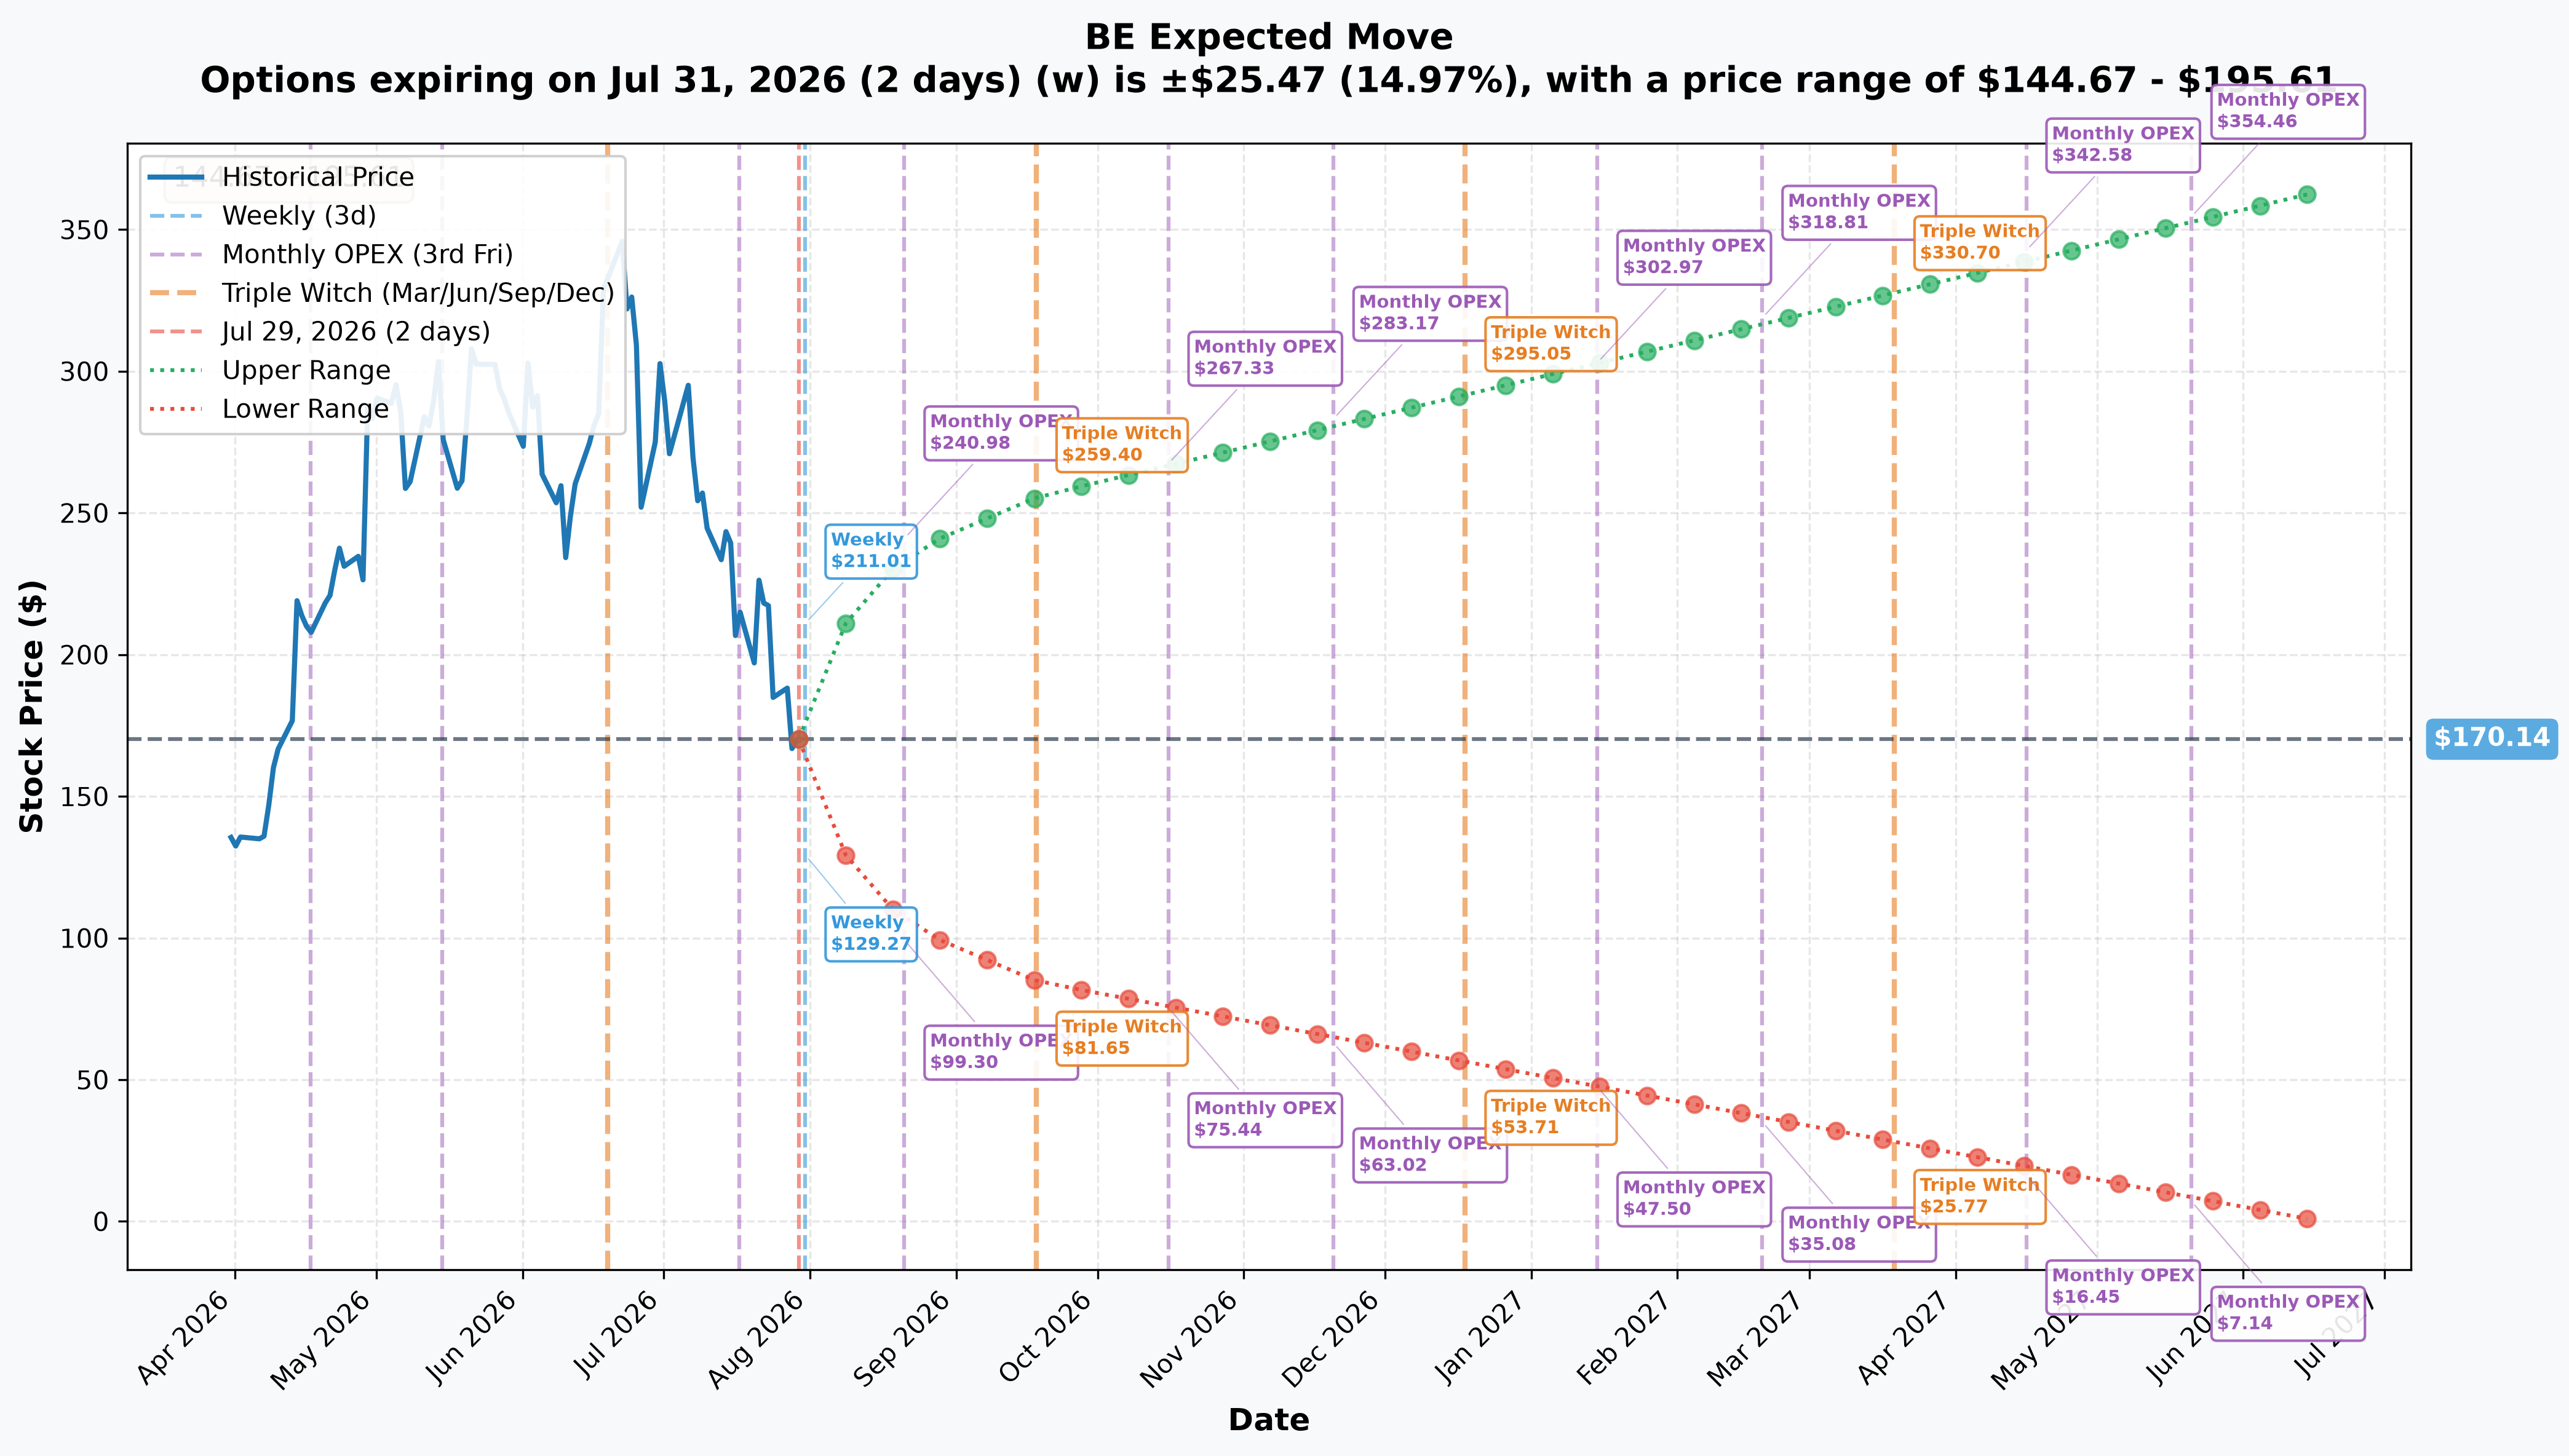
Options market pricing for upcoming expirations (from today's snapshot, ≈$170.15):
- 📅 Weekly (Jul 31 — 2 days): ±$25.47 (±15.0%) → Range: $144.67 – $195.61
- 📅 Monthly OPEX (Aug 21 — 23 days): ±$65.89 (±38.7%) → Range: $104.25 – $236.03
- 📅 Quarterly Triple Witch (Sep 18 — 51 days): ±$85.70 (±50.4%) → Range: $84.44 – $255.84
- 📅 Jun-2027 LEAPS (323 days — THIS TRADE'S EXPIRATION!): ±$193.43 (±113.7%) → Upper $363.57 / lower range clipped at $0
Translation for regular folks: the market is pricing a jaw-dropping ±15% move for the next two trading days alone — that's the earnings-aftermath volatility still working through the options chain. Zoom out to this trade's own June 2027 expiration and the implied range is so wide (±113.7%) that the downside side of it blows straight through zero — the options market genuinely can't rule out an extreme move either way over that horizon.
That context explains this trade's strikes perfectly. A drop to $110 is only about −32% from the $161.58 reference spot — comfortably inside a range this wide, which is exactly why that put was cheap ($34.65) despite being deep out-of-the-money. And the $350 call sits almost exactly at the upper edge of the market's own one-year implied range (≈$363.57) — the seller collected a real premium for giving away upside the options market itself already treats as near the statistical ceiling.
🎪 Catalysts
✅ Recent Catalysts (Already Happened)
Record Q2 2026 earnings — July 28, 2026 📊
Bloom delivered its first-ever $1B+ revenue quarter: $1.065B revenue (+165.5% YoY) versus ≈$827M expected, non-GAAP EPS of $0.78 versus ≈$0.41 consensus, and a full-year guidance raise to $3.9B–$4.2B revenue and $2.55–$2.85 non-GAAP EPS. Shares initially traded down to ≈$159.80 before rallying +8–12% on the beat, and jumped to $185.60 (+11.24%) in the immediate after-hours reaction on the Investing.com print.
Oracle "Project Jupiter" & expanded AI power deals
Oracle, BorderPlex Digital Assets and Bloom announced on April 27, 2026 that up to 2.45 GW of Bloom fuel cells will power Oracle's New Mexico AI campus, replacing planned gas turbines after a right-of-way denial. That follows an Oracle master services agreement for up to 2.8 GW announced April 13-14.
Brookfield financing framework expanded to $25B
In early July, Brookfield Asset Management raised its project-financing framework for Bloom-powered AI infrastructure from $5B to $25B under its $100B AI Infrastructure Fund — a 5x increase management cited on the Q2 call as a demand accelerant.
The Hunterbrook short report — July 8, 2026 ⚠️
Hunterbrook's "Bloom's Big Lie" report alleged Bloom sources scandium oxide via Chinese intermediaries despite management's no-China-supply-chain claims, and challenged the ≈$20B unaudited backlog against ≈$492M in audited binding performance obligations. BE fell ≈35% over the following month and ≈47% from its June 25 peak into July 24, per Barron's/Yahoo Finance. Bloom called the report "false and misleading" and said its supply chain can support 25 GW of annual production.
🔮 Upcoming Catalysts (Next ≈6 Months)
- Q3 2026 earnings (est. late October / early November 2026, unconfirmed): the key test of whether H2 revenue can hit the run-rate implied by the raised guidance, and whether the disputed backlog converts to recognized revenue, per Tech Times.
- Fremont 2 GW manufacturing line completion (target: year-end 2026): physical proof of capacity to fulfill the Oracle and AEP order books.
- Oracle Project Jupiter build-out milestones: conversion of the up-to-2.45 GW commitment into installed, operating capacity through 2026–2027.
- AEP 1 GW installation update (H2 2026): would convert American Electric Power's largest commercial fuel-cell procurement to date into operational evidence.
- First large project closings under the expanded $25B Brookfield framework would validate both demand and financing capacity.
- Supply-chain rebuttal / audited disclosures: Bloom said it will "correct the record" on the Hunterbrook allegations — any detailed disclosure is a genuine two-way catalyst, per Stocktwits.
🎲 How Each Type of Trader Might Read This
🚀 YOLO Trader
This trade is a poor template for you — it's a hedge, not a lottery ticket, and the strikes are so wide (2 years out, $110 to $350) that there's nothing here to copy for a fast move. If you want exposure to the same volatility, the weekly options (±15% priced in for the next 2 days alone) are where the action is — but understand you're betting against an options market that's already pricing extreme moves, and IV is likely to be elevated and mean-revert fast.
⚖️ Swing Trader
Pay attention to the $165 gamma support and the fact that net gamma is negative across almost every nearby strike — that combination means moves can extend further than usual once they start, in either direction, because dealers aren't leaning against the tape as hard as they would in a positive-gamma regime. A break below $165 or a reclaim toward the $180–$200 zone are the levels worth watching over the next few sessions.
💰 Premium Collector
This is not a premium-collection trade to copy directly — the trader gave the credit right back by buying the put, so there's no meaningful income here. But the mechanics are worth stealing: if you're already long BE stock or calls, selling a far-OTM call to fund a deep-OTM put is a textbook zero-cost collar for locking in gains without paying cash out of pocket. Just know you cap your own upside above whatever strike you choose.
🌱 Beginner
Think of this trade like buying flood insurance for a house you already own, and paying for it by promising your neighbor first dibs if you ever sell above a crazy-high price you don't expect to hit anytime soon. You're not betting the house will flood or that you'll get that price — you're just making sure you're covered on the downside without spending real money to do it. That's what a collar is.
⚠️ Risk Factors & Honest Limits — What the Tape Cannot Prove
- We cannot see who did this or why. The tape shows a two-leg combo execution — it does not reveal broker, MMID, customer identity, or order ID. We're inferring "this looks like protection for an existing gain" from the structure and the stock's recent behavior, not from any disclosed intent.
- We cannot see an unseen hedge. The only equity activity near this print was an ≈89,200-share block — far short of a full delta hedge for a position this size. That means either (a) this really is an unhedged, options-only structure, or (b) the hedge exists somewhere we can't see (a different venue, a different day, futures, or another options position entirely).
- We cannot fully rule out a pre-existing position. Our archive lookback covers 180 days; the classifier's confidence is MEDIUM, not HIGH, specifically because a position established before that window wouldn't show up as a "prior trade" even if one exists.
- Size-vs-OI confirms opens are likely, not certain. Both legs are far larger than prior OI, which is a strong tell for fresh opens — but the only definitive proof is tomorrow's official OPRA open-interest print. Treat today's read as high-probability, not guaranteed, until that confirms.
- This is not investment advice. Options trading involves substantial risk of loss and may not be suitable for all investors. A 2-year collar built by an institutional-size trader may reflect portfolio considerations (tax positioning, concentrated stock risk, existing option books) that have nothing to do with retail trading decisions. Always size positions to what you can afford to lose and consider consulting a licensed advisor.
🎯 The Bottom Line
Here's the deal: this isn't a whale betting big on Bloom Energy going higher, and it isn't a whale betting big on it crashing either. It's someone capping a gain far above the market ($350, +117% from spot) to buy cheap crash protection far below it ($110, −32% from spot), for close to zero net cost. On a stock that's already round-tripped from a ≈$300 peak down ≈47% and back up on an earnings beat in the space of a month, "insure the downside, give up the moonshot upside" is a rational move for someone sitting on a large existing gain — not a signal that smart money expects a crash tomorrow.
Mark your calendar:
- ✅ July 30, ≈06:30 ET — done. Next-day OPRA open interest confirmed both legs as fresh opens: calls 839 → 4,801 (+3,962), puts 73 → 4,068 (+3,995), both above target.
- 📅 Late October / early November 2026 (estimated) — Q3 2026 earnings, the next major catalyst
- 📅 June 17, 2027 — expiration of this collar
Disclaimer: Options trading involves substantial risk of loss and is not suitable for all investors. This analysis is for educational purposes only and is not financial advice. The trader behind this collar may have portfolio considerations — existing stock, tax positioning, other option holdings — that have nothing to do with your own situation. Next-day open interest confirms both legs opened, but OPRA still cannot reveal the trader's identity, motive, or any underlying stock position this collar may be wrapped around. Always do your own research and consider consulting a licensed financial advisor before trading.
Last updated: July 30, 2026 — next-day OPRA open interest confirmed both collar legs as fresh opens: Jun-2027 $350 calls 839 → 4,801 (+3,962) and Jun-2027 $110 puts 73 → 4,068 (+3,995), both above the published targets. Confidence upgraded from MEDIUM to HIGH on both legs; no narrative change. Original publication: July 29, 2026.