🤝 CC $2.08M Bull Call Spread — Bought Into a 17.6% Earnings Crash, Not Ahead of It
📅 August 5, 2026 | 🔥 Unusual Activity Detected
🎯 The Quick Take
At 14:14:19 ET, a trader put on a 16,666-lot September $14/$17 bull call spread on Chemours for a $2,083,250 net debit — bought the September $14 calls, sold the September $17 calls against them, both legs the exact same size. Both strikes were proven brand-new positions: the $14 strike had zero prior open interest and the $17 strike only 255. The twist is the timing — Chemours reported earnings yesterday, and the stock is down ≈17.6% today to ≈$14.77-14.93. This spread was bought into the selloff, not ahead of the print, and it needs the stock to recover just +2.1% to break even.
🏢 About Chemours (CC)
The Chemours Company (NYSE: CC) is a specialty chemicals producer spun off from DuPont in 2015. It runs three core businesses: Titanium Technologies (TT), the world's largest titanium dioxide (TiO2) pigment producer used in paints, plastics and paper; Thermal & Specialized Solutions (TSS), refrigerants and fluorochemicals built around the Opteon low-GWP refrigerant line; and Advanced Performance Materials (APM), fluoropolymers like Teflon used in industrial and semiconductor applications. Market cap sits at ≈$2.22B — a small-cap, per StockAnalysis — with a 52-week range of $10.44 – $28.67 and a 52-week price change of +22.03%, beta 1.43 (StockAnalysis).
💰 The Option Flow Breakdown
📊 What Just Happened — Full Trade Table
Spot at print: $14.93
| Time (ET) | Buy/Sell | Call/Put | Expiration | Strike | Size | Option Price | Premium | Volume | Prior OI | Delta | Spot | Option Symbol |
|---|---|---|---|---|---|---|---|---|---|---|---|---|
| 14:14:19 | BUY | CALL | 2026-09-18 | $14 | 16,666 | $1.91 | $3,183,206 paid | 17,000 | 0 ✅ | +0.653 | $14.93 | CC20260918C14 |
| 14:14:19 | SELL | CALL | 2026-09-18 | $17 | 16,666 | $0.66 | $1,099,956 collected | 17,000 | 255 ✅ | +0.337 | $14.93 | CC20260918C17 |
Net: $2,083,250 debit paid — that's the actual capital at risk, not the $3.18M headline on the long leg alone. Gross premium double-counts a spread; the net debit is what this trader can lose.
Mechanism — proven from the tape, not inferred: both legs printed at the same millisecond as a multi-leg cross — a broker matched a known buyer and known seller for the whole two-leg package and printed it off the open order book in one shot. There's a known counterparty on the other side of this trade; it's negotiated position management, not an aggressive sweep lifting offers in the lit market. Both legs share the identical 16,666-contract size, which is exactly what you'd expect from a spread executed as a single package rather than two independent trades that happened to coincide.
✅ RESOLVED — Both Legs Opened, Though Only ≈81% of the Size Became New Open Interest
Updated 2026-08-06 pre-market. The ≈06:30 ET OPRA open-interest snapshot (reflecting the August 5 close) has published.
| Leg | Baseline OI (Aug-5 snap) | Predicted | Actual (Aug-6 snap) | Δ | Print size | Δ as % of print | Day vol | Verdict |
|---|---|---|---|---|---|---|---|---|
| Sep-18 $14 C (bought 16,666) | 0 | ≈16,700 | 13,540 | +13,540 | 16,666 | ≈+81.2% | 16,693 | ✅ OPEN (BTO) |
| Sep-18 $17 C (sold 16,666) | 255 | ≈16,900 | 13,687 | +13,432 | 16,666 | ≈+80.6% | 16,695 | ✅ OPEN (STO) |
The open/close read was never in doubt, and it held. The $14 strike had literally zero contracts outstanding beforehand; it now has 13,540. You cannot close a position that does not exist. The bull call spread is confirmed as an entirely new position, not a roll or an unwind.
But the size came in below our prediction, and that is worth being straight about. We said the $14 line should land near ≈16,700 and the $17 line near ≈16,900. They landed at 13,540 and 13,687 — roughly 3,100 contracts short on each leg, about 19% of the print. We flagged this exact possibility on the day: "if tomorrow's numbers land meaningfully below those marks, that would suggest some of today's volume crossed against existing same-day orders rather than becoming net-new OI." That is what happened. Day volume at each strike (16,693 and 16,695) closely matched the print, so roughly one contract in five was matched against a counterparty who was closing rather than opening.
What that changes, and what it doesn't. The structure, direction and economics are unchanged — this is a bull call spread that opened. What is slightly smaller than the headline is the net new position the market as a whole is carrying: ≈13,500 spreads rather than ≈16,666. It is a reminder that even a print against near-zero open interest does not always convert one-for-one into new open interest.
🤓 What This Actually Means — Plain English
This is a textbook long bull call spread, and it's really two separate order types stitched into one package:
- Leg 1 — BTO (Buy to Open) the $14 call. The trader paid $3,183,206 for the right to buy CC at $14 anytime through September 18. Proven fresh position — the strike had zero open interest before this print.
- Leg 2 — STO (Sell to Open) the $17 call. The trader collected $1,099,956 by selling someone else the right to buy CC from them at $17 through the same date. Also a fresh, brand-new short position — 16,666 new contracts against a base of only 255.
Putting them together: buying the $14 call outright would have cost the full $3,183,206. By simultaneously selling the $17 call against it, the trader cut that cost by ≈34.6%, bringing the total down to the $2,083,250 actually paid. That's the core trade-off of a vertical spread — you give up any profit above $17 (where the short call caps the payout) in exchange for a much cheaper ticket to the same directional bet.
The math on that trade-off: max value of the spread at expiration is ≈$4,999,800 (the $3 strike width × 16,666 contracts × 100), so max profit is ≈$2,916,550 if CC closes at or above $17 on September 18 — a ≈1.4:1 reward-to-risk ratio on the $2,083,250 paid. Max loss is the full $2,083,250 if CC is below $14 at expiration — a 100% loss of the premium, same downside math as a straight long call. Breakeven is $15.25, just +2.1% above the $14.93 print spot. Full max profit requires CC to climb +13.9% to $17 by expiration.
One more way to size this up: on a delta basis, the long $14 call carries +0.653 delta and the short $17 call carries +0.337 delta. Multiplying each by 16,666 contracts × 100 gives roughly +1,088,300 shares of long exposure from the long leg against ≈+561,600 shares of exposure sold away on the short leg — netting to a package delta of ≈+526,479 shares equivalent, still solidly directional-bullish, just a fraction of what a naked $14 call alone would carry.
🎪 The Catalyst Context
Already happened
Chemours reported Q2 2026 on August 4 and the stock is down ≈17.62% today to ≈$14.77, according to StockAnalysis — despite adjusted EBITDA of $247M that management said came in "above expectations" on "disciplined execution and pricing actions," per StockTitan. Net sales were $1.59B, −1% YoY. The disconnect between the EBITDA beat and the sharp drop is the GAAP line: a $274M net loss (−$1.81/share) for the quarter, adjusted EPS of $0.42, and free cash flow of $114M (+128% YoY) (StockTitan). Segment detail: TSS (refrigerants) delivered $213M adjusted EBITDA (+3% YoY), TT (titanium dioxide) benefited from ≈5% YoY TiO2 price gains, and APM Performance Solutions grew +8% YoY. Management guided FY2026 net sales growth of 1–5% and adjusted EBITDA of $775–$825M. A stock falling 17.6% on a reported EBITDA beat is itself the headline here — the market is pricing the balance sheet, not the quarter.
Separately, Chemours reached a June 24, 2026 agreement with the EPA resolving PFAS discharge claims: a $22.5M civil penalty paid over three years plus $90M in mitigation projects over 15 years (StockTitan) — a now-quantified, modest obligation on a liability that used to be open-ended.
Upcoming
- Q3 2026 earnings — ESTIMATED for early November 2026, inferred from quarterly cadence off the August 4 print; no company-confirmed date has been located (StockTitan). That date falls after this spread's September 18 expiration — this position does not carry through another earnings print.
- Titanium dioxide pricing trajectory — the ≈5% YoY TiO2 price gain that drove the Q2 beat is the swing factor for the whole equity into the back half; a rollover here would remove the only visible margin lever against a top line that's already contracting.
- Post-print analyst reset — every rating on file, including Mizuho's $25 target (July 1) and Zacks' upgrade to Strong Buy (July 21), was set before the August 4 print and today's drop (MarketBeat). The $23.80 average target (range $17–$30) is now ≈61% above spot — but treat every one of those numbers as stale until the desks re-rate off the actual quarter.
📈 Technical Setup / Chart Check-Up
YTD Chart
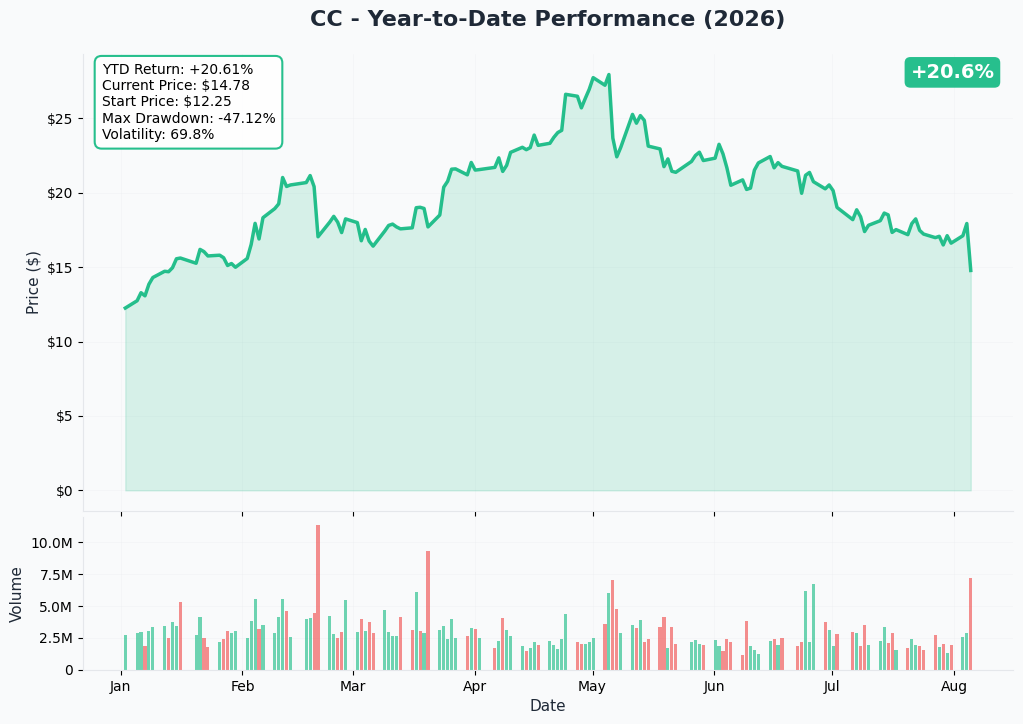
The chart shows the +22% 52-week climb giving way to today's cliff — a 17.6% single-day drop is a violent break from the trend, not a slow bleed.
Gamma-Based Support & Resistance
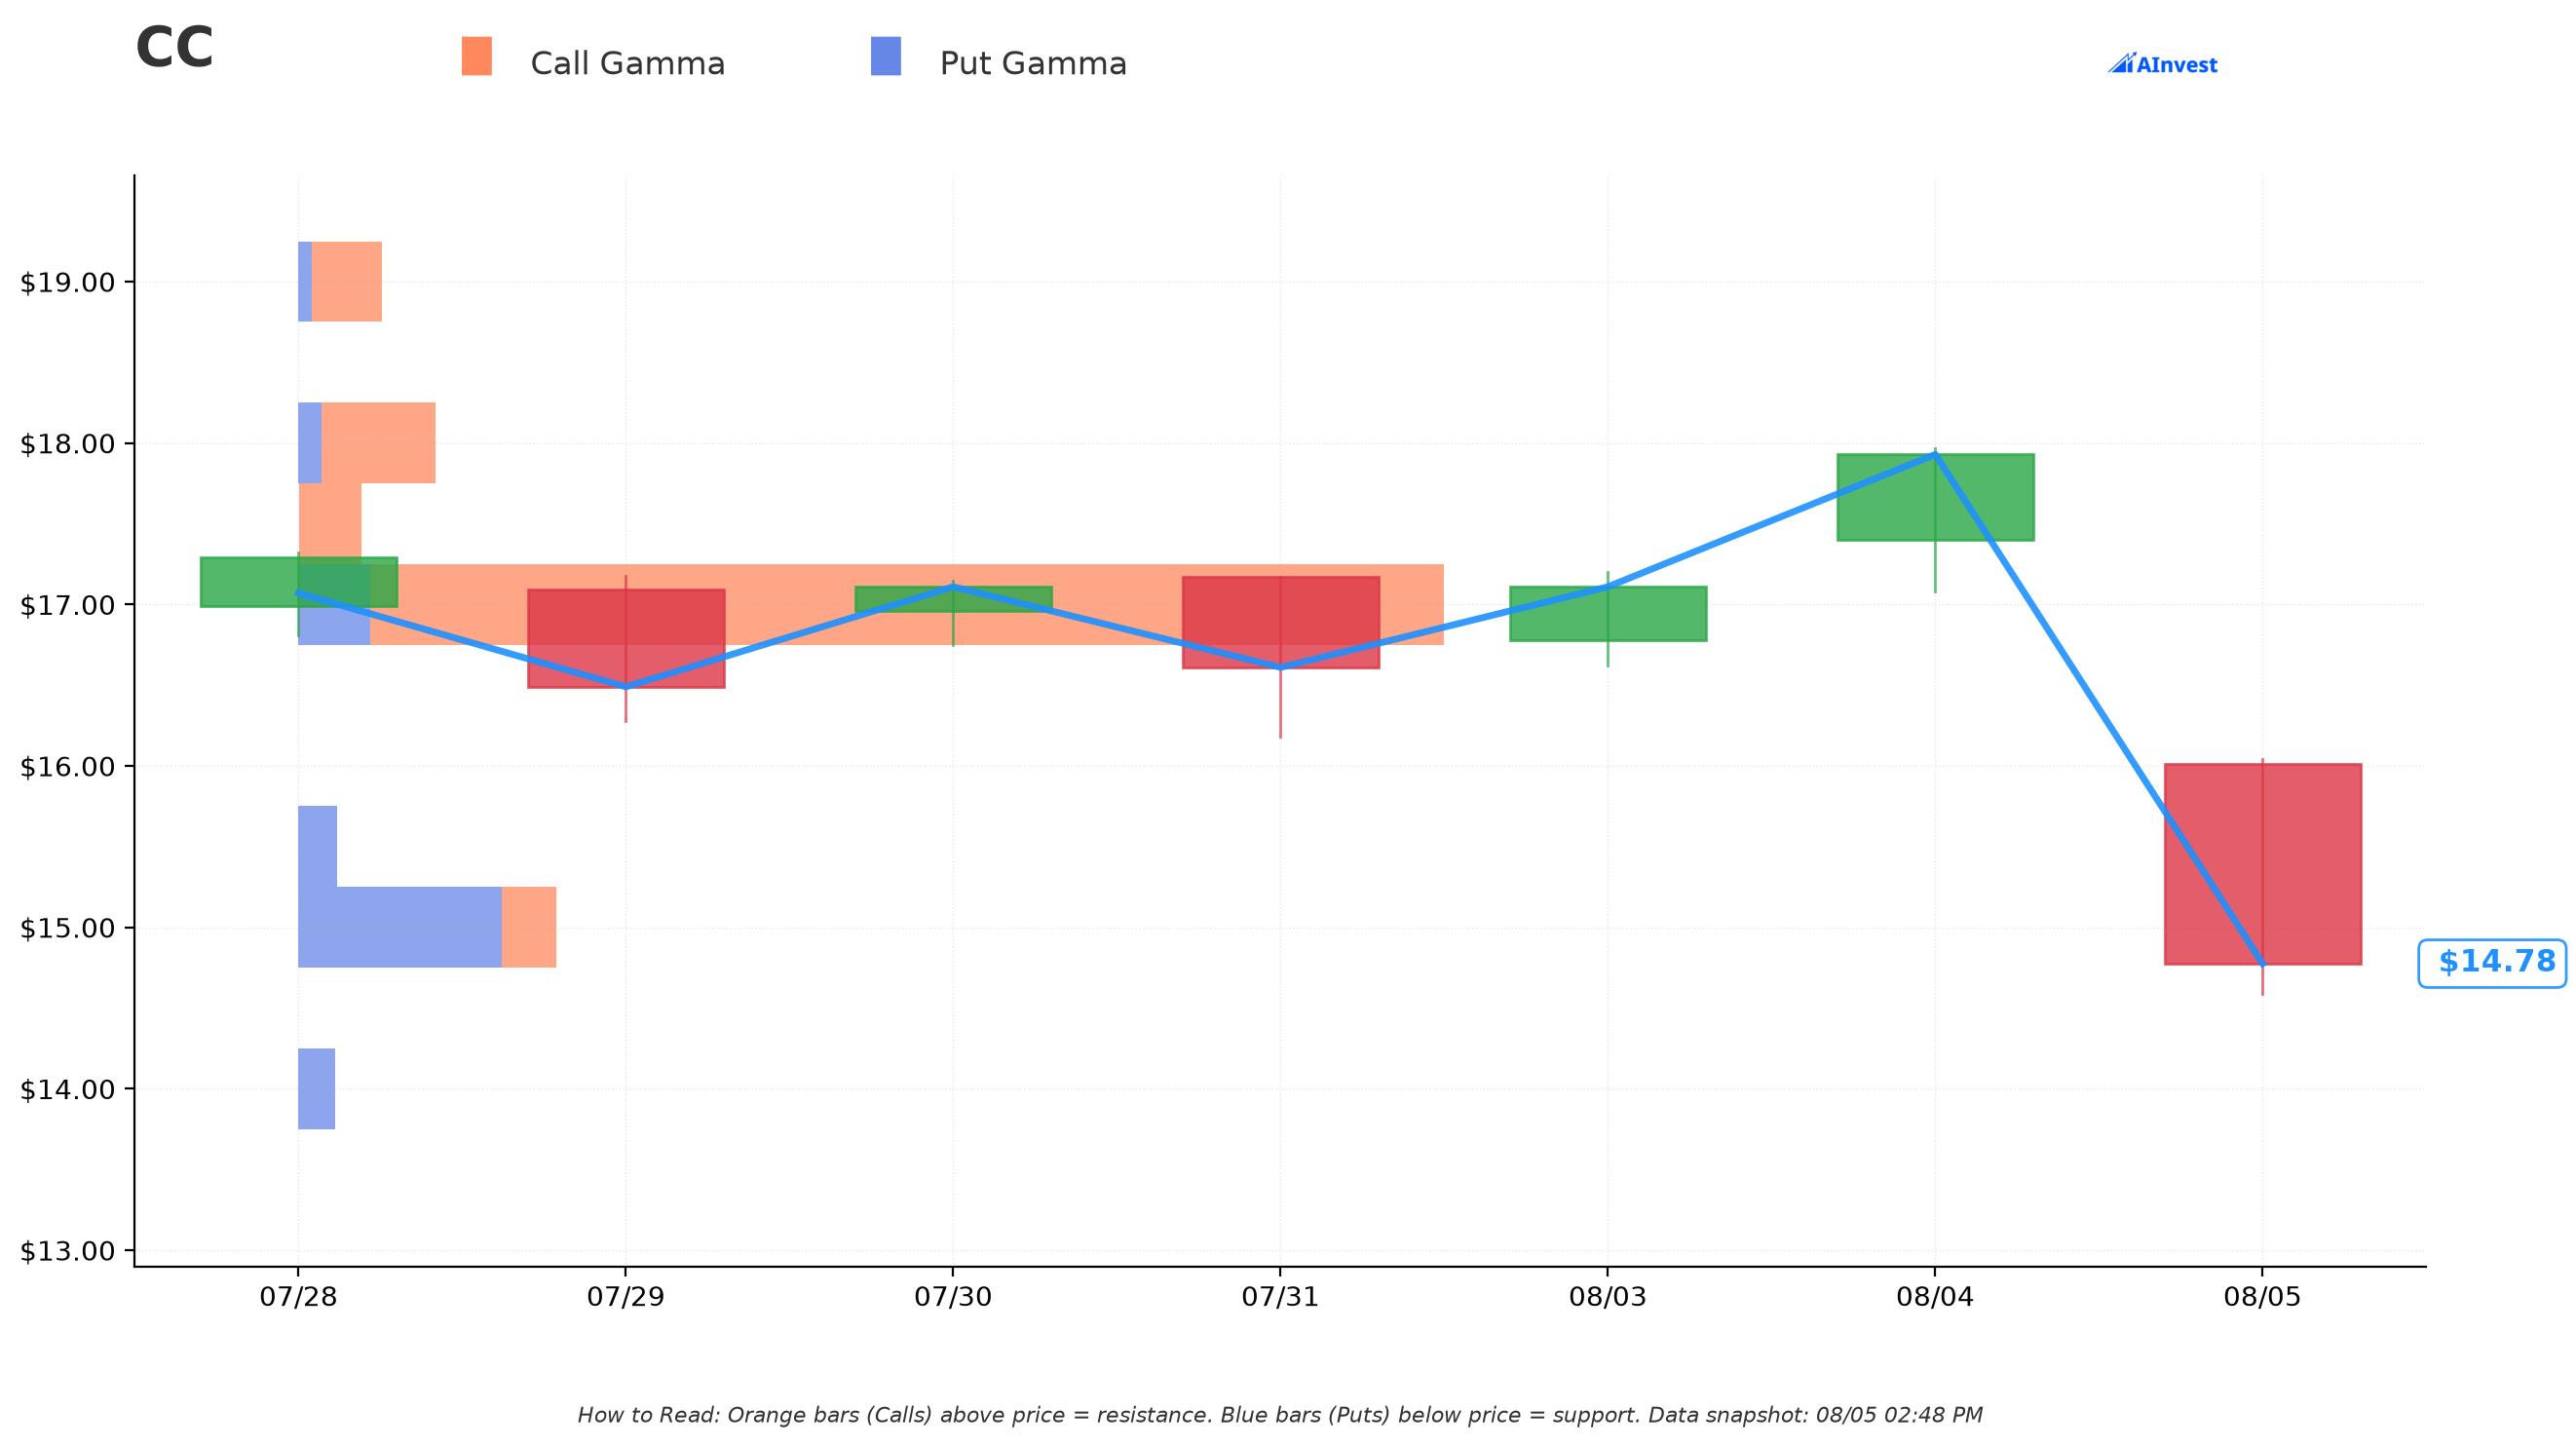
Reading dealer gamma exposure by strike (spot ≈$14.79 at the gamma snapshot):
- 🟠 Call Wall (resistance): $17 — by far the largest gamma concentration on the entire chain, with total gamma exposure of ≈3.29 and a heavily call-dominated net reading of ≈+2.88 — roughly 14.9% above spot. Worth noting directly: this is the exact strike the trader sold in this spread. The dealer hedging wall and the short leg of the trade sit at the same price.
- 🔵 Nearest large cluster: $15 — total gamma ≈0.74, but net negative (≈−0.43, put-heavy), sitting just ≈1.4% above spot. This is the closest big gamma zone to today's price and could act as a short-term pin or friction point on the way toward $17.
- ⚠️ Support below spot is thin. No strike below $14.79 carries comparable size — the largest is $12 (total gamma ≈0.22, put-dominated) roughly 18.9% below spot, with $14 itself only ≈0.11. In plain terms: there isn't a strong dealer-hedging floor sitting close underneath the current price. If the stock keeps sliding, gamma-driven support doesn't show up again until well lower.
None of the levels below spot give this spread much of a dealer-hedging cushion — the setup leans on the stock stabilizing and grinding higher into a well-defined overhead wall, not on a nearby floor catching it.
Implied Move
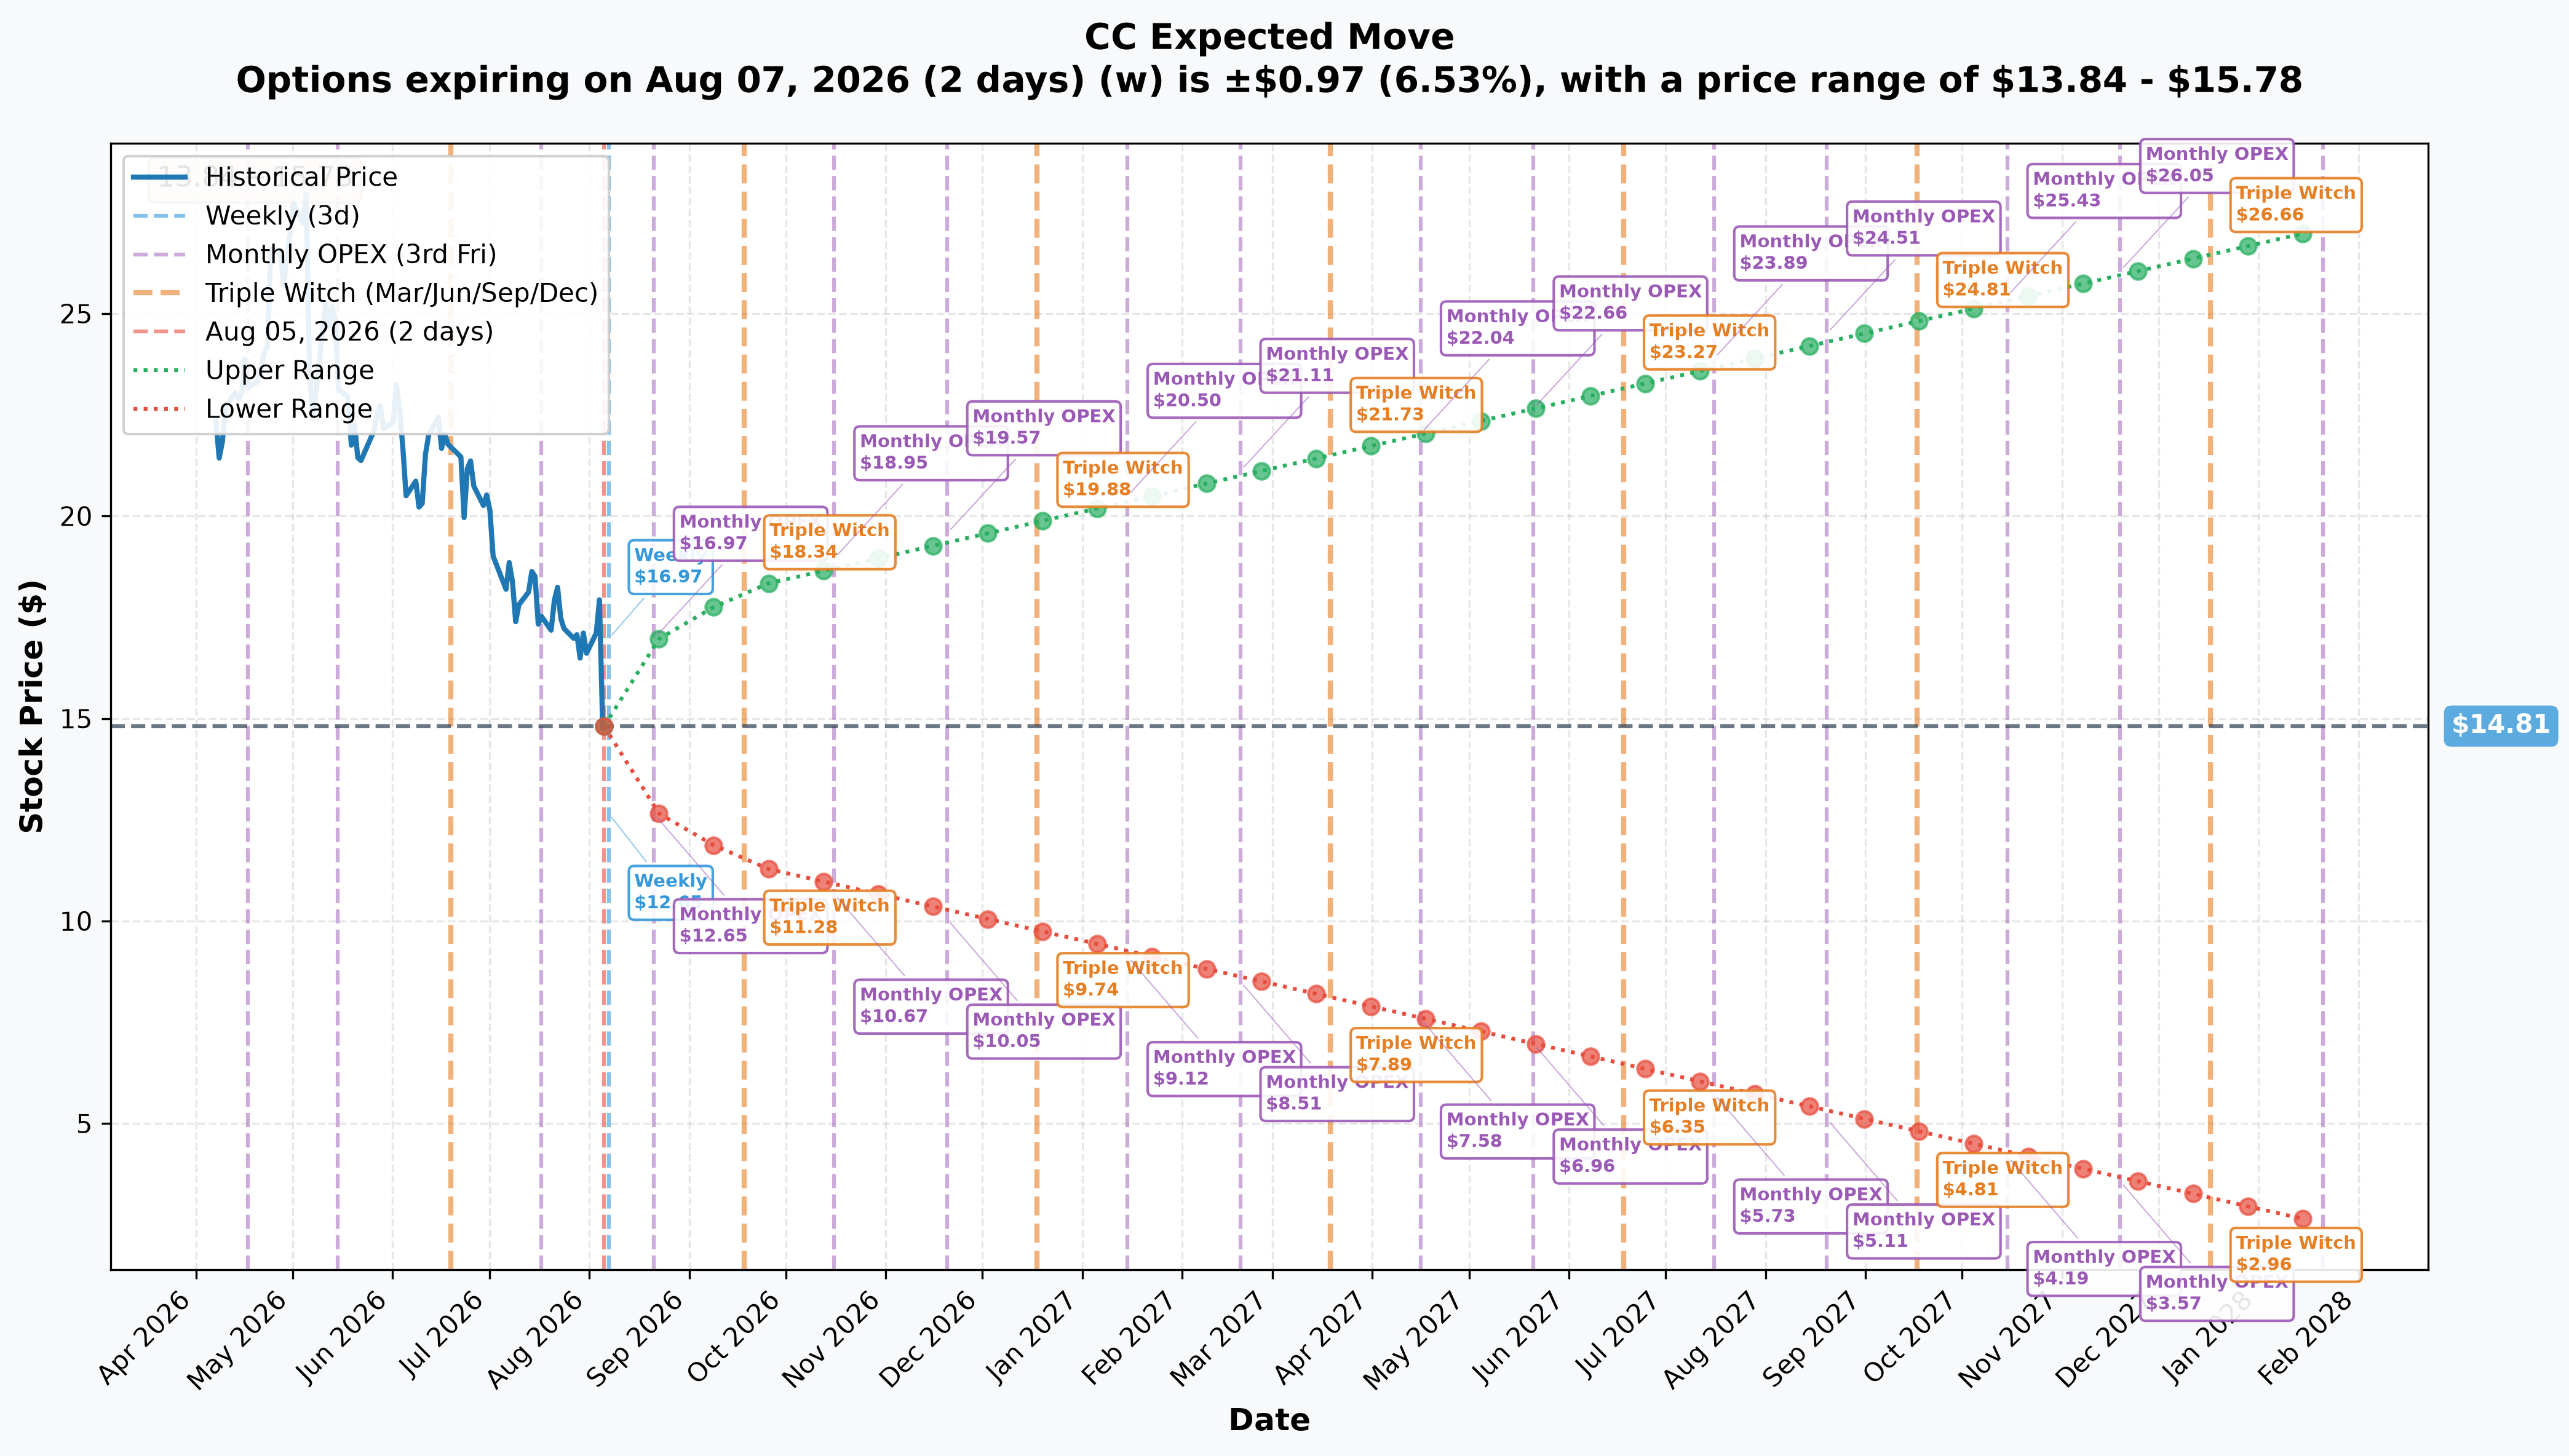
Straight from the options market's own pricing (spot $14.81 at the snapshot):
| Window | Expiry | DTE | Implied Move | Range |
|---|---|---|---|---|
| Weekly | 2026-08-07 | 2 | ≈6.53% (±$0.97) | $13.84 – $15.78 |
| Monthly OPEX | 2026-08-21 | 16 | ≈14.28% (±$2.11) | $12.70 – $16.92 |
| Quarterly / Triple Witch | 2026-09-18 | 44 | ≈22.94% (±$3.40) | $11.41 – $18.21 |
| Yearly LEAPS | 2028-01-21 | 534 | ≈82.96% (±$12.29) | $2.52 – $27.10 |
The quarterly window is the one that matters here — it's the exact same September 18 expiration as this spread. The market-implied range of $11.41 – $18.21 comfortably contains both strikes: the $15.25 breakeven sits well inside the cone, and the $17 short strike where max profit caps out is inside the upper bound too, with about $1.21 of room before the implied move's ceiling. In other words, this spread's full payout zone isn't a moonshot relative to what the options market itself is pricing for a ≈6-week window — it's asking for roughly the middle of the priced range, not the extreme tail.
🎲 Price Targets & Scenarios
Combining the gamma levels, the implied move, and the catalyst calendar:
- Bull case: CC stabilizes above the thin support zone, works through the $15 gamma cluster, and grinds toward the $17 call wall by mid-September — inside the market's own ≈$11.41–$18.21 implied-move cone. That's the scenario that pays this spread its full ≈$2,916,550.
- Base case: CC chops somewhere in the $13–$16 range as the market digests the earnings miss-on-price-action versus beat-on-EBITDA disconnect, with no fresh catalyst until the estimated early-November Q3 print (which falls after this spread expires). Breakeven at $15.25 is a modest ask relative to this range.
- Bear case: the leverage story dominates — 18.4x debt/EBITDA against a $2.22B market cap keeps the stock under pressure, TiO2 pricing rolls over, or fresh PFAS headlines reopen the liability tail. With gamma support thin below spot, a slide could extend without much dealer-hedging friction to slow it, taking the spread to its full $2,083,250 loss.
💡 Trading Ideas
🛡️ Conservative
Watch, don't replicate. This spread's own breakeven (+2.1%) and target ($17, +13.9%) are already defined-risk and modest relative to the implied-move cone — but the underlying is a levered small-cap that just dropped 17.6% in one session. Let the next few sessions show whether the selloff is stabilizing before sizing anything.
⚖️ Balanced
A smaller-size version of the same structure — a defined-risk $14/$17 (or similar width) September call spread — caps both cost and loss at a known number, which matters in a name carrying 18.4x debt/EBITDA. The reward-to-risk skew here (≈1.4:1) is a fair setup for a name recovering off an earnings gap, not a lottery ticket.
🚀 Aggressive
A naked long call captures more upside past $17 than this spread does, at roughly 50% more cost for the $14 strike alone ($3,183,206 versus $2,083,250 for the spread) — appropriate only for someone with real conviction the TiO2 pricing trend and FY26 guide hold, and willing to eat a full loss if the leverage story wins instead.
👥 Four Ways to Read This
🚀 YOLO Trader: Someone just committed over $2M to a bet that a stock down 17.6% today recovers to at least $15.25 by mid-September. That's not a coin-flip size position — it's calculated, capped-risk directional conviction right into the worst of the selloff. Worth watching, not worth blindly copying at this size.
📊 Swing Trader: The $15 gamma cluster and $17 call wall are your levels to watch over the next few sessions. If CC can stabilize above the thin support zone and start working toward $15, this spread's math starts looking live; a break further down into the gamma-empty zone below $14 is the invalidation signal.
💰 Premium Collector: The short $17 call financed ≈34.6% of the long leg's cost — that's the mechanism, not a stand-alone premium-selling play. If you're studying this as a template, note the short strike sits directly on top of the largest gamma wall on the board, which is a deliberate choice, not a coincidence.
🌱 Beginner: "Bull call spread" sounds complicated, but it's just two trades bundled together — buy a cheaper call, sell a more expensive-strike call against it to knock down the cost, and cap your profit at the strike you sold. Here that trade-off cut the cost by over a third in exchange for giving up anything above $17. The catch: this spread was bought into a stock that just fell 17.6% in a single day on a company carrying real debt — read the risk section below before treating this as a simple "someone's bullish" signal.
⚠️ Honest Risk & Limits — What the Tape Cannot Prove
- Leverage is the dominant risk in this name. Chemours carries $4.06B in debt against $671M in cash — a ≈18.4x debt-to-EBITDA ratio — against a $2.22B market cap. At that ratio, the enterprise is effectively majority-creditor-owned, and any deterioration in EBITDA has an outsized effect on the equity relative to a name with a clean balance sheet.
- This spread was bought into a violent, single-day 17.6% drop, not ahead of a catalyst. That timing cuts both ways — it could reflect genuine conviction the selloff is overdone, or it could be a falling-knife entry with no edge over anyone else guessing at the bottom.
- GAAP unprofitability. The company posted a −$274M net loss this quarter; the entire bullish EBITDA-beat narrative rests on adjusted, non-GAAP figures.
- All published analyst targets are stale. The $23.80 average target and every individual rating on file predate the August 4 print and today's move — none of them reflect the new information.
- Short interest data is pre-print and internally inconsistent. Sources agree on the 11.68M shares (≈7.84% of float, ≈4.6 days to cover) level as of a July 15 settlement date, but disagree on whether short interest rose or fell month-over-month — and none of it reflects post-earnings positioning.
- PFAS liability is only partially bounded. The June 24 EPA agreement resolved discharge claims with a quantified $22.5M penalty plus $90M mitigation — it does not close out the entire PFAS exposure, and further claims remain a tail risk.
- No visibility into counterparty, broker, or customer identity on either side of this cross, and no visibility into any offsetting hedge that may exist off the options tape.
- Q3 earnings date (≈early November 2026) is an estimate, not a company-confirmed date.
- Gamma and implied-move levels are dynamic and will shift as the tape develops through September.
Disclaimer: Options trading involves substantial risk and is not suitable for all investors. This analysis is for informational purposes only and does not constitute investment advice. Past performance and options flow do not guarantee future results. Always do your own research and consider your risk tolerance before trading.
Last updated: 2026-08-06 (pre-market) — next-day OPRA open interest confirmed both legs as opening ($14 call 0 → 13,540; $17 call 255 → 13,687). Roughly 19% of the printed size did not convert into new open interest, slightly below the predicted marks; the resolution section documents the shortfall.