🌍 EFA $4.3M Buy-Write — A Desk Collects Income on Developed-Market Equities Ahead of the BoJ
📅 June 15, 2026 | 🔥 Unusual Activity Detected
✅ Updated 2026-06-16: Next-day OPRA OI confirms a fresh sell-to-open — the Jun-30 $100 call OI resolved to 8,817 (≈ the 8,800 sold). This is a genuine new buy-write / covered-call short (income/neutral). (The 06-15 morning snapshot briefly read 0, an apparent feed glitch; the resolving 8,817 is the clean read.)
🎯 The Quick Take
At 10:00:00 this morning, a desk sold 8,810 deep-ITM $100 calls against a large EFA stock position — collecting ≈$4.3M in upfront premium in a textbook buy-write / covered call. This is not a bearish bet and not a directional short — it is an income-and-yield overlay on a stock the desk already owns (or just bought). The ITM strike caps the upside to just below current prices and says plainly: "We'll take the premium, we're OK being called out near $100, and we don't need to squeeze every last drop out of this rally into the BoJ decision on June 16." With the ECB having just hiked rates for the first time in nearly three years and the Bank of Japan on deck tomorrow, rich volatility premium is exactly the right time to be a seller.
📊 ETF Overview
EFA — iShares MSCI EAFE ETF is the largest and most-traded ETF tracking developed-market equities outside the US and Canada:
- Net Assets: ≈$68.6 billion — one of the biggest equity ETFs on the planet
- Index: MSCI EAFE (Europe, Australasia, Far East) — ≈1,000+ large and mid-cap stocks
- Top Country Weights: Japan ≈23% · UK ≈15% · France ≈10% · Switzerland ≈9% · Germany ≈9%
- Trailing Dividend Yield: ≈2.4% — about 100 bps above typical US equity funds, making buy-writes especially attractive as an income layer
- 2026 YTD: ≈+8%, with developed-international leading US large-caps for most of the year on cheaper valuations and record international ETF inflows
Translation for regular folks: EFA is the go-to ETF if you want broad exposure to big European, Japanese, Australian, and other developed-market companies — think Toyota, Nestlé, HSBC, Samsung. It's not exotic; it's the global blue-chip index that isn't the S&P 500.
💰 The Option Flow Breakdown
The Tape — June 15, 2026 @ 10:00:00: 🤝 Single-Leg Block Cross with Paired Stock Leg (Buy-Write)
| Time | Buy/Sell | Call/Put | Expiration | Premium | Strike | Volume | OI | Size | Spot | Option Price | Option Symbol |
|---|---|---|---|---|---|---|---|---|---|---|---|
| 10:00:00 | SELL | CALL | 2026-06-30 | ≈$4.3M | $100 | 8,800 | 0 | 8,810 | $104.37 | $4.84 | EFA20260630C100 |
Flow type: 🤝 Block Cross — Buy-Write / Covered Call Structure
The option tape carried a paired stock leg alongside this call sale — the classic signature of a buy-write: the desk holds EFA shares (or bought them simultaneously) and sold the Jun-30 $100 calls against that stock position for ≈$4.84 per share. Total income collected: ≈$4.3M across 8,810 contracts (each contract = 100 shares).
The $100 strike is in-the-money — EFA is trading at $104.37, which means the strike is ≈$4.37 below the current price. Selling an ITM covered call is a deliberately defensive, income-first setup: the desk is saying "we're happy to be called out of our shares near $100, and we want the premium today."
This is NOT a short call speculation. No margin-based naked short. This is a stock-plus-short-call package — the most conservative options structure a long-stock investor can run.
Size check: OI was 0 before this print. A size of 8,810 on zero OI is definitively a fresh open — these contracts did not exist before today. The income position was opened from scratch this morning.
✅ RESOLVED — Next-Day OI Confirms a Fresh Sell-to-Open (2026-06-16)
| Leg | Pre-print baseline | Resolving (EOD 2026-06-15) | Δ | Verdict |
|---|---|---|---|---|
| Jun-30 $100C (sell) | ≈9,053 (EOD 2026-06-11; 06-15 snap read 0) | 8,817 | n/a* | OPEN — sell-to-open (STO) confirmed |
The next-morning OPRA snapshot confirms a fresh short: resolving open interest of 8,817 closely matches the 8,800 calls sold, confirming a sell-to-open — the short-call leg of a buy-write / covered call. *One data caveat handled transparently: the 2026-06-15 morning OI snapshot briefly read 0 (an apparent feed anomaly; the strike held ≈9,053 at EOD 2026-06-11), so the clean signal here is the resolving 8,817, which equals the size sold. This is an income / neutral overwrite, not a directional bet.
🤓 What This Actually Means — Plain English
A buy-write (also called a covered call) is the most straightforward income strategy in the options playbook. Here is the plain-English version:
- The desk owns EFA shares at ≈$104.37.
- They sold someone else the right to buy those shares at $100 anytime before June 30.
- For granting that right, they collected $4.84 per share — that's ≈$4.3M in upfront cash on 8,810 contracts (881,000 shares).
Now here is the catch: because the strike ($100) is below the current share price ($104.37), the shares are almost certain to be called away unless EFA falls below $100 before expiration. The desk is effectively locking in a sale price near $100, plus the $4.84 premium they already collected — for an effective exit price of ≈$104.84 per share (very close to today's spot).
Why would anyone do this? A few reasons that fit this trade perfectly:
- Collect rich premium now. The BoJ is deciding on rates tomorrow (June 16), the ECB just hiked last week, and volatility from the Iran/Hormuz oil shock has fattened option premiums. Elevated vol = fat premium = better time to sell calls.
- Lock in a near-current-price exit. At $104.37 spot and a ≈$104.84 effective exit, the desk is not giving up much upside — they are essentially agreeing to sell at today's price, plus ≈$4.84 of bonus income on top.
- Neutral-to-defensive view through June 30. The desk is NOT saying "EFA is going to fall." They are saying "we're not sure it's going meaningfully higher through the BoJ + end-of-quarter window, so let's monetize the optionality we're not going to use."
- Income overlay on a dividend payer. EFA already yields ≈2.4%. A buy-write stacks call-premium income on top of the dividend — the same logic behind ETF products like EFAA.
Order type: STO — Sell to Open. This is a fresh short call position against a long stock holding. The income ($4.3M) is the credit received, not the cost of the position.
What the desk CANNOT lose from here: More than the premium collected ($4.84/share) is already in the bank. If EFA collapses to zero (it won't, but theoretically), the loss comes from the stock leg, not the option — which is why this is called a "covered" call. The short call is fully covered by the long shares.
📈 Technical Setup / Chart Check-Up
YTD Performance
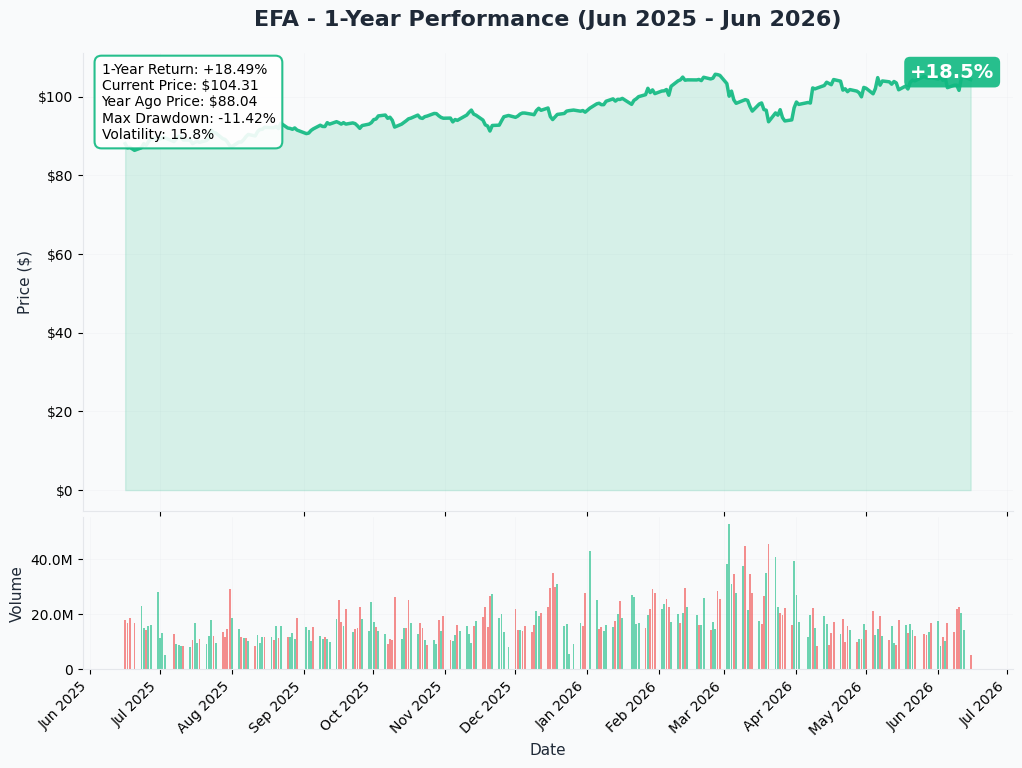
EFA has been one of the better-performing ETFs in 2026 — up ≈8% YTD — with developed-international stocks broadly outpacing the S&P 500 on cheaper valuations and record inflow momentum. Japan's Nikkei alone is up ≈31.8% YTD; the European Stoxx 600 set record highs earlier in 2026. EFA's ≈$104 current level reflects this strong run — and the fact that a desk is capping upside just below current prices by selling ITM calls suggests they see the near-term path as more sideways than up.
Key observations:
- 📈 ≈+8% YTD, with an ≈+33% trailing 12-month return as the international-rotation theme gathered steam
- 📊 The April high was driven by the record $51 billion of January international ETF inflows and dollar weakness (DXY fell ≈9% in 2025)
- ⚠️ The regime is shifting in June: ECB hiked, BoJ hiking tomorrow, dollar has firmed back near 100 on Iran safe-haven demand — which is exactly why an income overlay makes sense over a directional bet
Gamma-Based Support & Resistance
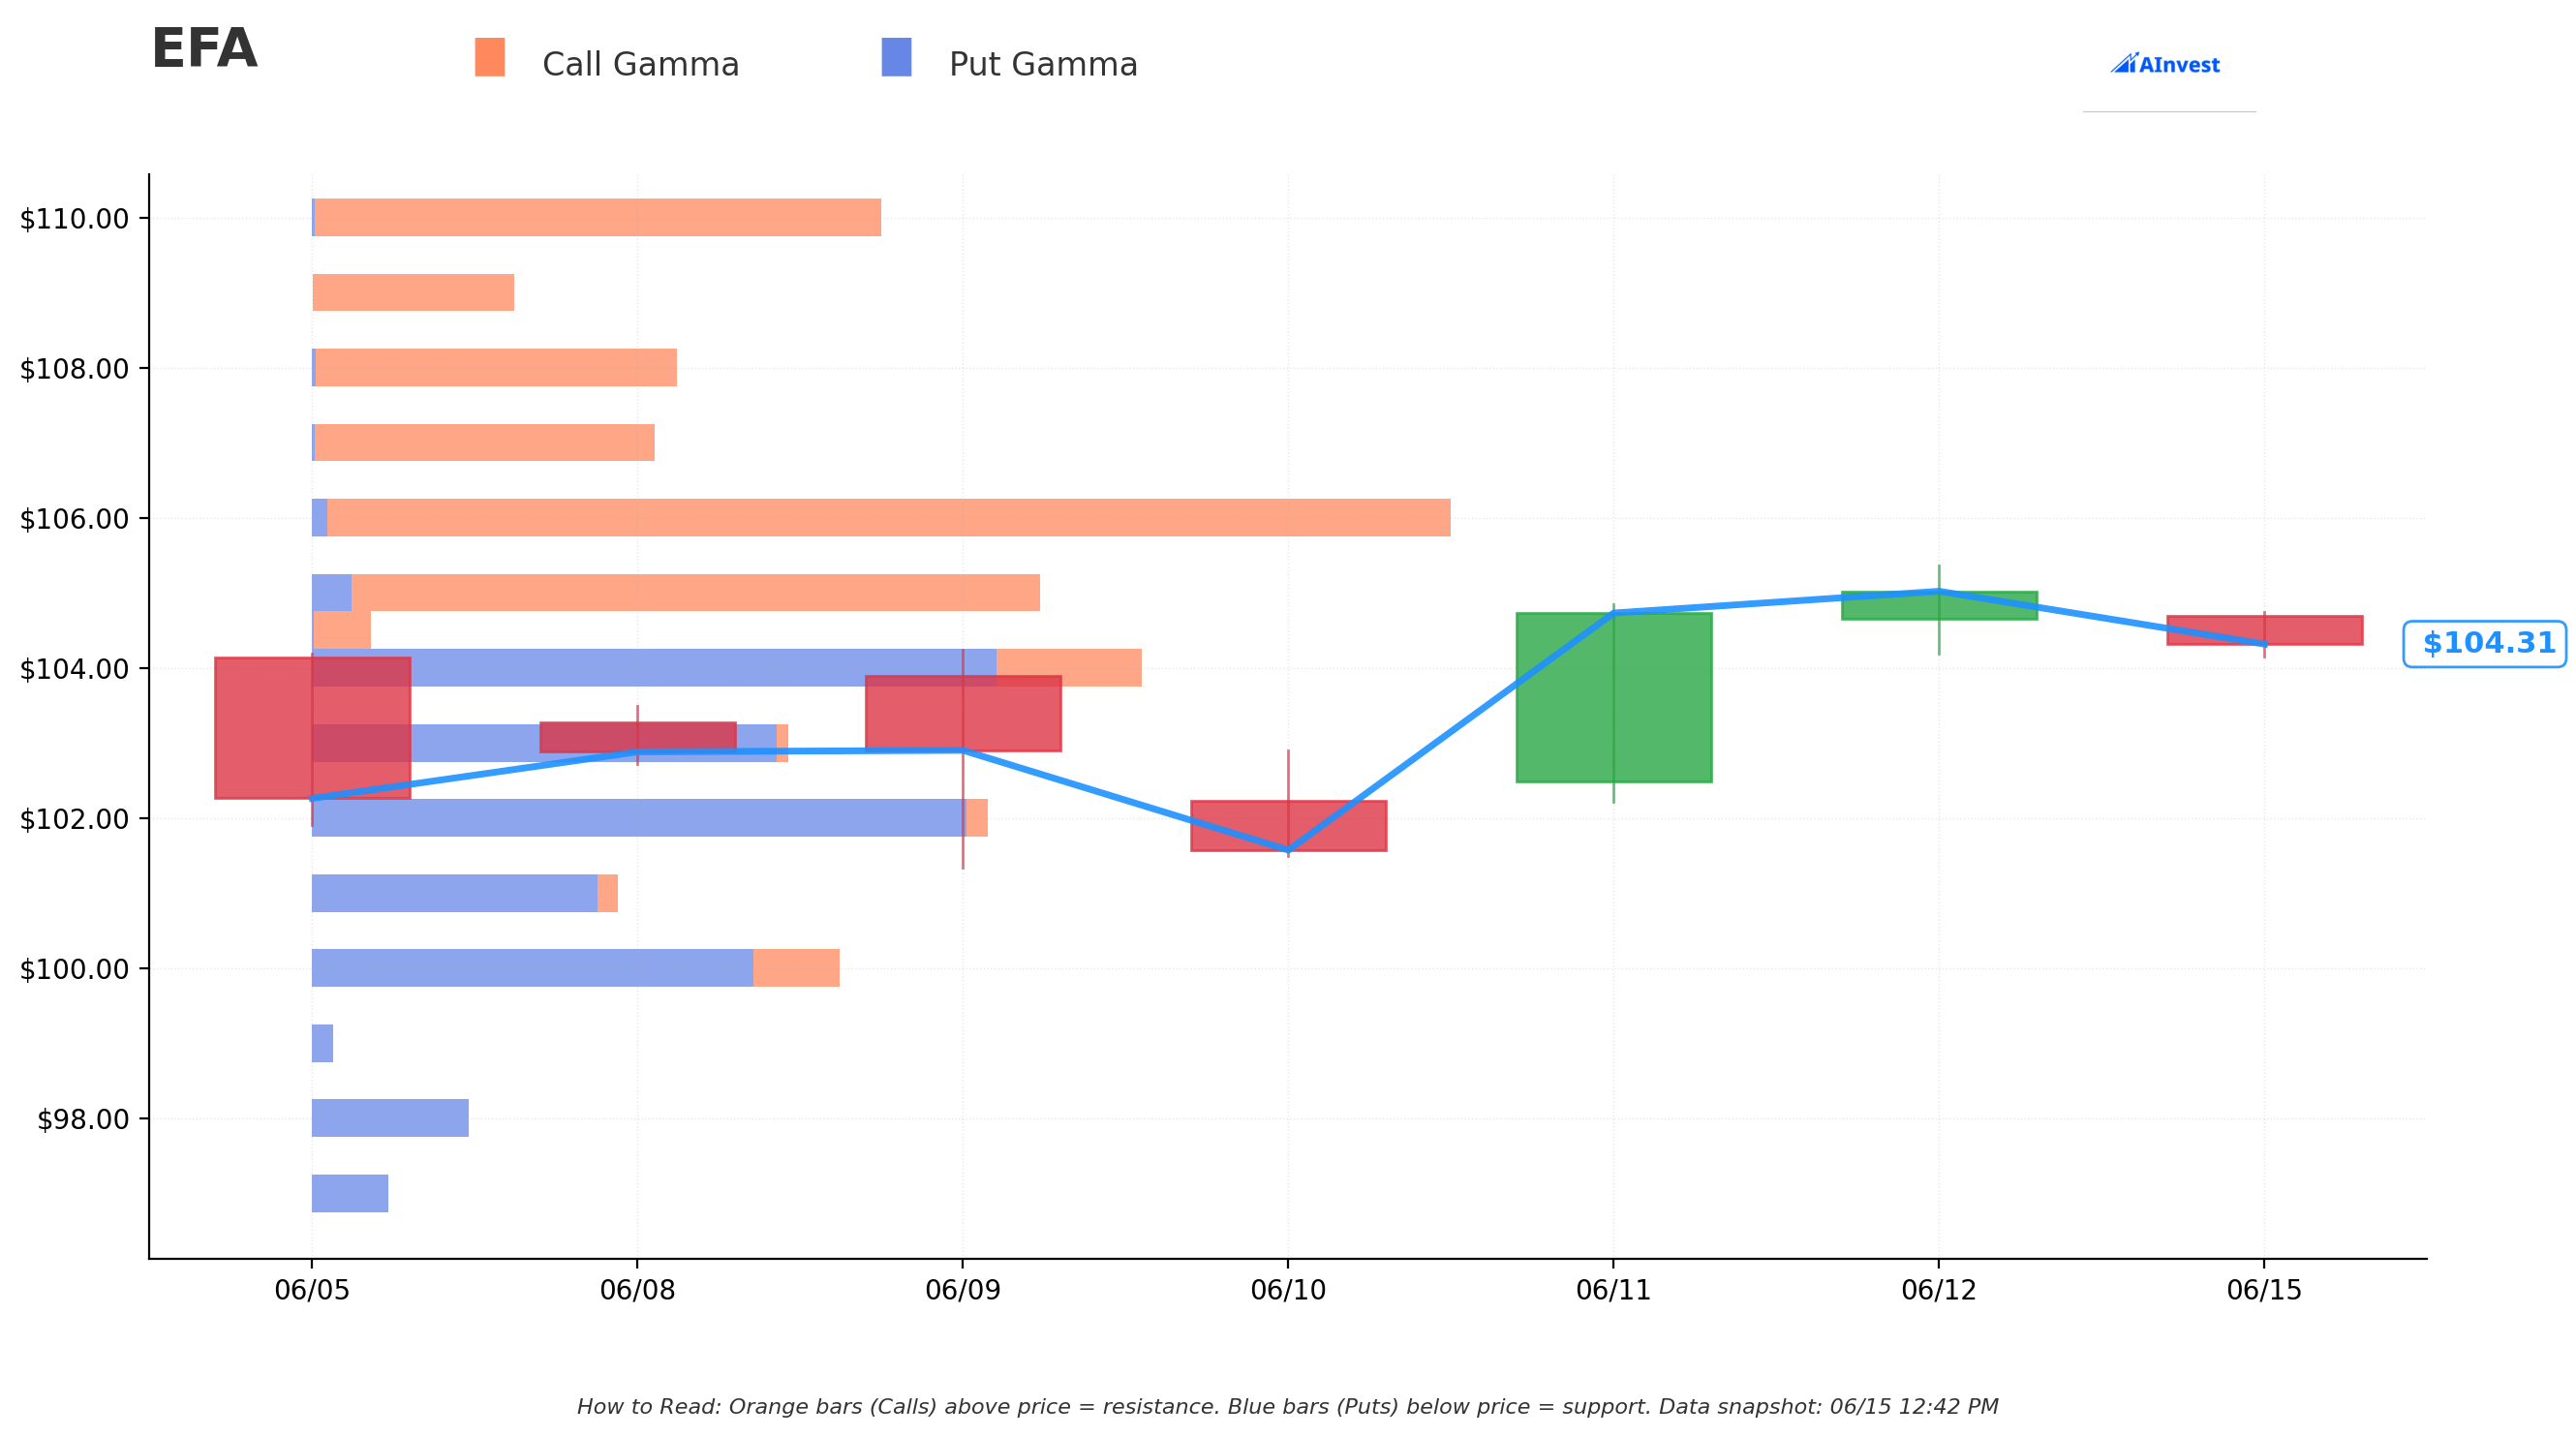
The gamma exposure map for EFA shows a clean, well-defined structure around current price:
🔵 Support Level (Put Gamma Below Price):
- $104 — Key Gamma Floor. The put gamma concentration at $104 is where market makers are naturally net-long gamma; they tend to buy dips to this level. For covered-call holders, $104 is the price to watch — if EFA dips here, the short $100 calls become deeper ITM and more likely to be exercised at expiry.
🟠 Resistance Level (Call Gamma Above Price):
- $106 — Call Gamma Wall. The $106 strike is the near-term mechanical ceiling based on options positioning. Getting above $106 would be bullish for directional traders, but for the covered-call seller, it's mostly irrelevant — by the time EFA could push to $106, the $100 short calls are already deep ITM and the position is effectively locked into the ≈$104.84 effective exit price.
Translation for the buy-write holder: You are in good shape as long as EFA stays above $100 through June 30. The $104 gamma floor provides natural support right near current price; the $106 ceiling shows the upside was already limited — which is exactly why the desk chose this structure.
Implied Move Analysis
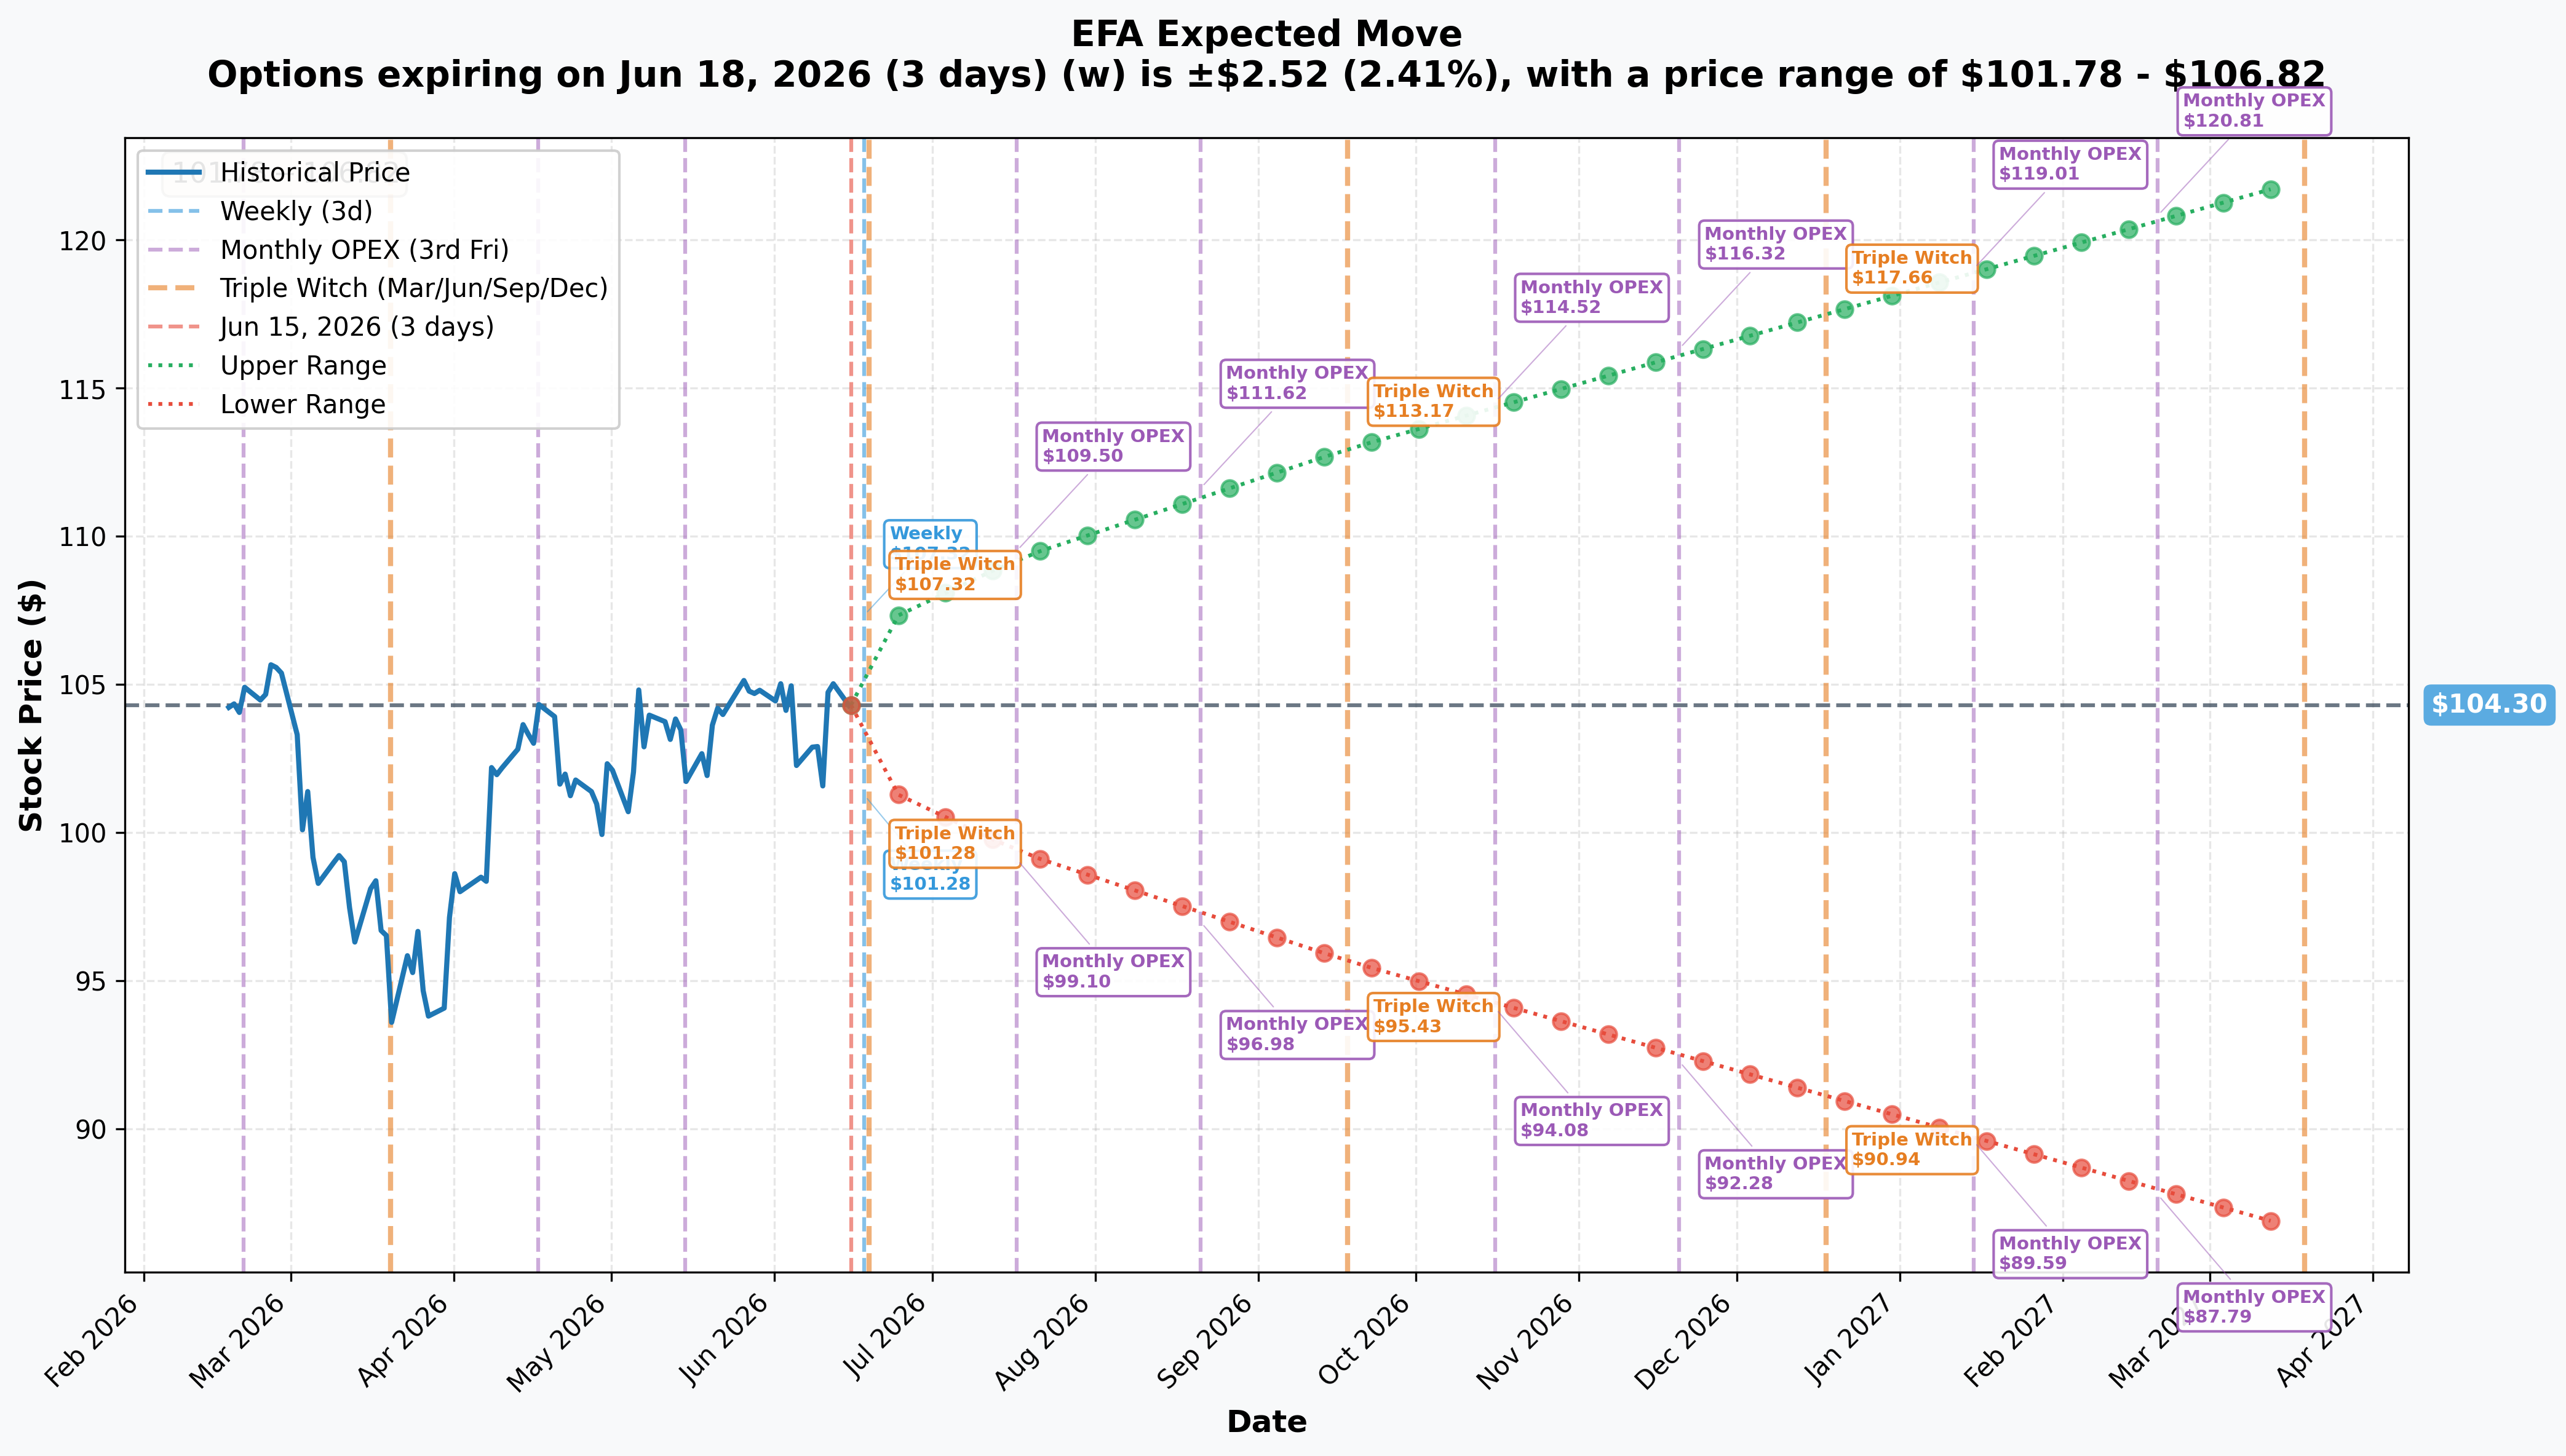
The options market is pricing these moves for EFA across key horizons:
- 📅 Monthly (exp 2026-07-17, ≈32 days): ±4.76% → Range $99.34 – $109.26
- 📅 Quarterly (exp 2026-09-18, ≈95 days): ±8.31% → Range $95.63 – $112.97
The monthly implied range of $99.34 – $109.26 is the most directly relevant. The Jun-30 $100 strike sits right at the lower bound of the options market's own one-month probability cone — confirming the covered-call setup is not panicking out of EFA; it is simply setting a ceiling for a portion of the position while collecting premium inside that cone.
The BoJ decision (tomorrow, June 16) is entirely inside the Jun-30 expiry. A hike that strengthens the yen is a translation tailwind for unhedged EFA — but the covered-call seller participates in that only up to the $100 effective exit price, with the ≈$4.84 premium already banked regardless.
🎪 Catalysts
Already Happened (Shifted the Regime)
ECB First Rate Hike in Nearly Three Years — June 11, 2026 The ECB raised its deposit facility rate 25 bps to 2.25% — its first hike since 2023 — driven by euro-area headline inflation jumping to 3.2% in May on the Iran oil shock, with energy costs up ≈10.9% YoY. Markets now price ≈50% odds of another hike at the late-July ECB meeting. This raised European rates into the EFA expiry window and is why implied vol on EFA is elevated — and why the ≈$4.84 premium is unusually rich.
Record International ETF Inflows — January–Q1 2026 International-equity ETFs took in an estimated $51 billion in January 2026 alone — the largest monthly inflow on record — with US equity funds simultaneously shedding $34 billion. This structural rotation from US into international was the rocket fuel behind EFA's YTD gains.
Valuation Gap Still Wide Non-US stocks remain roughly ≈35% cheaper than US equities on forward P/E, with the ex-US weight in MSCI World near a 40-year low (≈27.5% vs a historical ≈48.7%). CFA Institute research cites this structural underweight as a multi-year rebalancing tailwind.
Iran / Strait-of-Hormuz Oil Shock — Feb–June 2026 The February–March Iran conflict disrupted the Strait of Hormuz (≈20% of global oil flow), pushing WTI toward $110 and richening volatility across global assets. As of mid-June, President Trump indicated a peace agreement could come within days — which would be a near-term tailwind for European equities and could lift EFA — but would also reduce the premium richness that made today's buy-write so attractive.
Upcoming Catalysts (Next 2–6 Weeks)
Bank of Japan Decision — June 15–16, 2026 📅 (INSIDE the Jun-30 expiry) This is the single biggest near-term binary for EFA. ≈94% of Reuters-polled economists and Polymarket traders expect a 25 bps hike to 1.0%, driven by sticky inflation and yen weakness. Japan is EFA's single largest country weight at ≈23%. A hike that strengthens the yen is a translation tailwind for unhedged EFA holders — but the covered-call seller's gain is capped at the $100 strike regardless of any yen/Nikkei pop. The buy-write framing is clear: collect the premium now and let the BoJ event pass without needing to predict the exact outcome.
For further context on how BoJ rate policy affects EFA-constituent Japanese names, Kavout's Japan ETF analysis breaks down the yen-sensitivity and export-vs-domestic split inside EFA's Japan weighting.
ECB Next Meeting — Late July 2026 📅 (outside the Jun-30 expiry) Markets are pricing ≈50% odds of another 25 bps ECB hike in late July. The key data input is the June euro-area inflation print, due early July. If the July ECB hike materializes, it hits after the Jun-30 options expire — so covered-call holders may want to reassess their view on the September quarterly expiry ($95.63–$112.97 implied range) after this one rolls off.
Iran Peace Deal Headline Risk — Days 📅 (binary, inside the Jun-30 expiry) A signed Iran peace deal would likely cap oil prices, soften the dollar's safe-haven bid, and extend the European relief rally. A re-escalation toward Hormuz re-closure and $150–$200 oil would hit energy-importing EAFE economies (Japan, Germany, France) hard and reverse the rotation trade. This binary sits squarely inside the Jun-30 window and was almost certainly a factor in the desk choosing a short, 15-day expiry for their covered-call overlay.
EFA Jun-30 Option Expiry 📅 The final expiration of the short $100 call. If EFA closes above $100 on June 30, the desk's shares are called away at $100 (effective exit ≈$104.84 including the premium). If EFA somehow falls below $100 by expiry, the short calls expire worthless and the desk keeps the full ≈$4.3M — but is sitting on an EFA stock loss below $100, which is a separate concern.
🎲 4-Reader Interpretation
🚀 YOLO Trader
This specific trade is a premium-SELLER structure — not your usual directional YOLO play. But here is how to think about it: the desk collected ≈$4.84 upfront with EFA at $104.37. That premium is now theirs to keep no matter what. If you want to run your own shorter-duration income play: EFA has elevated IV heading into the BoJ tomorrow. Selling a slightly OTM put (say $102 or $103 strike, Jun-30 expiry) would be a cash-secured put that collects premium while the event passes. If EFA holds, you keep the premium. If it dips, you own EFA at an effective below-market price. That said — the BoJ binary is real. Do not sell puts you are not comfortable owning the underlying on.
📊 Swing Trader
The $104 gamma floor is your near-term guide. If EFA holds above $104 through the BoJ announcement tomorrow, the positioning is constructive — market makers will defend that level. A sustained move above the $106 gamma wall on volume would be a breakout signal suggesting the rotation still has legs into Q3 (the quarterly implied range extends to $112.97). But with the covered-call desk betting on sideways-to-down through June 30, the easier near-term trade may be to wait for the BoJ outcome, let the volatility settle, and look for a directional entry on the September quarterly expiry instead.
🛡️ Premium Collector
This is YOUR kind of trade. The desk literally did what you love: sold rich ITM calls against a long ETF position and collected ≈$4.3M. The covered-call structure is the textbook income overlay for a market where you expect flat-to-sideways action. EFA even pays a ≈2.4% dividend yield — so if you layer a covered call on top, you are stacking two income streams simultaneously. The key lesson from this trade: the desk chose an ITM strike ($100 vs $104.37 spot) rather than an OTM one — accepting a higher probability of being called out in exchange for a fatter premium. That is a defensively income-focused, not speculative, choice. Copy the logic, not necessarily the exact strike and expiry.
🌱 Entry-Level / Beginner
Here is the plain version: imagine you own 100 shares of EFA at ≈$104 each (total value ≈$10,400). You can sell someone else the right to buy your shares at $100 anytime before June 30. They pay you $4.84 per share just for that right — so you immediately collect ≈$484 in cash. The catch: if EFA is above $100 on June 30 (which it likely will be unless it crashes), they will exercise their right and buy your shares at $100. You walk away with $100/share + $4.84 already collected = effectively $104.84/share. You got today's price, plus a bonus. That is a covered call — the most beginner-friendly income strategy in options. The risk is NOT the options trade: it is the underlying EFA stock falling a lot. If EFA drops from $104 to $90, you have a $14 stock loss that the $4.84 premium only partially offsets. Always remember: the income from the call is capped; the stock downside is not.
⚠️ Risk Factors
Options trading involves substantial risk of loss. Here are the specific risks for this buy-write structure and the EFA backdrop:
Capped Upside — The Core Trade-Off By selling the $100 covered call, the desk gave up all upside above ≈$104.84 (effective exit price). If the BoJ hike tomorrow triggers a sharp yen rally and Nikkei/EFA pop toward $108–$110, the desk participates none of that gain. The ≈$104.84 effective cap is the price paid for the ≈$4.3M premium. For the quarterly implied range extending to $112.97, that is potentially a lot of upside left on the table if the rotation theme accelerates.
Stock Downside Is Uncapped The short call is covered — but the long EFA stock is not hedged. If a Strait-of-Hormuz re-escalation sends oil toward $150–$200 and hits energy-importing EAFE economies hard, EFA could fall significantly. The ≈$4.84 premium collected offsets only ≈4.6% of stock decline from the $104.37 entry. Below ≈$99.53 (spot minus premium), the desk is in a net losing position on the combined trade.
BoJ Surprise Risk — Both Ways If the BoJ hikes more aggressively than the expected 25 bps (say, 50 bps), yen strength could accelerate — a translation tailwind for EFA that the covered-call seller cannot capture. If the BoJ disappoints and holds rates, yen weakness returns, Japanese stocks may wobble, and EFA could pull back. The covered call is a hedge against either kind of disappointment — but an upside surprise makes you wish you had not sold those calls.
Crowded Rotation / "Already Peaked" Risk Strategists have begun warning that European tailwinds have "largely already played out" after record highs, and that double-digit EPS growth expectations are demanding. If the rotation trade is crowded and reverses, the covered-call income provides a small buffer but does not fully protect a serious drawdown in EFA.
Dollar Reversal Risk The weak-dollar tailwind for unhedged EFA (DXY fell ≈9% in 2025) has stalled — DXY is back near 100 on Iran safe-haven demand. A sustained dollar strengthening into H2 2026 would erode EFA's USD-denominated returns even if local markets hold, making the ETF's total return less attractive relative to domestic US equity funds.
What the Tape CANNOT Tell Us We know this is a buy-write (stock + short call) from the paired-leg print, the ITM strike, the STO structure, and the zero prior OI. We do NOT know the desk's cost basis in the EFA shares, whether they plan to roll the covered call if EFA stays above $100 near expiry, whether this is a standalone yield strategy or part of a larger structured portfolio, or their exit plan for the stock if the calls are NOT exercised.
🎯 The Bottom Line
Here's the deal: a desk just locked in ≈$4.3M of income by selling 8,810 deep-in-the-money covered calls on EFA — the biggest international developed-market ETF — with only 15 days to the June 30 expiry. This is not a bet on EFA going down. It is a deliberate income overlay on a long stock position, chosen at exactly the right moment: elevated implied volatility from the ECB hike and Iran oil shock richened the premium, and two central-bank decisions (BoJ June 16, ECB September) make the near-term direction genuinely two-sided.
The setup is elegant: collect ≈$4.84 per share now, accept being called out of EFA at $100 by June 30 (an effective ≈$104.84 exit — essentially today's price), and sidestep the directional guessing game into the BoJ announcement.
What to watch:
- 📅 June 16 — Bank of Japan decision: ≈94% odds of a hike to 1.0%. A yen-strengthening hike is a tailwind for EFA NAV — but the covered-call desk participates only up to ≈$104.84. Watch whether a BoJ hike triggers a buy-the-news pop or "sell the fact" on the Nikkei.
- 📅 Days — Iran peace-deal headline: A signed agreement would boost European equities and possibly push EFA above $106 (the gamma wall). That would be great for long-only EFA holders, but the covered-call desk would be called out at $100 and miss the pop.
- 📅 June 30 — Option expiry: If EFA closes above $100 (nearly certain unless a major shock), shares are called away at $100, premium is kept, trade closes. If EFA closes below $100 (unlikely but possible on a major macro shock), short calls expire worthless, premium is still kept, but the stock loss becomes the focus.
- 📅 Tomorrow ≈06:30 ET — OPRA OI snapshot: Expected OI to rise from 0 to ≈8,810 on the EFA Jun-30 $100 Call, confirming this as a freshly opened income position.
If you own EFA: This trade is a template. With BoJ tomorrow and ECB uncertainty into July, implied volatility is elevated — that is the ideal time to layer a covered call for extra income. The $104 gamma support is your near-term floor; $106 is the resistance. If you want upside exposure past $106, do NOT sell the call. If you are happy collecting ≈4.6% premium for 15 days of patience, the desk's logic applies to you too.
If you are watching from the sidelines: The international rotation theme remains intact on valuation (≈35% discount to US, 40-year low ex-US weighting) and on European fiscal/defense spending momentum. But the regime is no longer one-directional — ECB is hiking, BoJ is hiking, and the dollar has stabilized. Adding EFA exposure after the BoJ announcement (and the volatility it brings) gives you better information for a cleaner entry. The September quarterly implied range ($95.63–$112.97) shows there is still plenty of room for the story to develop.
The ≈$4.3M income collected this morning is the market's best signal about where EFA is headed near-term: nowhere that required a directional bet.
Disclaimer: Options trading involves substantial risk of loss and is not suitable for all investors. This analysis is for educational and informational purposes only and does not constitute financial advice. Covered calls cap upside but do not eliminate downside risk on the underlying stock position. Past unusual options activity does not guarantee future returns. The EFA June 30, 2026 $100 call position described here is a sell-to-open (STO) covered call; the risk in this structure lies primarily in the long stock component, not the option leg. Always conduct your own due diligence and consult a licensed financial advisor before making any trading decisions. Open/close classification is based on size-vs-prior-OI inference (size 8,810 vs OI 0 = fresh open); the next-day OPRA OI snapshot (≈06:30 ET on June 16) is the definitive confirmation.
Last updated: 2026-06-16 — next-day OPRA OI confirmed a fresh sell-to-open (resolving OI 8,817 ≈ size).