🛡️ FISV — A ≈$66.4M Collar Fences ≈9.4M Shares Between $50 and $55, and They Got Paid $7.6M To Do It
📅 August 3, 2026 | 🔒 Protective Structure Detected — Not a Directional Bet
✅ UPDATE — August 4, 2026 pre-market: the full collar is confirmed opened. The $50 put rose 3,403 → 153,651 (+150,248) and the $55 call rose 4,062 → 102,804 (+98,742) — both ≈100% of their prints. The ≈9.4M-share fence is real and now on the books. See the ✅ RESOLVED box.
🎯 The Quick Take
Between 13:04:17 and 13:06:04 this afternoon, a single desk worked a large package in Fiserv: sold 98,400 of the Sep-18-2026 $55 calls for $37.0M and bought 150,000 of the Sep-18-2026 $50 puts for $29.4M — a net credit of $7.6M. Every leg printed as a stock-plus-options auction — a facilitated, worked package exposed for price improvement, with an equity block trading alongside the options on the same ticket. It is not a lit sweep and not a simple cross. This is a textbook protective collar laid over roughly 9.4 million shares (≈$510M of notional): sell the upside above $55, buy the downside below $50, and get paid to do it. It is risk management, not a bet on direction — and it lands three days before Fiserv's next earnings report.
📊 Company Overview
Fiserv, Inc. (NASDAQ: FISV) provides payments and financial-services technology through two segments: Merchant Solutions (payment processing and digital commerce) and Financial Solutions (debit/credit card processing, core banking, and payments infrastructure for banks and businesses) (stockanalysis.com company profile).
| Item | Value |
|---|---|
| Sector / Industry | Technology / Software – Application |
| Exchange | NASDAQ |
| Headquarters | Milwaukee, Wisconsin |
| Employees | ≈38,000 |
| CEO | Takis (Panagiotis) Georgakopoulos (since June 15, 2026) |
| Market cap | ≈$29.0 billion |
| Shares outstanding | ≈533.3 million |
| Trailing P/E | ≈9.1× |
| Beta | ≈0.79 |
| Spot at print | $54.42 |
The year in one line: FISV is down ≈18.9% year-to-date and has fallen ≈59.7% over the past 12 months (MarketBeat FISV chart) — a name that, per activist investor Jana Partners, has seen "nearly 80% share-price decline from its 2025 highs" (StockTitan, Jana Partners letter, July 30, 2026). This is a stock in the middle of a real crisis of confidence, not a routine pullback — which matters for how we read a collar being placed on it today.
💰 The Option Flow Breakdown
📊 What Just Happened (the tape)
| Time (ET) | Buy/Sell | Call/Put | Expiration | Premium | Strike | Volume | Prior OI | Size | Spot | Option Price | Option Symbol |
|---|---|---|---|---|---|---|---|---|---|---|---|
| 13:04:17–13:06:04 | 🔴 SELL | CALL | 2026-09-18 | $36,998,400 collected | $55 | 98,400 | 4,062 | 98,400 | $54.42 | $3.76 | FISV20260918C55 |
| 13:04:17–13:06:04 | 🟢 BUY | PUT | 2026-09-18 | $29,400,000 paid | $50 | 150,000 | 3,403 | 150,000 | $54.42 | $1.96 | FISV20260918P50 |
| same window | (implied) | Equity | — | ≈$509.8M notional | — | — | — | ≈9,368,388 sh | $54.42 | — | reported on the equity tape, not itemized here |
🤝 Flow tag: STOCK-PLUS-OPTIONS PACKAGE. Both option legs carry the stock-plus-options marker — the equity side of this trade is reported on the stock tape, not the options tape, so we cannot show its exact print. We infer its approximate size from the combined option delta.
Net premium: $7,598,400 CREDIT (they were paid to put this on, not the other way around).
- Call strike $55 sits ≈1.1% above the $54.42 spot.
- Put strike $50 sits ≈8.1% below spot.
- Combined option delta ≈ −9,368,388 shares, or roughly $510M of notional short delta — which is why a paired equity leg of similar size shows up on the other side of the ticket.
- Order types, per the tape: the call is STO (sold to open — new short position) and the put is BTO (bought to open — new long position). Both are proven opens (see below), so these labels are not provisional.
✅ RESOLVED — Next-Day OI Is In (August 4, 2026 pre-market)
The OPRA open-interest snapshot timestamped August 4, 2026 ≈06:30 ET reflects the close of business August 3 — the definitive open-vs-close test we flagged when this published. Here is what it says.
| Leg | Baseline OI (Aug-3 snap) | Resolving OI (Aug-4 snap) | Δ | Print size | Δ as % of print | Verdict |
|---|---|---|---|---|---|---|
| Sep-18-2026 $50 put (bought) | 3,403 | 153,651 | +150,248 | 150,000 | ≈100.2% | ✅ OPEN (BTO) |
| Sep-18-2026 $55 call (sold) | 4,062 | 102,804 | +98,742 | 98,400 | ≈100.3% | ✅ OPEN (STO) |
Verdict: a genuinely new protective collar, not a rearrangement of something already on. Both legs added essentially their entire print size to open interest — the put strike went from 3,403 to over 153,000 contracts, the call strike from 4,062 to nearly 103,000. There is no ambiguity left: BTO on the put, STO on the call, both HIGH confidence. A holder of ≈9.4M shares fenced that stake between $50 and $55 through September expiry and collected $7.6M for doing it, exactly as published.
🤓 What This Actually Means — Plain English
The structure, in one sentence: someone who is very likely long a large block of Fiserv stock just built a fence around it — sold the right to the stock above $55, bought insurance below $50, and got paid $7.6M for the privilege.
Why the premiums work in their favor: the $55 calls they sold ($3.76 each) were worth more than the $50 puts they bought ($1.96 each), even though the puts cover more contracts (150,000 vs. 98,400). That's what generates the $7.6M credit. In plain terms: they were paid to cap their upside and buy their downside protection at the same time — the market was willing to pay more for the call they gave up than they had to pay for the put they picked up.
The put:call ratio is not 1-for-1. They bought 150,000 puts against only 98,400 calls sold — about 1.52 puts for every call. That extra downside protection, beyond what a plain 1:1 collar would need, suggests they wanted more insurance than they were willing to give up in upside — a mildly more defensive collar than the textbook version.
What the options legs alone are worth at expiration (Sep 18, 2026) — this is the provable part, the pure option math, holding the $7.6M credit already banked:
| FISV at expiry | $55 call payoff (short, 98,400 ct) | $50 put payoff (long, 150,000 ct) | Net options P&L (incl. $7.6M credit) |
|---|---|---|---|
| $60 | −$49.2M (5-point loss × 9.84M sh) | $0 (worthless) | ≈−$41.6M |
| $55 (short strike) | $0 (at the money) | $0 (worthless) | ≈+$7.6M |
| $54.42 (spot, unchanged) | $0 (OTM) | $0 (OTM) | ≈+$7.6M |
| $50 (long strike) | $0 (OTM) | $0 (at the money) | ≈+$7.6M |
| $45 | $0 (OTM) | +$75.0M (5-point gain × 15.0M sh) | ≈+$82.6M |
Between $50 and $55, the options legs simply keep the full $7.6M credit — nothing happens, and that is the best case for the options position in isolation. Above $55, the short calls start losing money one-for-one with the stock (uncapped on the option leg itself, though this offsets — not compounds — gains on any underlying shares). Below $50, the puts start paying out, and because there are more puts than calls, that payout accelerates faster than the cap above $55 costs them.
⚠️ Motive — graded INFERRED, not proven. The structure is overwhelmingly consistent with someone hedging a large existing Fiserv holding: you do not sell 98,400 calls unless you have shares underneath them to deliver, and the stock-plus-options marker confirms equity traded alongside. But the tape cannot prove share ownership, when it was acquired, or whether this is a brand-new ≈9.4M-share entry being fenced from day one rather than a hedge on a pre-existing stake. Both readings are consistent with the print; we cannot distinguish them from the options tape alone.
Why now matters: FISV reports earnings in three days (August 6, before the open), amid an activist campaign from Jana Partners and a stock already down nearly a fifth this year. Placing a collar — not buying more calls, not selling the stock outright — reads like someone locking in what is left rather than expressing a fresh view on the name. STO the calls, BTO the puts: this is defense, not offense.
📈 Technical Setup / Chart Check-Up
YTD Performance
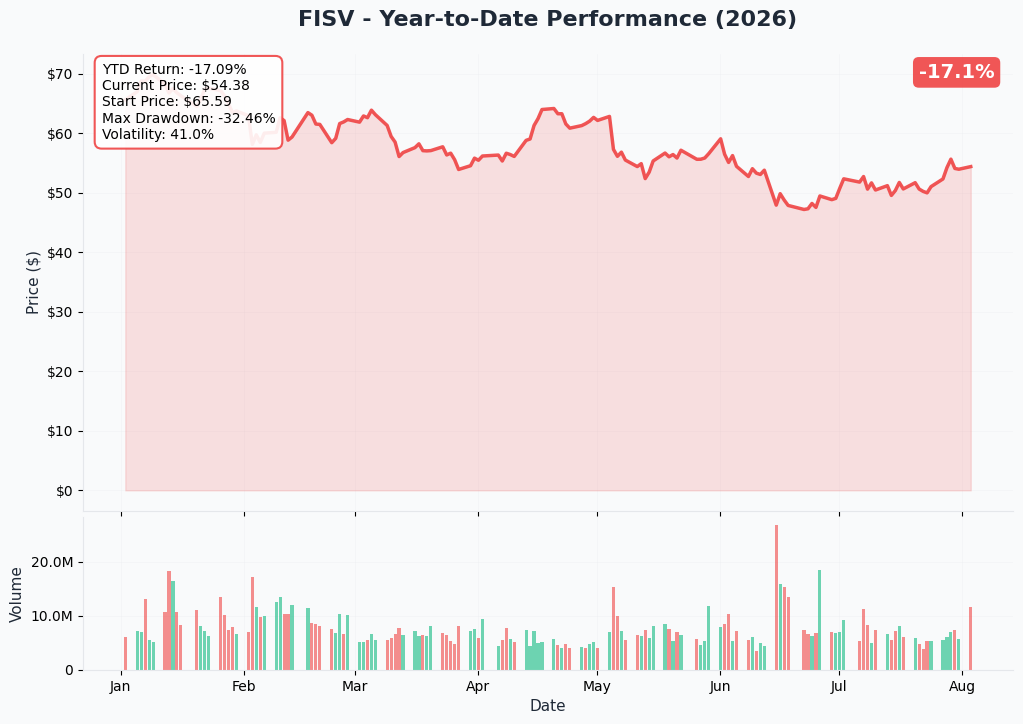
FISV enters this trade down ≈18.9% year-to-date and ≈59.7% over the trailing year (MarketBeat FISV chart) — one of the more damaged large-cap charts on the board today. A collar on a name that has already given up this much ground reads as capital preservation, not a fresh directional call.
🔵🟠 Gamma-Based Support & Resistance
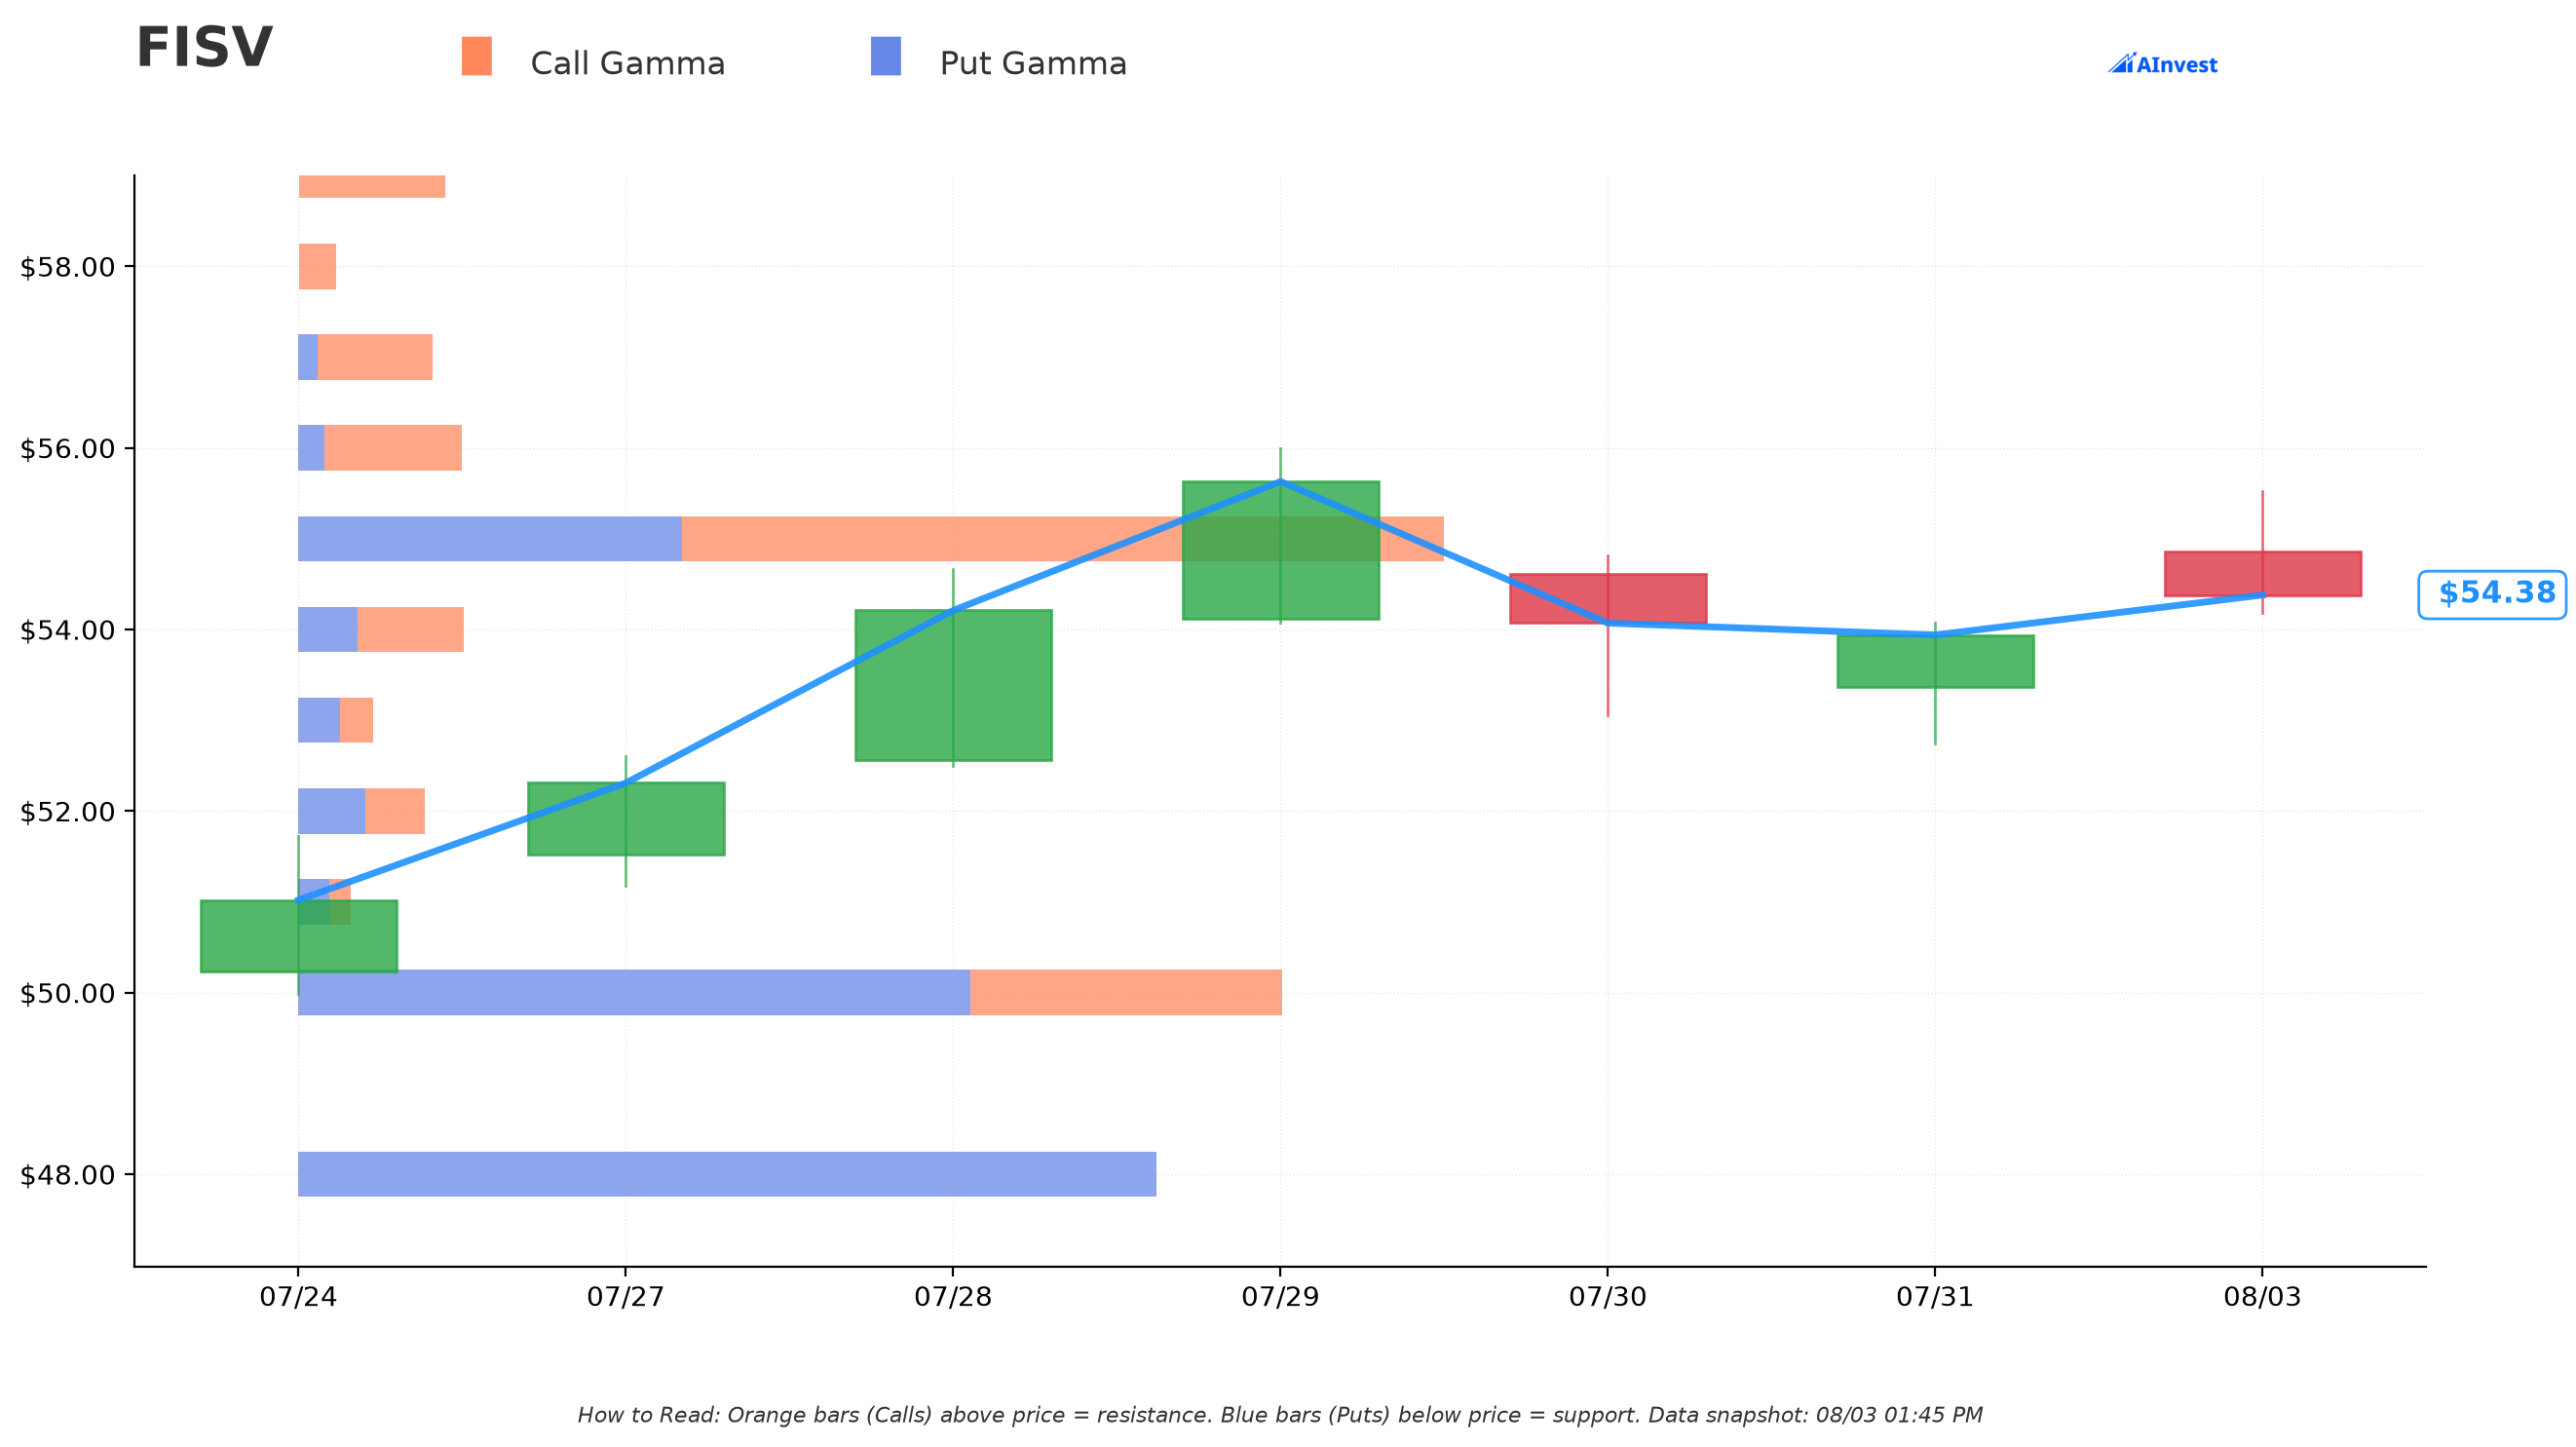
Current price in the gamma file: $54.37.
🟠 Resistance above spot:
- $55 — the nearest wall, flagged "Moderate" strength (≈$4.92B total gamma, net call-dominated), sitting just ≈1.2% above spot. This is exactly where the short call strike sits — dealers are already positioned to sell into rallies right at the level this collar caps out.
- $56 / $57 — thinner, secondary resistance.
- $60 and $65 — the next real walls (≈$2.94B and ≈$3.08B total gamma respectively), both larger than the $55 level. Translation: if FISV ever clears $55 with conviction, there is a real gap before the next serious ceiling near $60–65 — but the short calls cap this trade's economics well before then.
🔵 Support below spot:
- $50 — total gamma ≈$4.23B, the largest concentration below spot, and exactly where the long put strike sits. This is a meaningful coincidence worth noting: the collar's own floor lines up with where dealer gamma already suggests buyers show up.
- $48 — close behind at ≈$3.69B, almost entirely put-dominated.
- $45 and $40 — thinner support further down.
What this means for traders: the collar's $50/$55 fence was not built in a vacuum — it sits almost exactly on top of where the options market already shows its two biggest nearby gamma concentrations. That is either smart positioning or simply where the liquidity already was; we cannot tell which from the tape.
🎯 Implied Move
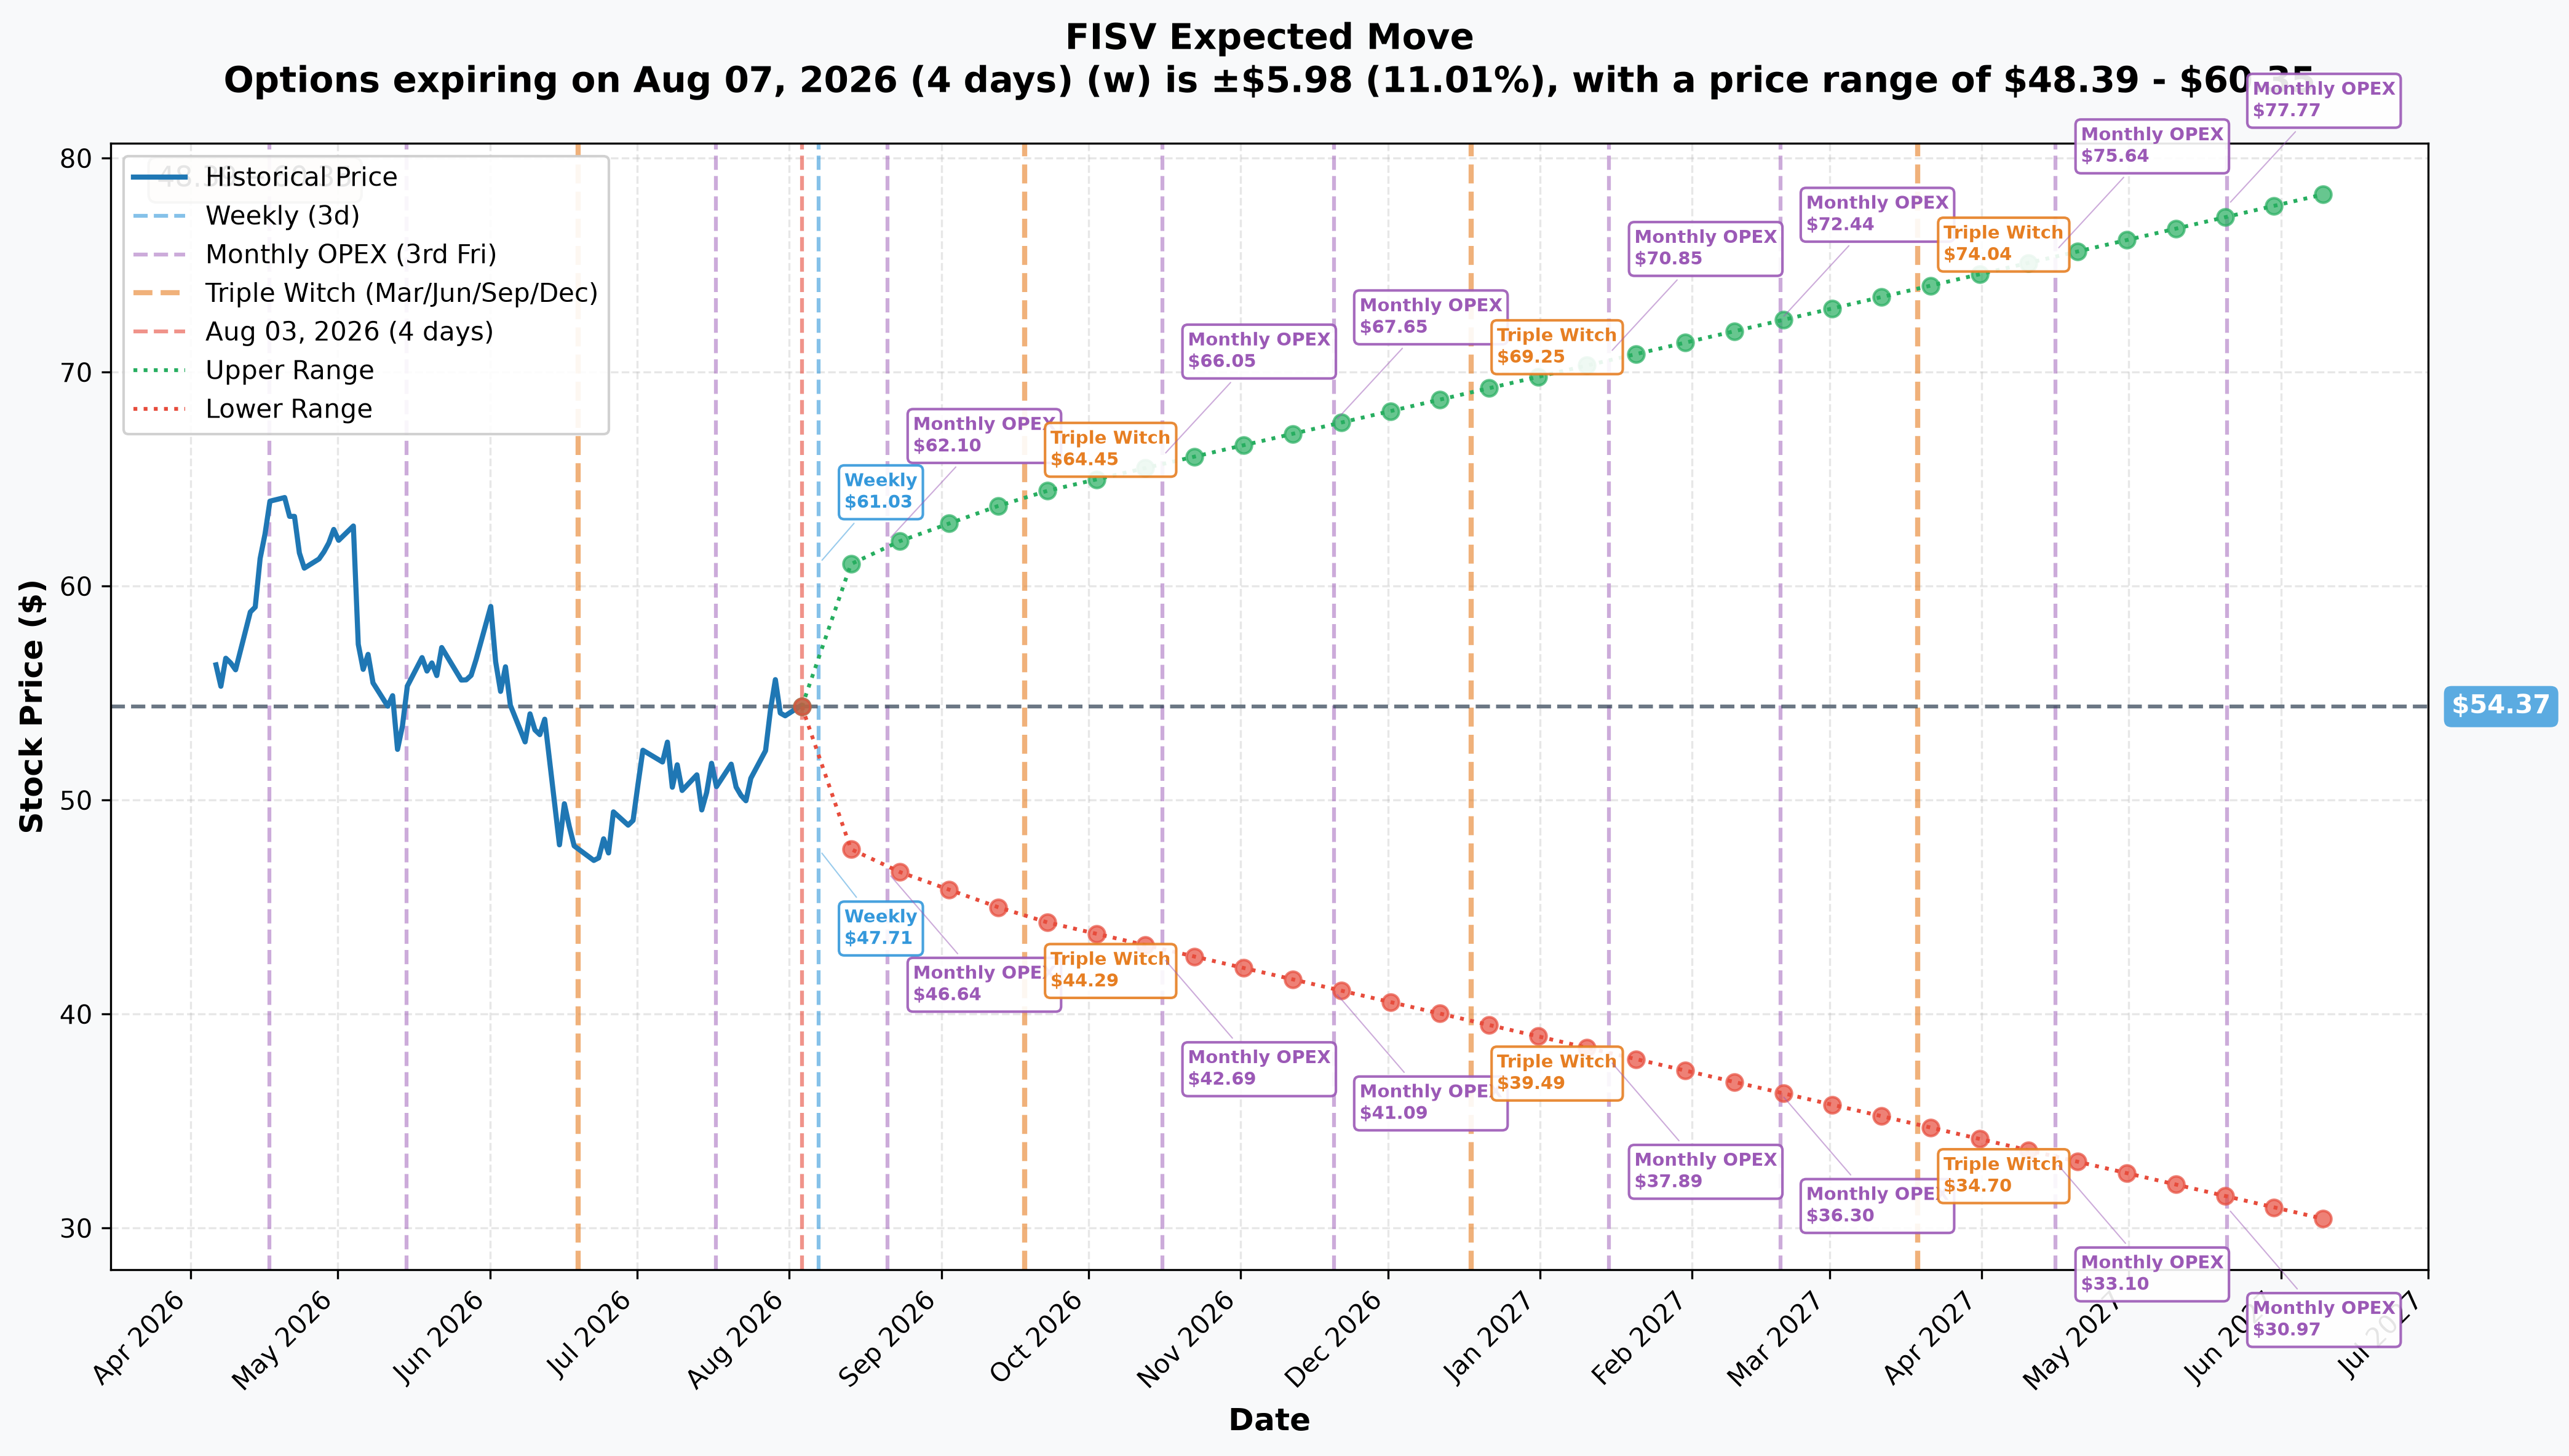
| Expiry | Days | Implied Move | Range |
|---|---|---|---|
| Weekly (Aug 7) | 4 | ±11.0% (±$5.98) | $48.39 – $60.35 |
| Monthly OPEX (Aug 21) | 18 | ±13.9% (±$7.57) | $46.80 – $61.94 |
| Quarterly Triple Witch (Sep 18) — the collar's own expiry | 46 | ±18.2% (±$9.87) | $44.50 – $64.24 |
| Yearly LEAPS (Jun 2027) | 318 | ±44.8% (±$24.36) | $30.01 – $78.73 |
The weekly implied move alone is ±11% — because Fiserv's Q2 earnings land inside that four-day window (August 6, before the open). That is a lot of priced-in uncertainty for a single print.
The honest read on the collar's own expiry: the market is pricing a Sep-18 range of $44.50 to $64.24 — which is wider on both sides than the collar's $50–$55 fence. In plain terms, the options market itself thinks there's a real chance FISV finishes September outside the range this collar protects. The collar caps losses below $50 and gains above $55, but the implied move says both of those boundaries could be breached before expiration.
🎪 Catalysts
🔴 Immediate — inside the Sep-18-2026 expiry
Q2 2026 earnings — Thursday, August 6, 2026, before market open, 8:00 a.m. ET call (StockTitan, Fiserv earnings-date announcement, July 14, 2026). This lands three days after the collar was put on and squarely inside the September expiry — almost certainly the single reason the hedge went on this week rather than any other.
Jana Partners activist campaign — letter dated July 30, 2026 (StockTitan, Jana Partners letter to Fiserv board). Jana is pushing for a comprehensive strategic review of the entire asset portfolio, support for exploring a sale of Fiserv's debit network assets, and further board changes, arguing recent board changes "have unfortunately proven insufficient to remediate the Company's governance issues." Jana frames its thesis around "a dramatic earnings reset and a nearly 80% share-price decline from 2025 highs." Any board response, asset-sale headline, or proxy fight development between now and September 18 falls inside this collar's window and is a real source of two-way volatility.
CEO transition — Takis (Panagiotis) Georgakopoulos became CEO on June 15, 2026, replacing Mike Lyons (who departed for Truist Financial) (StockTitan, Fiserv leadership announcement). The company reaffirmed 2026 guidance at that time — 1–3% organic revenue growth and adjusted EPS of $8.00–$8.30. Thursday's print is the new CEO's first quarterly report since taking the seat, raising the stakes on execution credibility.
Analyst target cuts, mostly in July 2026 (MarketBeat FISV price-target history):
| Date | Firm | Action | Target | Rating |
|---|---|---|---|---|
| Jul 24 | Truist Financial | Cut | $58 → $52 | Hold |
| Jul 22 | BMO Capital Markets | Reiterated | $60 → $55 | Market Perform |
| Jul 22 | Cantor Fitzgerald | Reiterated | $62 → $53 | Neutral |
| Jul 10 | Citigroup | Reiterated | $60 → $57 | Neutral |
| Jul 9 | Goldman Sachs | Reiterated | $70 → $60 | Neutral |
| Jul 9 | Wells Fargo | Set | $62 → $56 | Equal Weight |
| Jul 8 | JPMorgan Chase | Cut | $75 → $62 | Neutral |
| Jul 8 | Barclays | Initiated | $58 | Equal Weight |
| Jul 7 | TD Cowen | Cut | $64 → $63 | Neutral |
Nine analysts, all clustering in a $52–$63 target band with a Hold-leaning consensus — notably, BMO's $55 target is the exact strike this collar sold calls at, and Truist's $52 sits inside the fence too. The Street, in other words, largely agrees the stock is fairly valued somewhere near where this collar is fencing it.
🟡 Minor / background
Datavault AI partnership — July 21, 2026: Fiserv will provide embedded banking and payments services for Datavault AI's marketplaces and NIL Exchange (StockTitan). A modest positive, unlikely to move the stock materially on its own before earnings.
👥 Four-Reader Interpretation
🎰 YOLO trader: There isn't a lottery ticket here — this is the opposite of one. If you want to play the earnings binary yourself, note that the market is already pricing an ±11% weekly move into Thursday. A directional bet into that print is a coin-flip against professionally-priced volatility; sizing small is the only responsible way to touch it.
📈 Swing trader: The collar effectively tells you where a large holder thinks the "fair fence" is for the next six weeks: $50 support, $55 resistance, both reinforced by real gamma concentration. Watching for a break of either level — especially post-earnings — could offer a swing entry in the direction of the break, since a break of $55 clears into thin resistance until $60, and a break of $50 has only modest support at $48 before $45.
💰 Premium collector: This trade is a premium collector's structure done at scale — sell the calls, buy the puts, bank the credit. A retail version (smaller size, same $50/$55 strikes or nearby) is a completely reasonable way to collect income on shares you already own here, especially given the elevated implied volatility into earnings.
🌱 Beginner: Think of this like buying insurance on a car, but the insurance company also pays you to give up bragging rights on winning the lottery with that car. They collected $7.6M by promising to sell their stock at $55 if it gets there, and used part of that money to guarantee they can sell at $50 if it crashes. It's defense, not a bet that Fiserv is going up or down — it's a bet that they don't want to find out the hard way.
⚠️ Risk Factors & Honest Limits
- We cannot prove share ownership. The stock-plus-options marker tells us equity traded alongside these options, and the combined delta is consistent with a ≈9.4M-share position, but the tape cannot confirm whether that stock was already held, was bought today as part of this same package, or is held by the same account that sold the calls and bought the puts.
- The implied move is wider than the fence. The market's own Sep-18 pricing ($44.50–$64.24) extends beyond both the $50 floor and the $55 ceiling — a real move could still hurt or help this position outside the collar's designed range in ways the simple payoff table above doesn't capture once you account for the underlying shares.
- Earnings in three days is a binary event. Whatever guidance or headline comes out of Thursday's report and the ongoing Jana Partners situation could move the stock sharply in either direction before the position has had time to season.
- We do not know if this position is held to expiration. Institutional collars are frequently adjusted, rolled, or unwound early — especially around a catalyst like this week's earnings. Next-day OI confirms the open; it does not confirm the hold.
- Options trading involves substantial risk of loss and may not be suitable for all investors. This analysis is for educational purposes only and is not financial advice. The size and structure of this trade reflect an institutional hedging need that may not translate to a retail account of a very different size or risk tolerance. Always do your own research and consider a licensed financial advisor before trading.
🎯 The Bottom Line
Real talk: someone got paid $7.6M to fence roughly half a billion dollars of Fiserv exposure between $50 and $55, three days before an earnings report on a stock that's already down almost 20% this year and facing an activist campaign. That is not a bullish signal and it is not a bearish signal — it's a risk-management signal. The most useful thing retail traders can take from this: the market's two biggest institutional-style price magnets on FISV right now sit at exactly $50 and $55, reinforced by real gamma concentration at both strikes, and Thursday's earnings is the event most likely to test both edges of that fence.
Mark your calendar:
- 📅 August 6, 2026, before the open — Fiserv Q2 earnings, first quarterly report under the new CEO
- 📅 August 6, 2026, 06:30 ET (before) — check next-day OI to confirm both legs of this collar held as predicted
- 📅 September 18, 2026 — this collar's expiration, and the quarterly triple-witch date
Come back pre-market tomorrow for the OI confirmation on this position.
Last updated: August 4, 2026 — next-day OPRA open-interest resolution added (✅ RESOLVED box above). Original analysis published August 3, 2026.