⚛️ FRMI $7.2M Deep-ITM Put Sale — A Delta-Hedged Package Cross, Not the Naked Synthetic Long We First Read
📅 July 28, 2026 | 🔥 Unusual Activity Detected
✅🔄 Update + CORRECTION (July 29, 2026): two things resolved overnight. The size and the open are CONFIRMED exactly: open interest on the Dec-15-2028 $12 put went 0 → 10,000, a perfect match to the settled print — a clean fresh STO, with the cancel/re-report on the tape fully accounted for. But a re-pull of the tape corrected the mechanism, and it changes the read. This did not print as an aggressive below-the-bid lit sale. It printed as a stock-and-options package cross — a negotiated, off-book trade carrying an equity leg — and the equity tape shows the matching leg: a 270,000-share block at $6.447, versus the ≈285,000 shares this option's delta calls for, a ≈95% match. So the position is delta-hedged, not naked, and the "aggressive, unhedged synthetic long" framing has been rewritten throughout.
🎯 The Quick Take
10,000 FRMI December 15, 2028 $12 puts sold for ≈$7.2 million in credit, on a stock trading at just $6.36 — a strike sitting ≈89% above the current price. Open interest went from zero to exactly 10,000 overnight, so this is unambiguously a brand-new position and the settled size is confirmed to the contract.
What it is not is a naked directional bet. Our first read called this an aggressive, unhedged sale and inferred a synthetic long — the logic being that selling a deep in-the-money put is economically similar to owning the stock. Re-pulling the tape corrected that: the trade printed as a stock-and-options package cross, meaning a negotiated block that carries an equity leg by construction, and the equity tape confirms it with a 270,000-share block against the ≈285,000 shares the option's delta requires (≈95% match). The put sale and the stock trade were arranged together as one package, and they largely cancel each other's directional exposure. There is no urgency in this print and no clean bullish signal in it — a known counterparty agreed the price in advance, and the resulting position is close to delta-neutral.
📊 Company Overview
Fermi Inc. (FRMI), branded Fermi America, is a pre-revenue AI-power and datacenter Real Estate Investment Trust (REIT — Specialty) co-founded by former U.S. Energy Secretary and Texas Governor Rick Perry:
- ⚡ The project: "Project Matador" — an 11-to-17 gigawatt "behind-the-meter" private power-and-compute campus in Amarillo, Texas, built on land leased from Texas Tech University, combining natural gas turbines, planned advanced nuclear, grid power, solar, and battery storage to feed hyperscale AI datacenters
- 🏗️ Business model: Fermi doesn't sell a product today — it develops gigawatt-scale energy infrastructure and leases capacity to AI/hyperscaler tenants, betting that self-generated power lets it skip the multi-year utility interconnect queues everyone else is stuck in
- 💰 Market Cap: ≈$4.0 billion on ≈638 million shares outstanding
- 📉 Stock history: IPO'd October 1, 2025 at $21, spiked as high as $36.99, and has since collapsed to ≈$6.36 — a 52-week range of $4.47 – $36.99
- 🚧 Stage: Pre-revenue development company; FY net loss ≈−$718M — this is a pure-optionality name where the entire market cap is a wager on future signed tenants, not current cash flow
This is a classic "story stock": it moves 20-30% in a day on tenant-contract headlines, not earnings beats.
💰 The Option Flow Breakdown
📊 What Just Happened
The Tape (July 28, 2026 @ 12:25:17 ET):
| Time | Buy/Sell | Call/Put | Expiration | Premium | Strike | Volume | Prior OI | Size (settled) | Spot | Option Price | Option Symbol |
|---|---|---|---|---|---|---|---|---|---|---|---|
| 12:25:17 ET | 🔴 SELL | PUT | 2028-12-15 | $7.2M credit | $12 | 10,000 | 0 | 10,000 | $6.36 | $7.24 | FRMI20281215P12 |
Volume corrected July 29 from 20,000 to 10,000. The raw feed counted the same 10,000-lot trade twice across its cancellation and re-report; next-day open interest came in at exactly 10,000, confirming the settled size.
Flow tag: 🤝 DEEP-ITM PUT SALE via a STOCK-AND-OPTIONS PACKAGE CROSS — delta-hedged. (Corrected July 29 — this was originally tagged as an aggressive below-the-bid lit sale.) This printed as a negotiated package cross: a trade type that bundles an options leg and an equity leg into one pre-agreed transaction with a known counterparty on the other side. Two consequences follow, and both matter:
-
There is no "aggressor" to read. On a negotiated cross the price is agreed off-book, so where the print sits relative to the displayed bid or ask carries no information about urgency. The original "sold aggressively below the bid" framing was a misreading of a mechanism that doesn't work that way.
-
There is an equity leg, and we found it. The stock tape shows a 270,000-share block at $6.447 in the same window (against a surrounding tape trading ≈$6.37–$6.40). The option's own model delta of ≈−0.285 implies a hedge of 10,000 × 100 × 0.285 = ≈285,000 shares. Actual 270,000 vs. ≈285,000 expected = a ≈95% match — tight enough to confirm a genuine, deliberate delta hedge rather than coincidental flow.
-
💸 Premium collected: ≈$7.24M in gross terms, but the settled trade is 10,000 contracts (≈$7.2M net credit at $7.24/contract × 10,000 × 100)
-
🎯 Strike distance: $12 is ≈89% above the $6.36 spot — a genuinely deep-in-the-money put, meaning most of that $7.24 premium is intrinsic value ($5.64 of it), with the rest being time value on a very long clock
-
⏰ Time on the clock: ≈2.4 years to expiration (December 15, 2028)
-
🎢 Independent delta: ≈−0.285 — a surprisingly low magnitude for something this deep-in-the-money, which tells you FRMI's implied volatility and the long dated tenor are stretching the option's time-value component way out
⚠️ Data caveat — cancel/re-report on the tape: the raw tape carries this trade three times — an original 10,000-lot print at 12:09:44, a cancellation of it at 12:23:40, and a re-report at 12:25:17 at $7.24. That is one trade recorded three ways, not 30,000 contracts. 10,000 is the settled size, and the next-day open-interest snapshot below confirms it exactly.
✅ RESOLVED — Size and Fresh Open Both Confirmed Exactly (updated July 29, 2026)
The July 29 pre-market OPRA snapshot is in, and it landed on the number precisely.
Resolved from the OPRA open-interest snapshot for EOD July 28, 2026. This box replaces the ⏳ provisional flag published on July 28.
| Leg | Baseline OI (Jul 28 snap) | Resolving OI (Jul 29 snap) | Δ | Settled Size | Verdict |
|---|---|---|---|---|---|
| Dec-15-2028 $12 PUT | 0 | 10,000 | +10,000 | 10,000 | ✅ OPEN CONFIRMED (STO) — 100.0% of size |
What this proves: we published the test as "if OI rises to ≈10,000, it confirms the settled size and locks in a clean fresh STO read; if OI comes in meaningfully below 10,000, the cancel further trimmed the position." Open interest came in at exactly 10,000.
That is as clean a resolution as this data ever produces, and it settles both open questions at once:
- The cancel/re-report did not trim anything. The 20,000-contract figure that briefly appeared was the same 10,000-lot trade double-counted across the cancellation and its re-report. The real position is 10,000 contracts, ≈$7.2M in credit.
- This is unambiguously a fresh open. Prior open interest was zero — the contract did not exist before this trade. There is no possible closing interpretation.
⚠️ What the same overnight re-pull also corrected: the mechanism. As detailed in the flow tag above, this printed as a stock-and-options package cross with a matching 270,000-share equity block (≈95% of the option's delta), not as the aggressive unhedged lit sale originally described. So the position is real, new, and exactly 10,000 contracts — but it is delta-hedged, which removes most of the directional signal we originally read into it.
🤓 What This Actually Means — Plain English
Here's the translation: selling a put means you get paid cash today, and in exchange you promise to buy shares at the strike if the buyer wants to hand them to you. Normally that's a bearish-neutral, "I don't think it crashes" trade. But this put is deep in-the-money — the $12 strike is already $5.64 above where FRMI trades — which flips the math: a short deep-ITM put behaves almost exactly like being long the stock. On its own, that option leg gains as FRMI rises and loses as it falls, just like owning shares.
And that is exactly why the hedge matters so much here. The put was not sold on its own. It came as a package with a 270,000-share stock block — roughly ≈95% of the shares needed to cancel the option's directional exposure. Whatever bullish tilt the short put creates on one side of the package, the stock leg on the other side largely offsets. So while everything below correctly describes how a short deep-ITM put behaves in isolation — and it's worth understanding — do not read the package as a leveraged bullish wager on Fermi. Read the option leg's economics as the mechanics of one half of a roughly delta-neutral, negotiated structure.
With that framing in place, here is how the option leg itself works. The seller collected $7.24 per contract, and in return took on an obligation to buy FRMI stock at $12 anytime before December 2028.
- 🎯 The best case: FRMI closes above $12 by December 15, 2028 (≈+89% from today). The seller keeps the entire $7.2M — no shares change hands, pure profit.
- 📉 The other case: FRMI stays below $12. The seller gets assigned stock at $12, but the $7.24 credit already collected lowers their effective cost basis to ≈$4.76 — still a bullish, "I'm fine owning it around here" outcome, not a disaster, unless FRMI keeps sliding well below that basis.
- 🎰 Why the premium is so fat: FRMI's implied volatility is enormous for a $6 stock (more on this below) — a name that went from $21 to $37 to $6 in under a year prices its 2028 options like lottery tickets in both directions.
- 🧩 What this is really betting on: the single event that could re-rate this stock — Fermi signing its first anchor power/lease contract (an OpenAI- or hyperscaler-scale deal). Analysts at Citizens argue that single signature could move shares from single digits toward $19–$350 depending on how much of the 11-17 GW campus eventually gets leased. This put sale monetizes that ≈2.4-year window of optionality: keep $7.2M if the bet plays out, own the stock near a $4.76 basis if it doesn't (yet).
- ⚠️ The real risk isn't the strike — it's the balance sheet: Fermi burns roughly $700M a year, already lost its first prospective anchor tenant (a $150M deal terminated December 12, 2025), and is fighting a securities class action over how that tenant relationship was disclosed. None of that shows up in the option Greeks — it's the honest bear case underneath a bullish-looking trade.
Bottom line in plain English: this isn't "smart money betting FRMI crashes" — and, after the mechanism correction, it isn't "smart money making a leveraged bullish bet on Fermi" either. It's a negotiated stock-and-options package, arranged with a known counterparty, in which a genuinely new 10,000-contract short put position (confirmed exactly by open interest) was established alongside ≈270,000 shares that hedge out most of its direction. Someone now carries this structure, and the payoff scenarios above describe the option half of it — but the package as a whole takes far less of a view on Fermi's future than the raw headline "$7.2M put sale" suggests.
📈 Technical Setup / Chart Check-Up
YTD Performance Chart
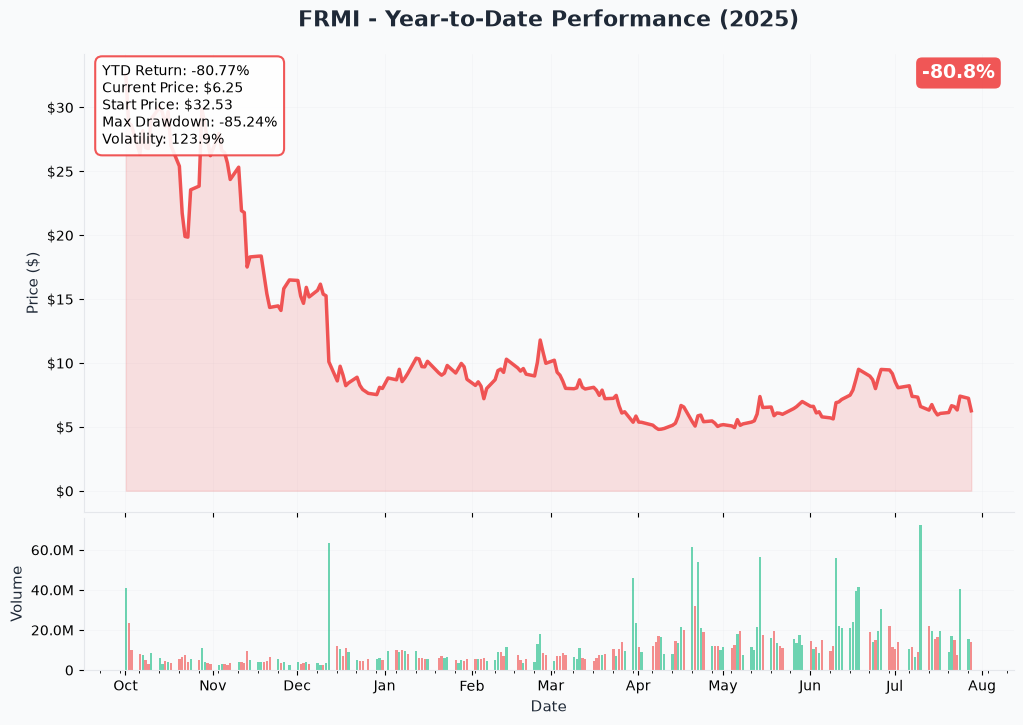
FRMI's chart tells the whole story at a glance: an October 2025 IPO at $21, a spike toward $36.99, and a grinding collapse down to ≈$6.36 today — a stock that has round-tripped more than 5x in under a year. That collapse coincides almost exactly with the December 2025 anchor-tenant termination and the securities litigation that followed. The $12 strike this put seller wrote against sits roughly midway between today's price and where the stock traded as recently as this spring — not an outlandish target, just an aggressive one on the current timeline.
Gamma-Based Support & Resistance Analysis
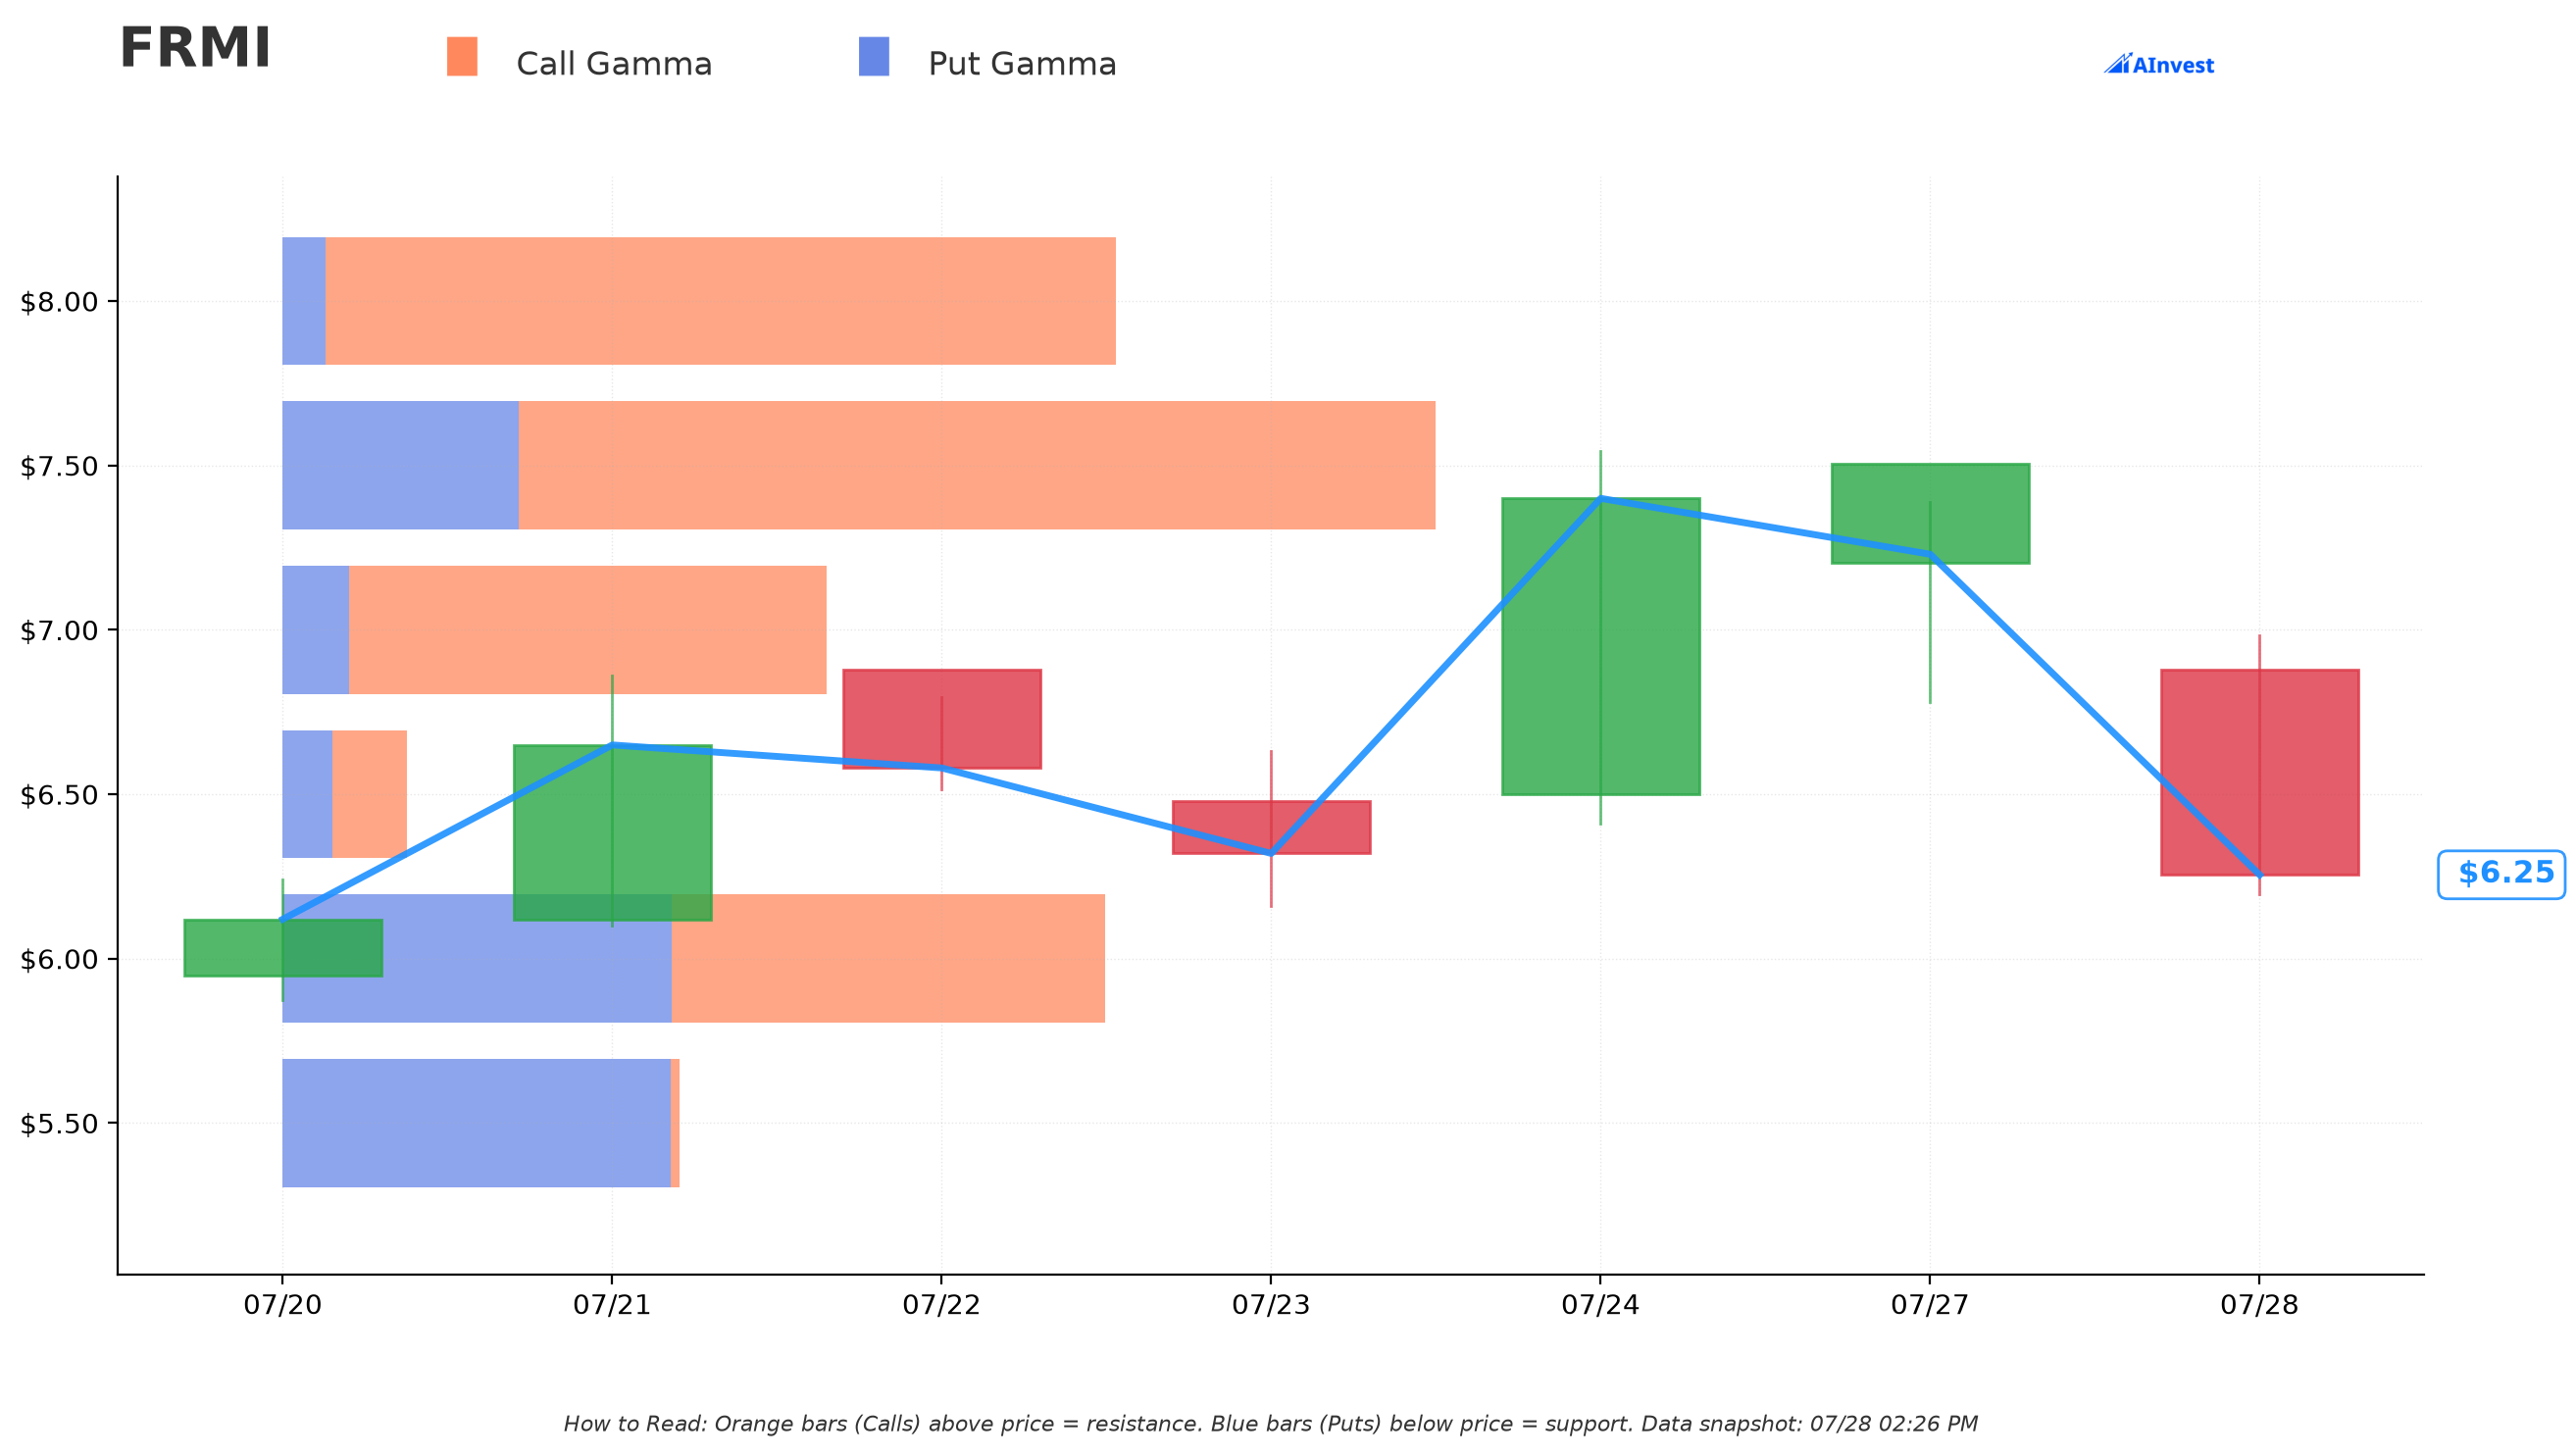
Current Price: ≈$6.25-$6.36
- 🔵 Support: $6.00 — the nearest meaningful gamma concentration below spot, tagged "Strong" (net gamma ≈+0.29, mostly balanced call/put exposure). This is roughly where dealer hedging currently anchors price on pullbacks.
- 🟠 Resistance: $7.50 — the first real call-gamma wall above spot (net gamma ≈+4.45, the largest net-positive concentration on the board)
- 🟠 Resistance: $8.00 — a second call-heavy zone (net gamma ≈+4.88)
- 🟠 Resistance: $10.00 — the biggest single gamma concentration in the whole chain (total gamma ≈8.34, nearly all call-side), sitting well below the $12 strike this put was sold against
What this means for traders: the options market currently has real structural resistance clustering at $7.50, $8, and $10 — all still short of the $12 strike in this trade. That's a useful sanity check: dealers and other options traders aren't yet pricing meaningful positioning at $12 itself, which tells you this particular $12 put seller is taking a longer, more aggressive view than what the rest of the gamma map currently reflects.
Implied Move Analysis
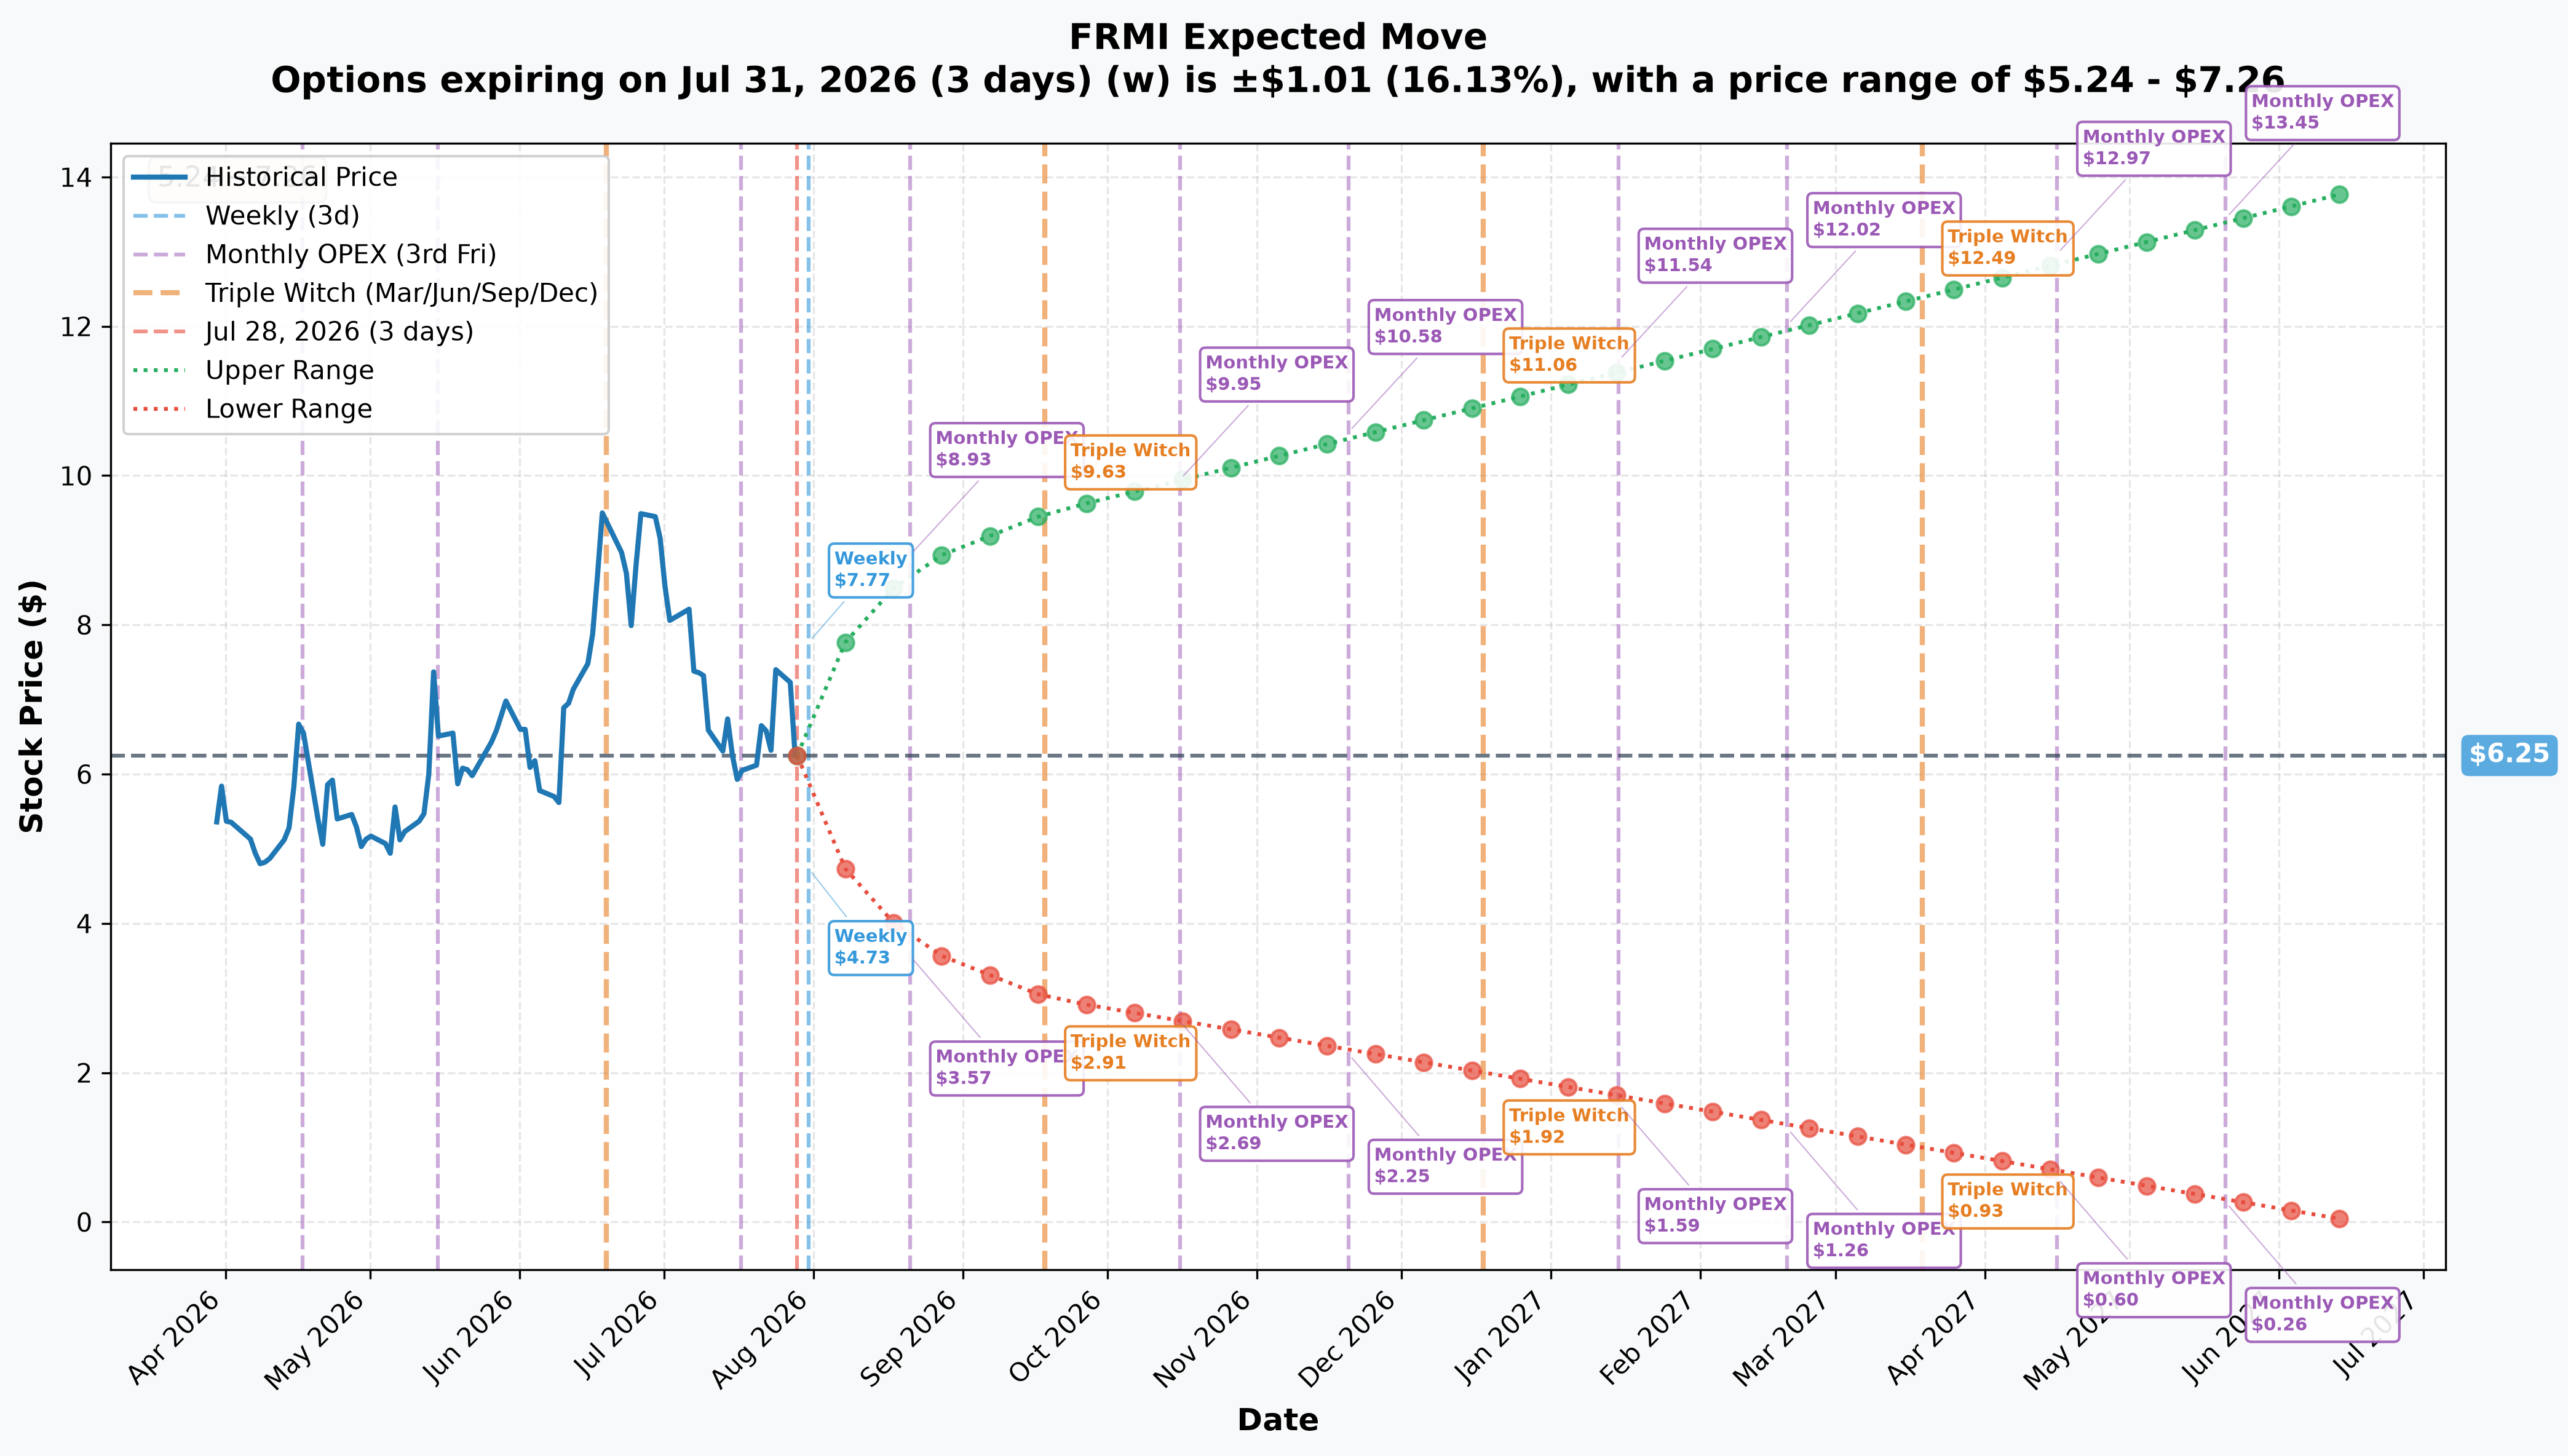
Options market pricing for upcoming expirations (from a $6.25-$6.36 reference spot):
- 📅 Weekly (July 31 — 3 days): ±$1.01 (±16.1%) → Range: $5.24 - $7.26
- 📅 Monthly OPEX (August 21 — 24 days): ±$2.53 (±40.45%) → Range: $3.72 - $8.78
- 📅 Quarterly Triple Witch (September 18 — 52 days): ±$3.25 (±52.05%) → Range: $3.00 - $9.50
- 📅 Longest reliable maturity (June 17, 2027 — 324 days): ±$7.58 (±121.3%) → Range: $0 - $13.83
Translation for regular folks: this is an enormous implied move for any stock — even the monthly options market is pricing a ±40% swing by August 21. Notice that the $12 strike sits above even the upper edge of the monthly range ($8.78) and is only reached near the top of the ≈10-month implied-move envelope ($13.83 upper bound). That confirms just how deep-in-the-money and long-dated this put sale really is: the seller isn't betting on a near-term pop, they're betting the multi-year trajectory clears $12, using a strike that today's shorter-dated options market doesn't even price as a realistic monthly outcome.
🎪 Catalysts
Important: the December 15, 2028 option expiration is NOT itself a company catalyst — it's simply the risk horizon of this trade. Every event that actually moves FRMI shares happens well before that date.
✅ Recent Catalysts (Already Happened)
$150M Anchor-Tenant Termination (December 12, 2025): Fermi's first prospective anchor tenant pulled out of a $150M Advance-in-Aid-of-Construction agreement over a pricing dispute; the stock fell roughly 34% on the news — this is the single biggest driver of the collapse from $37 to single digits.
Securities Class Action Filed: Following the tenant termination, a securities class action (Hagens Berman) alleges Fermi misrepresented Project Matador demand and tenant stability during the IPO window (class period October 1 – December 11, 2025); the lead-plaintiff deadline passed March 6, 2026, and the case is ongoing.
OpenAI Capacity Speculation (June 11, 2026): Shares surged ≈26% on reports that OpenAI was evaluating power capacity at Project Matador — no formal deal was ever announced, pure speculation, but it shows how violently this stock reacts to tenant headlines.
$431.25M Upsized Convertible Notes (July 2026): Fermi priced an upsized $431.25M, 5.00% convertible note due 2031 with a capped-call structure designed to limit dilution unless shares more than double — funding for Project Matador's buildout, but also a reminder this is a company that finances itself through debt and equity markets, not operating cash flow.
Project Matador Progress: Fermi signed a Primoris Energy Services EPC agreement for the first six gas turbines, secured an Electric Service Agreement with Xcel Energy's Southwestern Public Service subsidiary for up to 200 MW, and secured a natural-gas pipeline interconnect for the campus — real construction progress, but none of it is a signed tenant.
🔥 Upcoming Catalysts (Next ≈6 Months)
Q2 2026 Earnings — August 13, 2026 (confirmed date): Release at 7:00 a.m. ET, call at 9:00 a.m. ET. As a pre-revenue developer, the numbers that matter are cash burn, runway after the $431M convert, capex pace, megawatt-energized progress, and any tenant/LOI language — not EPS.
First Anchor Tenant / Power Contract (un-dated, the real needle-mover): This is the single most important catalyst for the entire thesis. Citizens initiated coverage at Market Outperform, arguing a single anchor contract (expected 1H26, not yet signed) could put the stock on a path toward $19-$350 as the 11-17 GW campus gets leased out. It hasn't closed yet — continued delay is the core bear risk.
≈1.1 GW First Power Energized (target: end of 2026): An execution milestone tied to the Primoris/Siemens turbine buildout, separate from — but supportive of — the tenant-signing thesis.
Analyst targets: Consensus is roughly 6 Buy / 2 Hold / 0 Sell with an average target near $19-$20; Cantor Fitzgerald carries a more conservative $8 Buy target, while Citizens' bull case stretches to $350+ long-run if the full campus gets leased.
👥 How Four Different Traders Might Read This
Fair warning before any of this: FRMI is a pre-revenue, single-project, high-litigation-risk name with a 5x round-trip in under a year. None of the ideas below are a template to copy blindly — size everything as speculative.
🎲 YOLO Trader
Selling 10,000 deep-ITM LEAP puts on a $6 pre-revenue REIT — even hedged with ≈270,000 shares, as this one was — is an institutional-scale, margin-intensive trade negotiated as a package with a known counterparty. It is not something to replicate directly; the collateral requirement alone (potentially buying $12M+ of stock at $12), plus the need to execute and carry the equity leg alongside it, makes this a professional-desk position, not a retail-sized one.
If you want defined-risk, lottery-ticket exposure to the same bullish story (a tenant contract finally landing), the retail-shaped version is a small clip of short-dated, moderately OTM calls into a real catalyst like the August 13 earnings call, where your maximum loss is the premium you paid — not an open-ended obligation to buy stock at $12.
Risk level: EXTREME | Skill level: Advanced only — this exact trade isn't retail-sized to begin with.
📈 Swing Trader
The next real catalyst is August 13, 2026 earnings, well inside the ±40.45% implied move priced into the August 21 monthly options ($3.72-$8.78 range). That's the tradable window — not the 2028 expiration in this trade.
A defined-risk way to play it: a short-dated debit call or put spread sized to that implied range, watching specifically for cash-runway commentary and any tenant/LOI language on the call — those are the two things most likely to move the stock sharply either way.
Risk level: High (binary earnings event on a volatile pre-revenue name) | Skill level: Intermediate.
💵 Premium Collector
The option leg is structurally what a premium collector does — sell rich, elevated implied volatility and bank the credit — but note the two things that separate this from a retail version. First, the strike and duration are extreme (deep-ITM, 2.4 years, on a name that can move 25%+ on a single headline). Second, and more instructive: it came with a delta hedge attached. The desk did not simply sell volatility and take the directional risk; it sold the option and simultaneously took on ≈270,000 shares to neutralise most of that risk. That is the professional version of premium collection — isolating the volatility exposure you actually want and hedging away the one you don't.
The transferable lesson, not the trade itself: FRMI's IV is exceptionally rich because of its binary tenant-contract risk. If you already believe in the long-term Project Matador story and are comfortable owning shares near a ≈$4.76 effective basis, a smaller, more conservative cash-secured put at a strike closer to (or below) spot — with a shorter duration you can actually manage — captures similar thesis exposure with materially less risk than this 10,000-lot, 2.4-year bet.
Risk level: High if replicated at any real size — this is a leveraged, undefined-risk position | Skill level: Intermediate-to-advanced; never sell puts sized beyond what you're genuinely willing to be assigned.
🌱 Beginner
Here's the simple version: selling a put means getting paid cash today for a promise — "I'll buy your FRMI shares at $12 anytime before December 2028, if you want to sell them to me." Since FRMI trades at $6.36 today, that's a promise to pay almost double today's price — which sounds crazy until you remember the seller also believes the stock might genuinely get there if Fermi lands a major tenant contract.
The critical thing to understand: a deep-in-the-money put sale like this is economically similar to being long the stock — it goes up when FRMI goes up, and down when FRMI goes down, just with a cash cushion (the $7.24 premium) built in. That's genuinely advanced-trader territory — a pre-revenue, single-project company with a live lawsuit and $700M/year in cash burn is not a place to learn short options for the first time. If FRMI's story interests you, start by understanding the business itself (AI-power infrastructure, Project Matador) and consider a small, defined-risk long call or long stock position — where your maximum loss is capped and known upfront — before ever considering selling options.
Risk level: N/A — educational only | Skill level: Beginner-friendly explanation of an advanced trade.
⚠️ Honest Limits — What The Tape Can and Can't Prove
What we know for certain (PROVEN from the tape and next-day open interest):
- ✅ FRMI Dec-15-2028 $12 puts were sold for $7.24 each at 12:25:17 ET, settling at a 10,000-contract size — the cancel/re-report on the tape is one trade recorded three times, not extra size
- ✅ Open interest went 0 → 10,000, exactly matching the settled size — the size and the fresh open (STO) are both confirmed to the contract, and prior OI of zero rules out any closing interpretation
- ✅ The trade printed as a stock-and-options package cross — a negotiated, off-book transaction with an equity leg and a known counterparty (corrected July 29; originally described as a below-the-bid lit sale)
- ✅ A 270,000-share equity block at $6.447 printed in the same window, versus ≈285,000 shares implied by the option's ≈−0.285 delta — a ≈95% match, confirming a genuine delta hedge
What we got wrong on July 28, stated plainly: we described this as an aggressive sale "below the displayed bid" and as "unhedged." Both were errors flowing from one root cause — misreading the trade's mechanism. On a negotiated cross the print's position relative to the bid carries no urgency information, and a stock-and-options package has an equity leg by definition. Re-pulling the tape found that leg.
What we're inferring (reasonable, but not proof):
- 🔍 That the two legs were arranged as one package rather than being coincidental same-window flow — the ≈95% delta match and the package-cross trade type both support it, but OPRA does not label the pairing explicitly
- 🔍 Which counterparty ended up holding which leg, and therefore who carries the residual risk — the tape shows the package, not its allocation
What OPRA data flatly cannot tell us:
- ❌ Who either party is (retail, institutional, market maker) or their broker
- ❌ Whether either side holds further offsetting positions elsewhere
- ❌ Whether they intend to hold to December 2028 or actively manage/close this well before then
- ❌ The motive behind the package — financing, inventory management, or a genuine long-dated view on Fermi are all consistent with what we can see
Disclaimer: Options trading involves substantial risk of loss and is not suitable for all investors — selling puts, especially naked/uncovered ones, carries real risk of being assigned stock at a loss if the underlying falls further. This analysis is for educational purposes only and is not financial advice. FRMI is a pre-revenue, single-project, high-litigation-risk small/mid-cap with heavy cash burn and dilution risk; past performance doesn't guarantee future results. Always do your own research and consider consulting a licensed financial advisor before trading, especially with strategies involving short options positions.
Mark your calendar:
- ✅ July 29, 2026, ≈06:30 ET — RESOLVED. Next-day OPRA open interest came in at exactly 10,000 (from 0), confirming both the settled size and the fresh open. See the ✅ RESOLVED box above.
- 📅 December 15, 2028 — this position's expiration.
Last updated: July 29, 2026 — two updates. (1) Next-day OPRA open interest resolved the provisional flag exactly: 0 → 10,000 (+10,000, 100% of the settled size), confirming a clean fresh STO and proving the cancel/re-report did not trim the position. (2) A re-pull of the tape corrected the mechanism: this printed as a stock-and-options package cross with a matching 270,000-share equity block (≈95% of the option's delta), not as the aggressive below-the-bid unhedged lit sale originally published. The headline, quick take, flow tag, plain-English section and honest-limits section were rewritten accordingly.