🐻 GLD $18M ITM Put Block — A Hawkish-Fed Hedge on Gold Into September
📅 June 15, 2026 | 🔥 Unusual Activity Detected
✅ Updated 2026-06-16: Next-day OPRA OI confirms a (partial) open — the Sep $410 put rose 3,204 → 10,707 (Δ +7,503). A real new bearish/hedge position, though about half the 15,000-lot block offset against existing holders rather than creating fresh interest.
🎯 The Quick Take
A desk quietly worked an $18M block of in-the-money puts on GLD — the world's largest gold ETF — with the strike sitting ≈$13 above where GLD was trading at print time. Despite the screenshot showing "above ask" (which looks like aggressive buying), the tape tells a different story: this was a floor-negotiated, paired block trade with a known counterparty — not a panicked lit sweep. Someone with conviction on the bearish-gold thesis, or a desk hedging a sizable bullion book, positioned for gold to keep sliding into September. The timing is sharp: gold is in its deepest drawdown of the 2026 cycle on a hawkish-Fed repricing, and the September 18 expiry falls just one day after the September FOMC.
📊 Fund Overview
SPDR Gold Shares (GLD) is the oldest and largest physically-backed gold ETF in the U.S., launched in 2004. Each share represents a fractional allocated claim on real gold bullion held in secured vaults — not futures, not paper contracts. When you buy or sell GLD options, you are effectively betting on the gold price itself.
- AUM: ≈$100B+, the largest gold ETF by a wide margin
- Expense ratio: 0.40% per year
- What it tracks: Spot gold, nearly tick-for-tick
- GLD share price at trade time: $396.89 (each share ≈ 1/10 troy ounce, so ≈$3,969/oz implied)
- 2026 All-Time High: gold peaked at $5,589/oz on January 28, 2026 — GLD equivalent ≈$559
Because each GLD share is roughly one-tenth of an ounce, all option mechanics in this article — strike, premium, breakeven — are in GLD share-price terms.
💰 The Option Flow Breakdown
📊 The Tape — June 15, 2026
| Time | Buy/Sell | Type | Expiration | Premium | Strike | Volume | OI | Size | Spot | Option Price | Option Symbol |
|---|---|---|---|---|---|---|---|---|---|---|---|
| 14:44:07 | BUY | PUT $410 | 2026-09-18 | $18M | $410 | 15,000 | 3,200 | 7,500 | $396.89 | $24.08 | GLD20260918P410 |
Flow type: 🤝 FLOOR-NEGOTIATED BLOCK — this is NOT an aggressive lit sweep, despite the "above ask" label on the screenshot. The tape shows a floor-negotiated, paired multi-leg block where a desk worked a sizable position with a known counterparty off the displayed book. A broker matched the two sides; no open-book liquidity was consumed. The "above ask" screenshot artifact is a condition-code labeling artifact, not evidence of urgent buying. Do not read aggression into this.
Note on size: The raw volume field shows 15,000, but the tape carried a cancelled 7,500-contract duplicate. The true net size is 7,500 contracts — the cancellation busted the duplicate print. Do not double-count.
ITM status: The $410 put is in-the-money — the strike ($410) sits above where GLD is trading ($396.89), making the put already ≈$13.11 intrinsically valuable at print time. This is not an out-of-the-money lottery ticket. It is a high-delta, defined-risk position.
✅ RESOLVED — Next-Day OI Confirms a (Partial) Open (2026-06-16)
| Leg | Pre-print baseline (EOD 2026-06-12) | Resolving (EOD 2026-06-15) | Δ | Verdict |
|---|---|---|---|---|
| Sep-18 $410P | 3,204 | 10,707 | +7,503 | OPEN — net-new bearish/hedge put (partial) |
The next-morning OPRA snapshot confirms a real open: open interest rose from 3,204 to 10,707, a net +7,503. That is a genuine new bearish/hedge gold put. The nuance: the block was ≈15,000 contracts but net OI grew only +7,503, so roughly half was a transfer/offset against existing holders rather than brand-new interest. Net-new positioning is on the order of ≈7,500 contracts — meaningful, but smaller than the headline size.
🤓 What This Actually Means — Plain English
Let's decode this for everyone, zero jargon assumed.
What happened: A desk — this is not a retail account — bought 7,500 contracts of the GLD September-18-2026 $410 put for $24.08 per share. Each contract covers 100 shares, so 7,500 × 100 × $24.08 = ≈$18M in total premium paid. This is a bearish (or hedging) bet that GLD will be below $410 by September 18, 2026.
Why in-the-money? GLD closed at $396.89 when this printed. The $410 put is already $13.11 "in the money" — meaning if the option expired today, it would be worth $13.11 per share in intrinsic value alone. The $24.08 price you see on the tape = $13.11 intrinsic + ≈$10.97 of time value (the premium for having until September 18 for the thesis to play out further).
Breakeven at expiry: The buyer profits if GLD is below $410 − $24.08 = $385.92 at the September 18 close. GLD is currently at $396.89, so the breakeven is ≈$11 below current spot — roughly a 2.8% further decline from here. The put is already partially working.
Why is this a FLOOR BLOCK and not a lit sweep? A lit sweep means a market participant was so urgent they swept displayed offers on multiple exchanges, willing to pay up to fill a large order immediately. A floor-negotiated block is the opposite — a desk arranged a deal with a known counterparty ahead of time, walked it to the floor to execute cleanly with minimal market impact. No book was swept. No urgency. This is institutional positioning, not a panic signal. The "above ask" label in the screenshot is a mechanism artifact, not evidence of aggression. Always read the tape, not the label.
Why the September 18 expiry matters: The September FOMC meeting is scheduled for September 16–17, 2026 — one day before this put expires. That is not a coincidence. If the Fed signals a rate hike (or a sustained hawkish hold) at that meeting, real yields rise, the dollar strengthens, and gold faces fresh selling pressure. The buyer gets maximum gamma exposure right into the most pivotal Fed meeting of the second half of 2026.
Two ways to read this: (1) Directional bearish bet — the buyer thinks gold keeps falling from $396.89 toward or below $385.92 over the next ≈95 days. (2) Portfolio hedge — a desk long gold (bullion, miners, or other gold ETFs) is buying protective puts to cap downside risk through September. A hedge buyer does not need to think gold falls; they just need to sleep at night while holding a large bullion book. Floor blocks of this size are common for institutional hedges.
📈 Technical Setup
YTD Performance
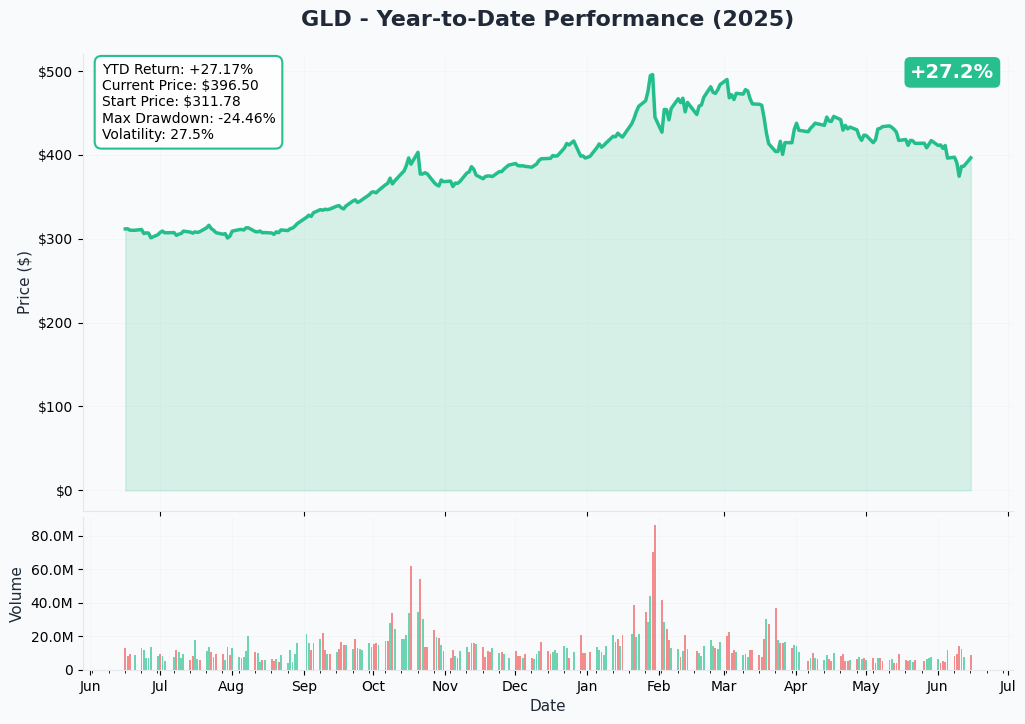
GLD has had an extraordinary — and bruising — 2026. Gold printed an all-time high of ≈$5,589/oz (GLD equivalent ≈$559) on January 28, 2026, and has since entered its deepest pullback of the current cycle, per Finance Magnates' June 2026 gold analysis. The YTD peak-to-trough drawdown is ≈22–25%, a sharp reversal from the January euphoria.
The selling accelerated dramatically in May–June on a hawkish-Fed repricing. Per Capital.com's gold price forecast (June 10, 2026), spot now trades below its 20-day, 50-day, and 200-day exponential moving averages — a bearish alignment across all major timeframes. GLD at $396.89 on June 15 is down meaningfully from its January highs, but the month-over-month picture is the most painful: −10.88% from mid-May to mid-June per Fortune's June 12 gold tracker. Year-over-year, gold is still +25.86%, which explains why there are plenty of long-term holders with gains to protect.
Gamma-Based Support & Resistance
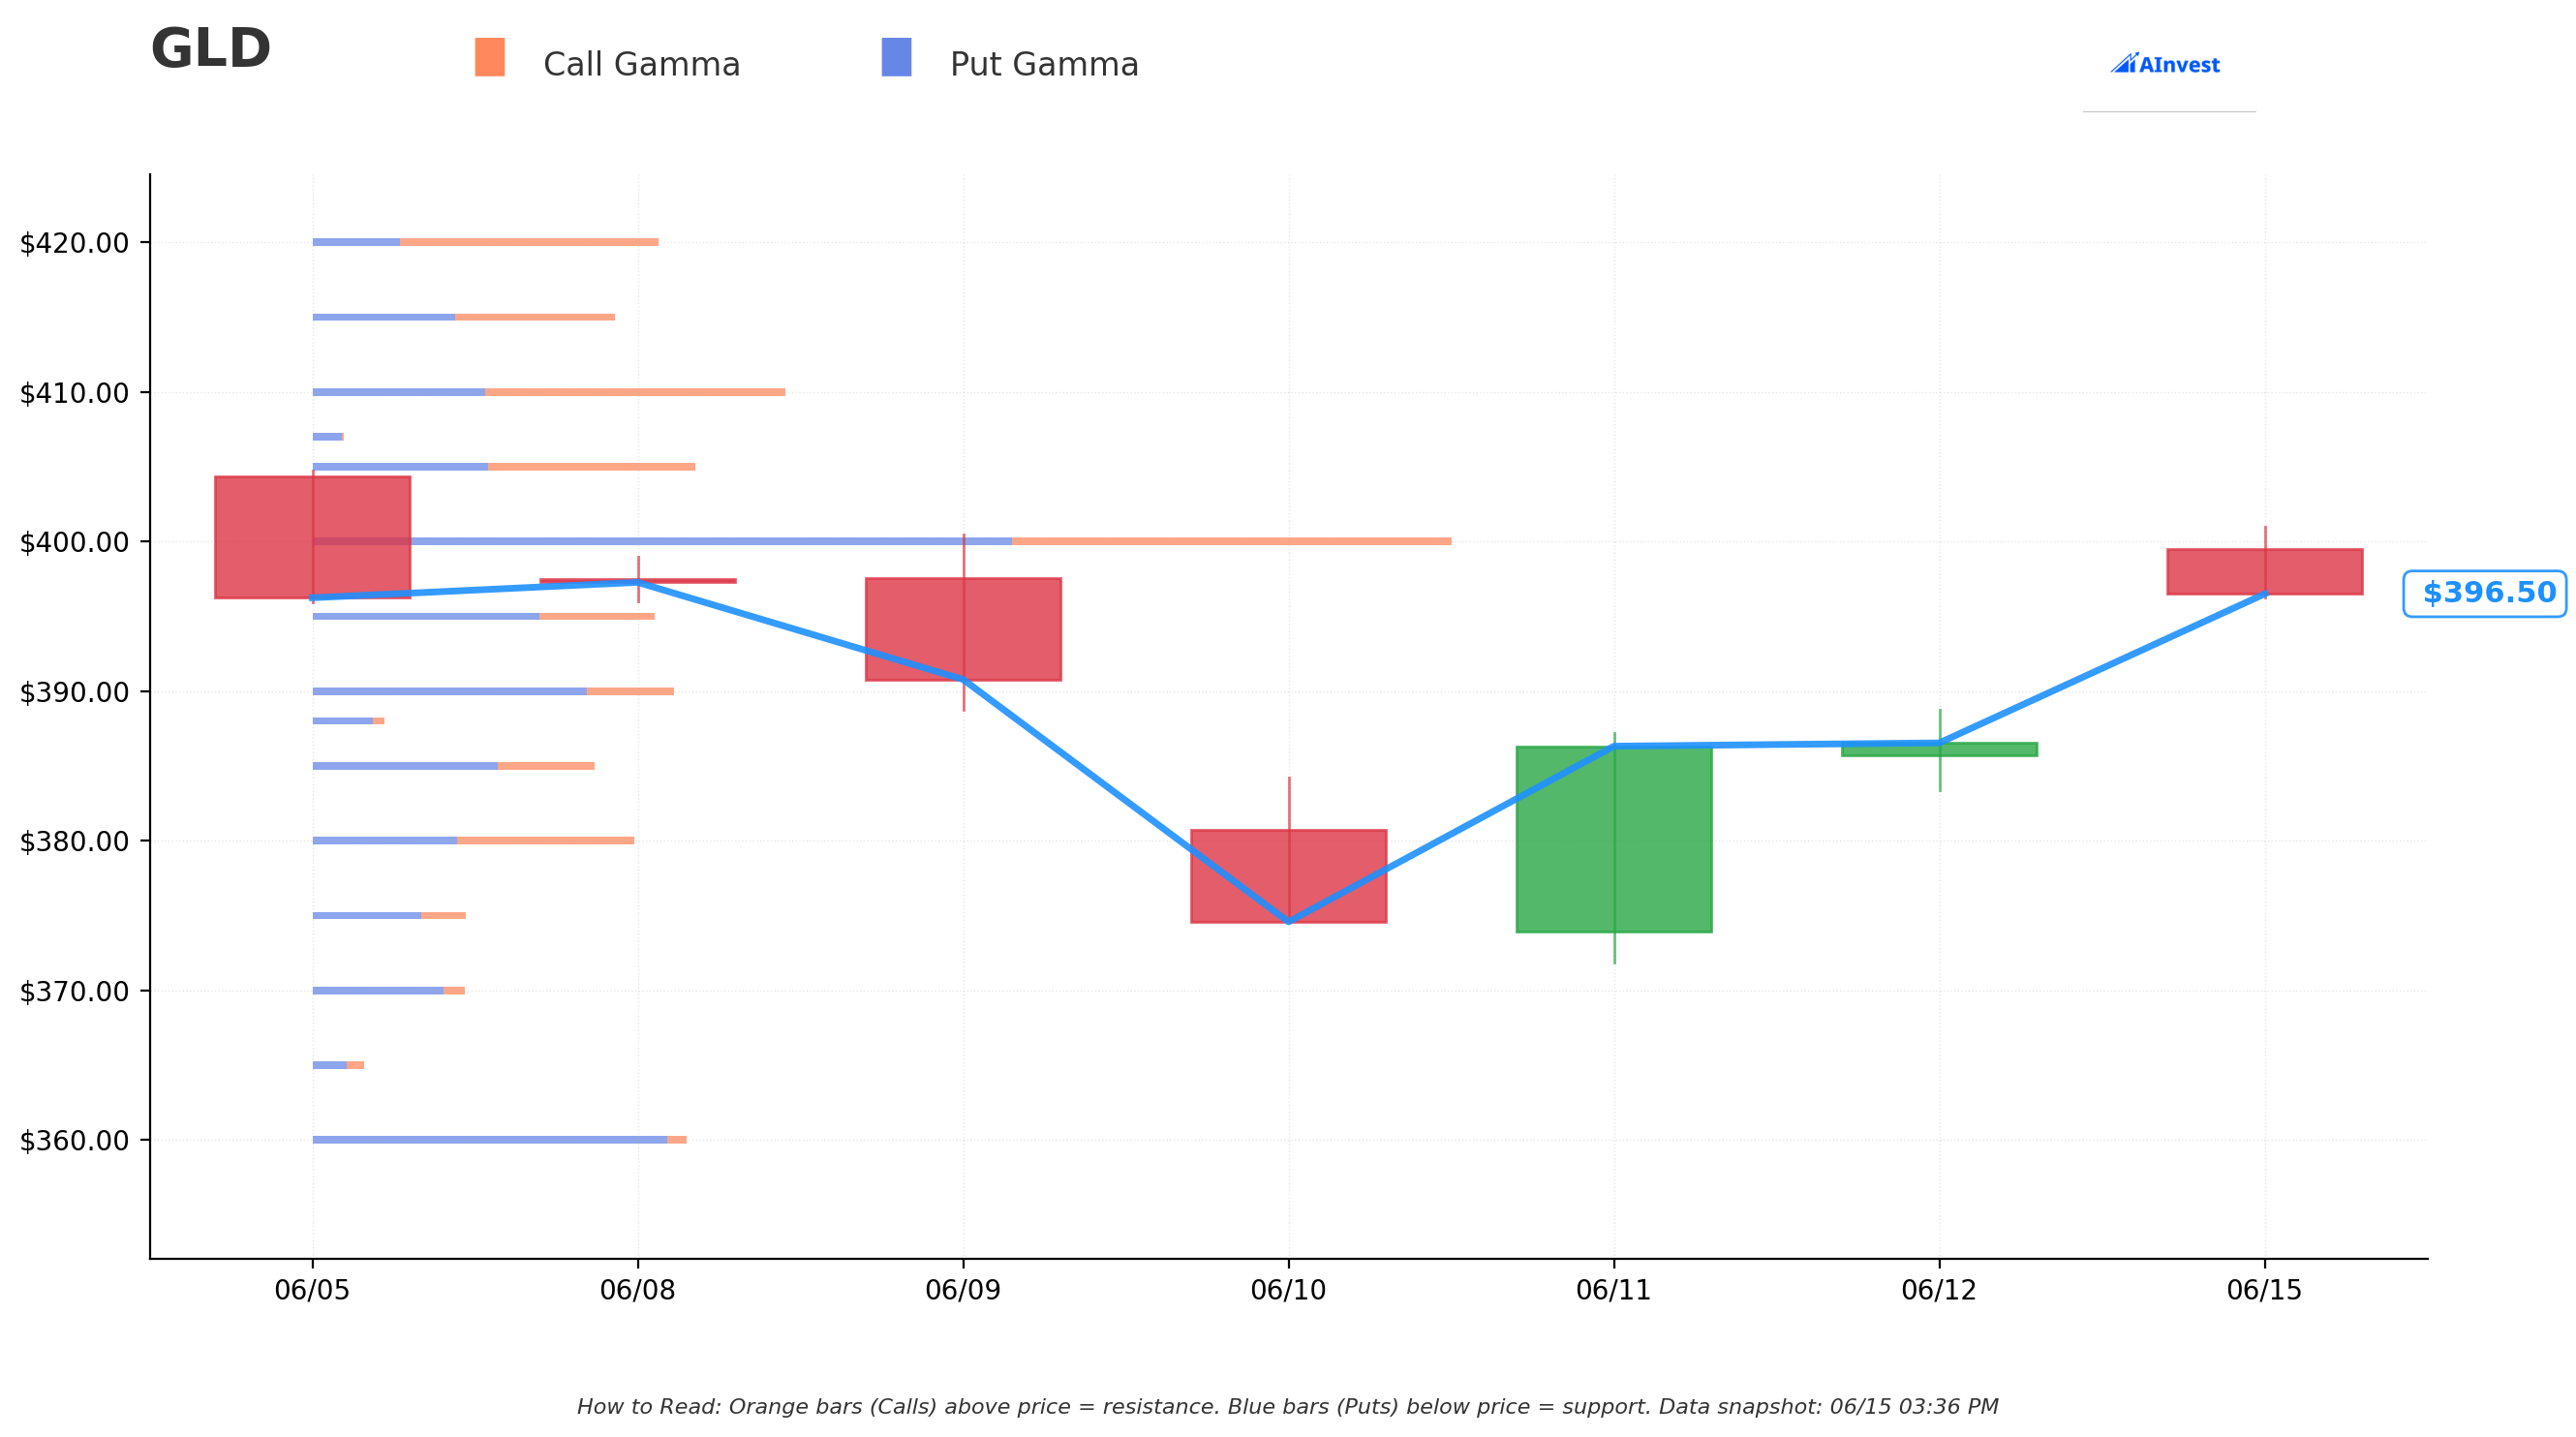
The gamma exposure chart shows where market-maker hedging activity creates gravitational force at specific price levels. The bigger the bar, the stronger the magnetic pull. GLD spot at print time ≈$396.41.
🔵 Support Levels (Put Gamma — market makers tend to buy near these, cushioning declines):
| Level | Strength | Notes |
|---|---|---|
| $395 | Very Strong | Immediate floor — just below current spot; the nearest gamma cushion |
| $390 | Very Strong | Secondary support; a clean close below $395 opens this level |
| $380 | Very Strong | Major structural floor; a large put-gamma concentration provides a deeper cushion |
🟠 Resistance Levels (Call Gamma — market makers tend to sell near these, capping rallies):
| Level | Strength | Notes |
|---|---|---|
| $400 | Very Strong | The DOMINANT gamma wall — by far the largest concentration in the entire chain (total GEX 76.6 vs. the next biggest at 31.8). Any rally toward $400 faces heavy selling pressure from market-maker hedging. |
| $405 | Very Strong | Secondary resistance above the $400 wall |
| $410 | Very Strong | The traded put strike — also a significant gamma resistance level (total GEX 31.8) |
What this means in plain terms: GLD is sandwiched between the $395 gamma support (≈$1.41 below current spot) and the massive $400 gamma resistance (≈$3.59 above current spot). The $400 level is the single biggest gamma wall in the GLD chain right now — a ceiling that market makers will mechanically defend by selling calls and managing their delta as price approaches it. The put buyer specifically targeted the $410 strike — which sits just above this ceiling — as their reference point for the bearish thesis. If gold cannot reclaim $400 decisively, time works in favor of the put holder.
Implied Move Analysis
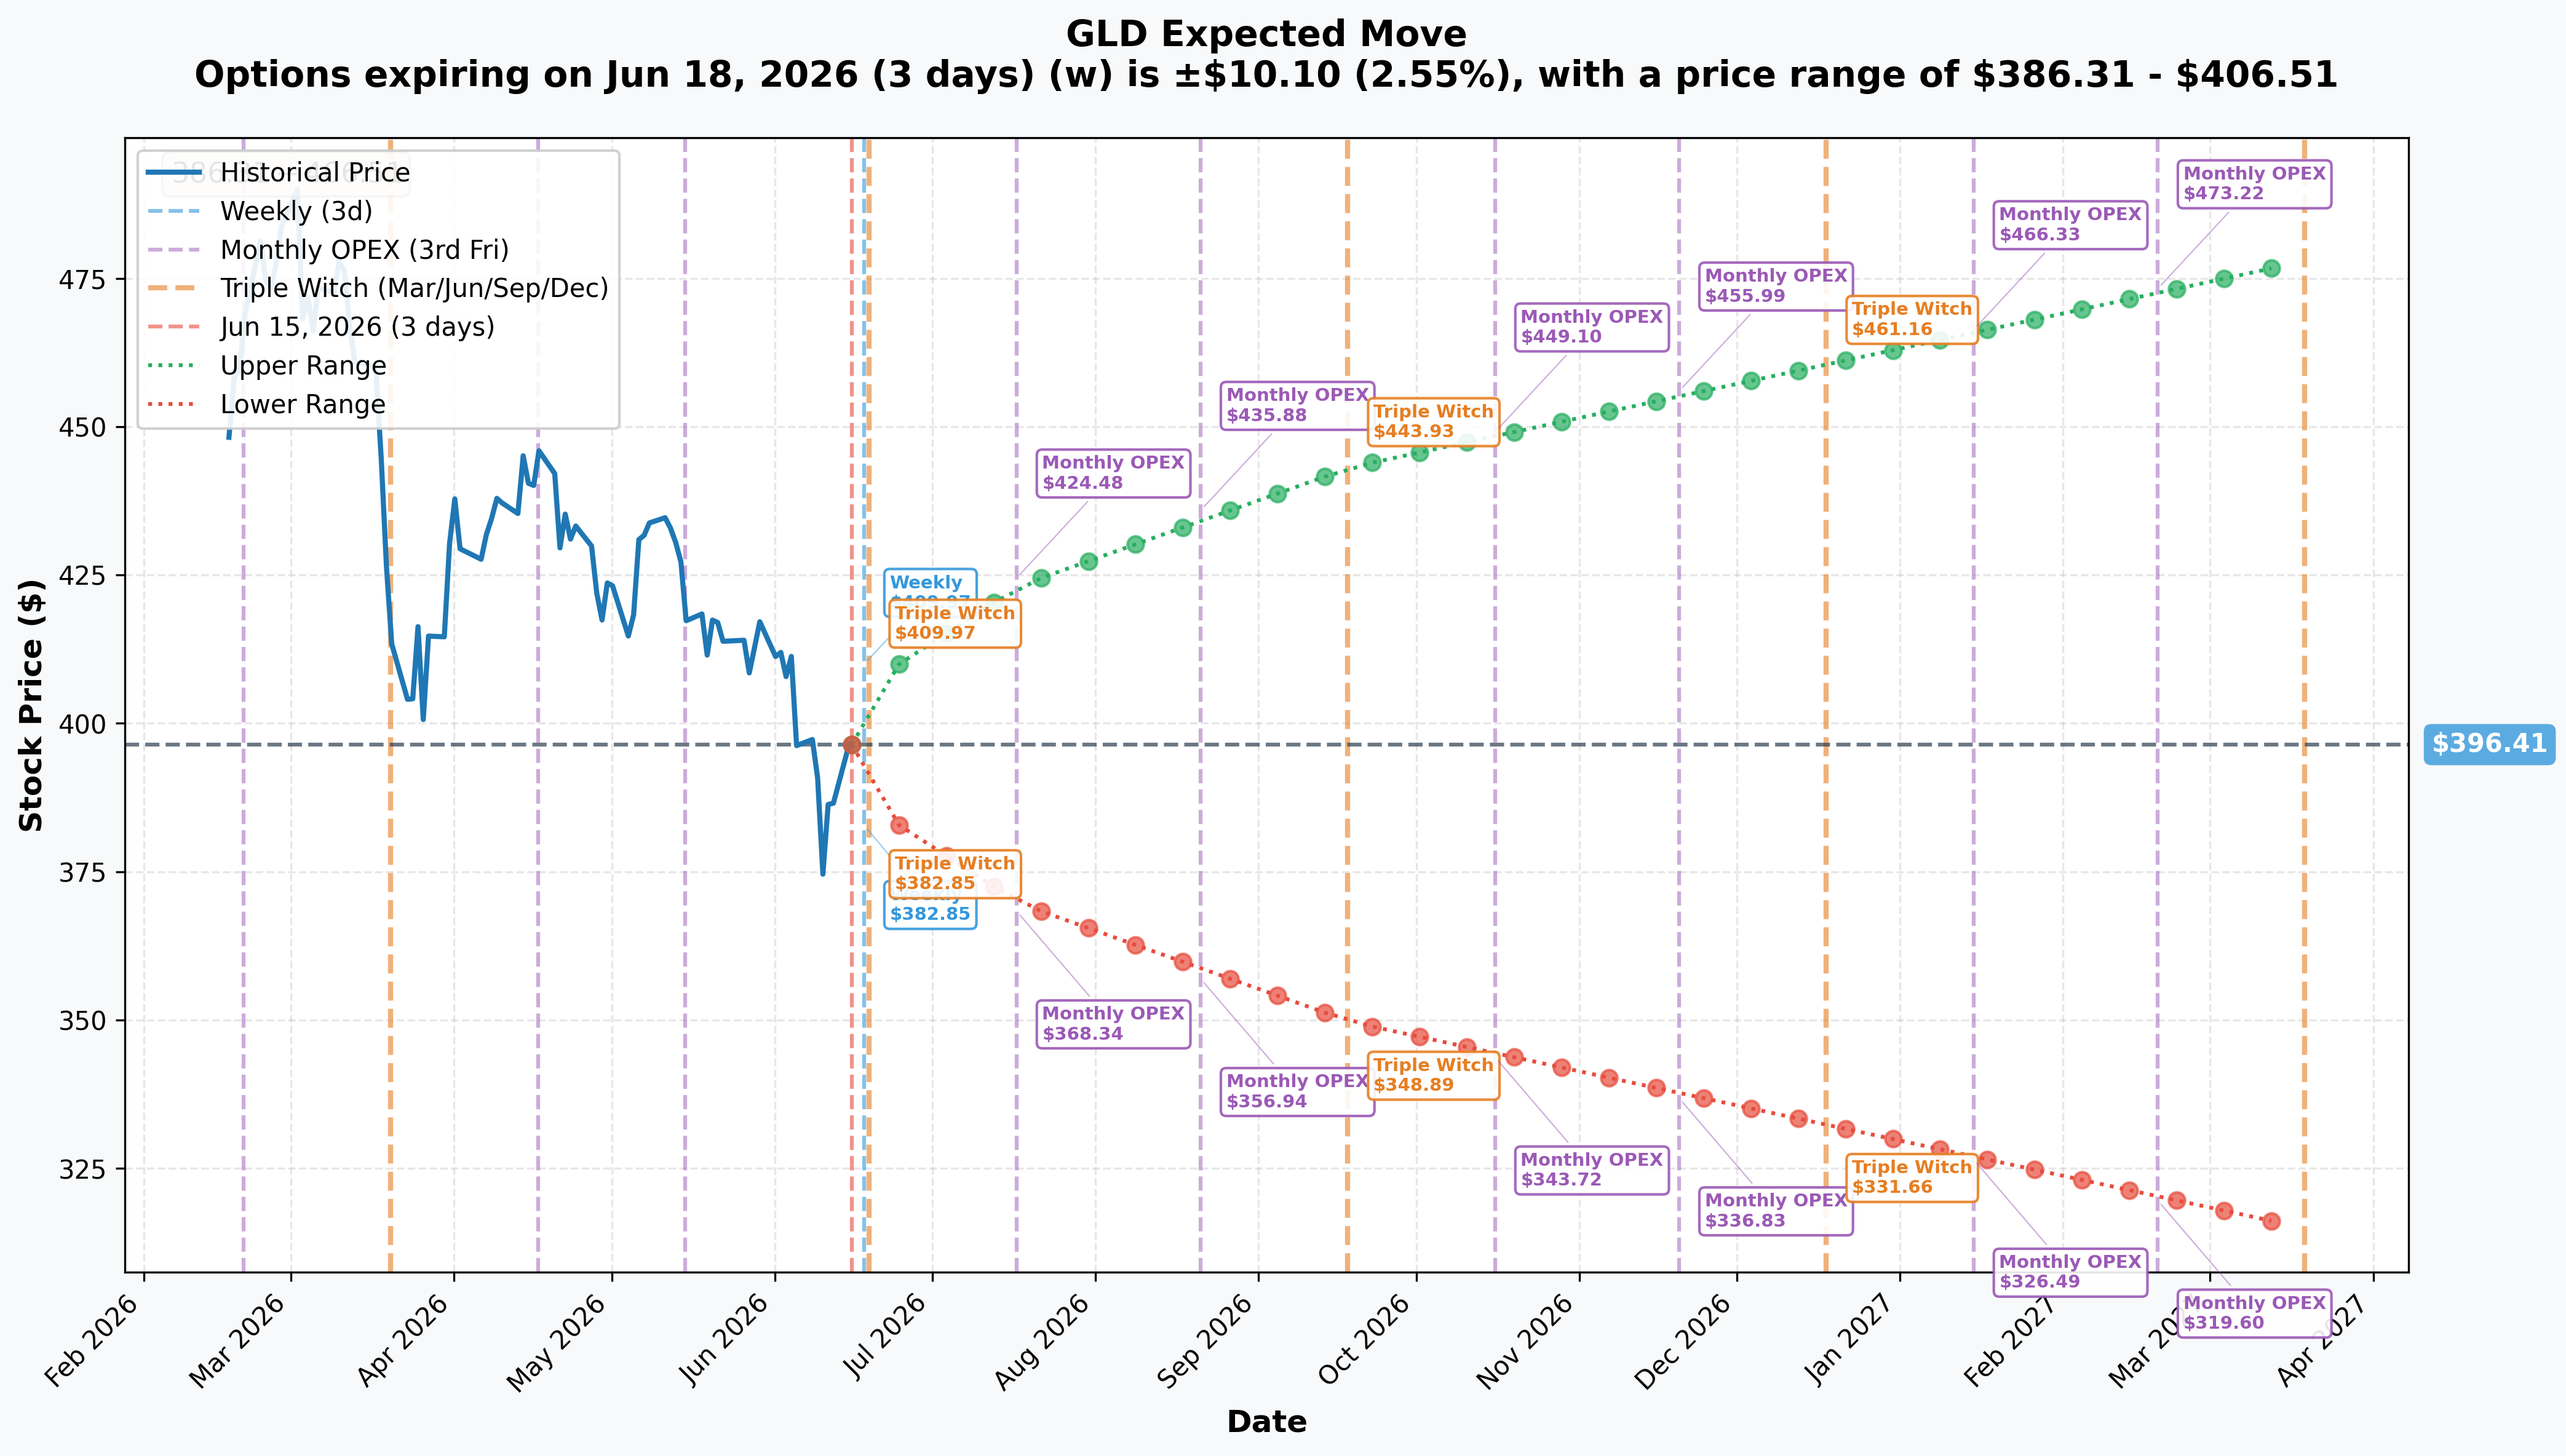
The options market is pricing the following move ranges from GLD ≈$396.41:
| Expiration | Implied Move | Low | High | Notes |
|---|---|---|---|---|
| Weekly (2026-06-18) | ≈±2.55% (±$10.10) | $386.31 | $406.51 | FOMC lands June 16–17 — binary catalyst inside this window |
| Monthly OPEX (2026-07-17) | ≈±6.76% (±$26.80) | $369.61 | $423.21 | June CPI (July 14) lands just before this expiry |
| Quarterly (2026-09-18 — this put's expiry) | ≈±11.79% (±$46.75) | $349.66 | $443.16 | September FOMC Sep 16–17 is one day before expiry |
Key observations:
The September 18 quarterly range spans $349.66 to $443.16. A few takeaways:
- The put's breakeven is $385.92 — well inside the downside of the implied range ($349.66 low). The options market is pricing a non-trivial probability that GLD could trade there.
- The $410 strike sits inside the upside of the quarterly implied range ($443.16 high). If gold rallies back toward $410 by September 18, the put loses most of its ≈$10.97 time-value premium and approaches pure intrinsic at ≈$0 (if GLD is at or above $410, the put expires worthless or near-worthless).
- The weekly range (±2.55%, $386.31 to $406.51) straddles the $395 gamma support and $400 gamma wall. Watch whether GLD holds the $395 level through this week's FOMC.
🎪 Catalysts
🔥 Already Happened — Why Gold Has Been Selling Off
Hawkish-Fed repricing on a 172,000-job blowout (June 5–6, 2026): The single biggest catalyst driving gold lower. May non-farm payrolls printed 172,000 — roughly twice the consensus forecast of ≈80,000–85,000 — blowing out expectations and pushing the market to price a rate hike back onto the table, per Capital.com's June 10 gold forecast and BullionVault's jobs-shock analysis. London gold lost 3.9% in a single Friday session on that data. Year-end rate expectations rose to ≈3.87%, with CME futures pricing ≈80% odds of a hike by year-end per IndexBox's FOMC preview. As a zero-yield asset, gold loses ground when real yields rise and rate-cut dreams evaporate.
May CPI spiked to 4.2% YoY — highest since April 2023: Per CNBC's May CPI report (June 10, 2026), headline inflation came in at 4.2% YoY and +0.5% MoM, with core at +2.9%. This is the inflation profile that pins the Fed in place. Hot inflation raises real yields (bearish gold) and removes rate-cut catalysts (also bearish gold). The old rule that "gold loves inflation" breaks down when inflation is forcing the Fed to threaten hikes.
US-Iran ceasefire drains the safe-haven premium: According to CNN's June 14 live coverage, mediators announced a memorandum of understanding on June 14 — to be formally signed June 19, 2026 — with President Trump stating the Strait of Hormuz would remain "permanently toll free." The geopolitical risk premium that had propped gold above $4,700 during the conflict is unwinding, per TradingEconomics' gold commentary. Lower oil prices from the ceasefire also soften the inflation-scare argument.
Technical breakdown below all major moving averages: Gold now trades below its 20-day ($4,517/oz equiv.), 50-day ($4,627), and 200-day ($4,382) EMAs, per Capital.com. Technical momentum is firmly bearish. Per Finance Magnates, gold has now suffered the deepest pullback of its 2026 cycle — down ≈22–25% from the January 28 record. InteractiveCrypto's June analysis confirms the hawkish Fed outlook and stronger dollar are actively weighing on every session.
📅 Upcoming Catalysts — All Inside the Put's Life (≈95 Days)
June 16–17, 2026 — FOMC meeting + dot plot (highest near-term impact): Per the FOMC meeting calendar, a rate hold is nearly certain (≈97% no-change priced). But the real market mover is Kevin Warsh's first dot-plot press conference as Fed Chair — if the new dots show hawkish higher-for-longer language or remove the remaining cut projections, real yields rise and gold takes another leg lower. A dovish Warsh surprise (keeping cuts on the table) = the biggest near-term risk to the put thesis. Watch carefully.
June 19, 2026 — US-Iran MOU signing: The formal ceasefire ceremony, per CNN and the House of Commons Library's conflict briefing. A clean signing removes the last war-premium pillar under gold (bearish). A breakdown or new escalation revives the safe-haven bid (bullish gold — bad for the put). Binary event.
July 14, 2026 — June CPI release (8:30am ET): Per the BLS CPI schedule, this is the last major inflation print before the July 17 monthly OPEX and a critical data point for the September put. Hot June CPI (confirms 4.2% was not a fluke) = hawkish Fed odds up, real yields up, gold down — bullish for the put. Cool CPI (inflation rolling over) = rate-cut odds revive, gold snaps back — bearish for the put.
Late July 2026 — July 28–29 FOMC + late-July PCE: No Summary of Economic Projections at this meeting (no dot plot), but the Fed's preferred PCE gauge lands around the same time. April PCE was 3.77% YoY. A continued hot reading hardens hike odds through year-end per IndexBox's FOMC analysis.
Early August 2026 — July payrolls (NFP): Another 170k+ print would cement the hawkish narrative. A sharp miss (sub-100k) would reverse expectations violently — one of the biggest binary risk events for this position.
≈July 2026 — WGC Q2 2026 Gold Demand Trends report: Will confirm whether central-bank buying held its torrid pace. The World Gold Council's Q1 2026 report showed 244 tonnes of central-bank buying in Q1 alone — above the five-year average. A strong Q2 reading would reinforce the structural bull case and put a floor under gold.
September 16–17, 2026 — September FOMC (with dot plot) — ONE DAY BEFORE EXPIRY: This is the highest-variance event for the entire position. The September meeting is a full Summary of Economic Projections meeting. If the Fed dots show a 2026 hike has been executed or is imminent, real yields spike and gold faces one more leg lower — potentially cracking through the $385.92 breakeven and delivering maximum profit for the put. If the Fed reverses course (inflation rolled over by then, economy softened), gold snaps — and the $410 put could lose most of its remaining value in a single afternoon. This is the make-or-break event for this position, and it lands when the put has zero time to recover from a mistake.
🎲 Price Targets & Scenarios
📉 Bear Case — Hawkish Fed sticks, gold keeps falling (put profits)
Target zone: GLD $350–$386 (implied-move floor range)
Scenario: May CPI stickiness is confirmed by June CPI (July 14), Warsh's dot-plot stays hawkish, and the Iran ceasefire signing June 19 drains the last war-risk pillar. Gold tests the September quarterly implied-move low of $349.66. At GLD $370 by September 18, the $410 put is worth ≈$40 intrinsic value — a ≈$16/share gain on $24.08 cost (≈66% return in 95 days). At the breakeven of $385.92, the position breaks even. At GLD $350, intrinsic approaches ≈$60 — the deep bear payoff. The gamma floor at $380 is the first domino — a weekly close below $390 would signal momentum is resuming to the downside.
🎯 Base Case — Choppy consolidation near current levels
Target zone: GLD $386–$406 (between breakeven and weekly implied-move ceiling)
Scenario: Gold grinds sideways. The FOMC holds hawkish-but-not-aggressive language. Iran signs without drama. June CPI is mixed — neither hot enough to force a hike nor cool enough to revive cuts. GLD stays in the $386–$406 band defined by the gamma walls and implied-move range. The put stays ITM but gains little additional value; time value slowly erodes. The position is profitable at expiry as long as GLD stays below $410, but the profit is modest. The September FOMC becomes the deciding catalyst.
📈 Bull Case — Gold recovery blows up the put
Target zone: GLD $420–$443 (quarterly implied-move upside)
Scenario: Warsh delivers a dovish surprise at his first FOMC (June 16–17), signaling the next move is a cut, not a hike. Or the Iran ceasefire dramatically softens oil prices and disinflationary forces take hold faster than expected, driving down the June CPI. Central banks step up buying aggressively on the current dip — Goldman Sachs targets $5,400/oz, UBS $5,900, J.P. Morgan ≈$6,000 — any of those scenarios could force a sharp short-covering rally. At GLD $420 by September 18, the $410 put is worth $0 (OTM, expires worthless). Maximum loss = $18M total premium paid. The put buyer loses everything.
💡 Trading Ideas — 4 Reader Types
🎰 YOLO Trader
Real talk: do not try to replicate an $18M floor block. But if you agree with the hawkish-Fed bearish-gold thesis, buying the GLD Sep-18 $385 put outright (currently OTM, much cheaper) gives you directional exposure at a fraction of the cost. It only pays if GLD drops ≈3% further, but a hot June CPI or hawkish September FOMC could absolutely deliver that. Size it so 100% loss does not hurt your month.
📈 Swing Trader
Watch for GLD to fail the $395 gamma support on a daily close — that is the immediate technical trigger that momentum is resuming lower. If GLD closes below $395, the next gamma support is $390, then $380. A put debit spread — buy the $400P / sell the $380P, September 18 expiry — gives you defined risk and profit if GLD falls toward the $380 gamma floor without requiring the full $18M commitment. Breakeven on a spread like this is roughly the cost of the spread subtracted from $400. Track the June 17 FOMC dot-plot as the first binary signal.
🛡️ Premium Collector
The $400 gamma wall is your friend on the upside. Selling covered calls at the $400 strike against an existing GLD long position collects premium while respecting the dominant call-gamma ceiling. Market makers are mechanically selling calls as GLD approaches $400 — you are collecting the same premium they are charging. The structural overhead resistance makes $400 a high-quality covered-call strike for the next 4–6 weeks. Just keep a tight eye on Warsh's first press conference — a dovish pivot could gap GLD through $400 fast.
🐣 Entry-Level Investor Getting Started
Here is the plain-English version: someone paid $18M to buy insurance that GLD stays below $410 through September. Think of it like paying for a car insurance policy — you hope you never need to use it, but if GLD craters below $385.92 (the breakeven), this put becomes very valuable. What is actually moving gold right now? A Fed that may be hiking rates (bad for gold), a ceasefire that deflated the "safe haven" bid, and technical selling after a massive run-up from $4,000 to $5,589/oz earlier this year. The bull case (central banks buying gold in huge quantities, analyst targets at $5,400–$6,000/oz) is not broken — but the near-term macro is the worst gold has faced all year. If you own GLD, watch the $395 support level this week.
⚠️ Risk Factors — What Could Go Wrong
1. The floor-block mechanism does NOT tell us directional conviction. The desk worked this off-book with a known counterparty. The "BUY" label on the tape tells us who held the put at end of day — it does not tell us whether this is a fresh directional bet or a portfolio hedge against a long gold book. A hedge buyer is NOT betting gold falls; they're protecting a long position. We cannot know from the tape alone.
2. Central-bank buying is the structural floor that does not flinch. Per the World Gold Council's Q1 2026 report and Economy Middle East's central-bank buying recap, 244 tonnes were bought in Q1 2026 alone, with a full-year target of 700–900 tonnes. Central banks do not sell when gold dips — they buy more. Per Investing.com's WGC Q1 coverage, global gold demand hit a record high in Q1 2026 (+2% YoY). That is the structural buyer every bearish trade is fighting against.
3. Wall Street still has $5,400–$6,000/oz year-end targets. Goldman Sachs has $5,400/oz, UBS has $5,400 (Sep) / $5,900 (Dec) with a >$7,000 geopolitical upside scenario, and J.P. Morgan models ≈$6,000, per GoldSilver's analyst forecast roundup. Even the most bearish major bank on the list still targets well above current spot. If any of these bull cases materialize in the next 95 days, the $410 put buyer loses the full $18M premium.
4. The September FOMC is the put's biggest friend and biggest risk simultaneously. A hike or hawkish hold = gold drops, put pays. A dovish pivot = gold gaps up 4–6% in a single afternoon on the day before expiry. With the September FOMC falling one day before the put expires, there is no time to hedge after the announcement if it goes the wrong way.
5. The Iran ceasefire signing (June 19) is a binary wildcard. A clean signing deflates the war premium — bearish gold. A collapse in negotiations or new military action re-ignites the safe-haven bid and could send gold spiking 3–5% in a session.
6. Stagflation risk is paradoxically bullish gold. If the Fed is forced to hold (not cut, not hike) into 4%+ sticky inflation for the rest of 2026 — a real-rate-negative environment — gold historically rallies despite high nominal rates. A desk that owns gold long and bought puts as a hedge is implicitly acknowledging this tail risk. The put provides asymmetric downside protection without forcing them to exit the long.
🎯 The Bottom Line
Here's the deal: A desk paid $18M to position for (or hedge against) gold staying weak through September 18, 2026. The $410 put is already $13.11 in-the-money, with a breakeven at $385.92 — only ≈2.8% further downside from where GLD printed. The macro wind is at the put's back: a 172,000 jobs blowout, 4.2% CPI, ≈80% year-end hike odds, a ceasefire draining the war premium, and a clean technical breakdown below every major moving average.
But the structural bull case for gold is NOT broken. Record central-bank buying, $5,400–$6,000/oz bank targets, and a September FOMC that could flip dovish are exactly the forces the put is hedging against. This is a positioned, sober floor block — not panic. Someone did the math and decided the risk/reward on downside exposure through September, right into the September FOMC, made sense.
Key levels to watch:
- 📌 $395 gamma support — first floor below current spot; a daily close below signals downside momentum
- 📌 $400 gamma resistance wall — the dominant ceiling; GLD needs to reclaim this decisively to threaten the put thesis
- 📌 $385.92 — the put's breakeven; below here the position is profitable at expiry
- 📌 $380 / $370 — secondary gamma floors; a move through $390 opens these
Key dates:
- 📅 June 16–17 — FOMC + Warsh's first dot-plot (highest near-term binary)
- 📅 June 19 — US-Iran MOU signing ceremony
- 📅 July 14 — June CPI (the swing factor inside the put's life)
- 📅 July 28–29 — FOMC (no dot plot) + late-July PCE
- 📅 August 2026 — July payrolls
- 📅 September 16–17 — September FOMC with dot plot — one day before the put expires
- 📅 September 18, 2026 — GLD $410 put expiration
⏳ OI double-check reminder: Come back Monday pre-market (≈06:30 ET) for the OPRA open-interest update. Size (7,500) > prior OI (3,200) strongly suggests this is a fresh opening position — we expect OI to rise by ≈7,500 to ≈10,700. If OI rises by approximately the trade size, the fresh-open BTO read is confirmed. If OI rises by less than the trade size, some of the contracts involved an existing holder exiting (less new positioning than the headline size implies). If OI is flat or falls, the position was being closed.
⚠️ Disclaimer: Options trading involves substantial risk of loss and is not suitable for all investors. This analysis is for educational purposes only and does not constitute financial advice or a solicitation to trade. Deep-in-the-money puts have high delta and move nearly dollar-for-dollar with the underlying — they behave differently from out-of-the-money options. A floor-negotiated block trade of this size is an institutional-scale instrument not readily replicable by retail traders. The open/close classification above (BTO, fresh open) is an inference from size vs. prior OI — it will be confirmed or revised by next-day OPRA open interest. Always conduct your own due diligence and consult a licensed financial advisor before trading. Past unusual flow does not guarantee future results.
Last updated: 2026-06-16 — next-day OPRA OI confirmed a partial open (+7,503 of ≈15,000 traded).