🥇 GLD $13.6M Credit Bets Gold's Rally Stalls Right At $400 — CONFIRMED as a Brand-New Bear Call Spread
✅ Updated 2026-08-06 pre-market — both provisional legs resolved, and they resolved as opening. We published the test: OI rising ≈23,839 on both legs confirms a brand-new bear call spread; OI falling means someone was closing a winning bull call spread instead. Open interest rose on both — the $400 call 38,167 → 67,993 (+29,826) and the $425 call 30,626 → 57,587 (+26,961). This is a fresh bearish/capped-upside position, not a winner being taken off the table. See the ✅ RESOLVED box below.
📅 2026-08-05 | 🏗️ Multi-Leg Floor Trade Detected
🎯 The Quick Take
At 10:18:33 ET on August 5, with GLD trading at $388.37, a two-leg options package printed on the exchange floor: 23,839 September $400 calls sold against 23,839 September $425 calls bought — a classic bear call spread that collected $13.6M in net credit up front. Both legs traded at sizes below their prior open interest, so the day's tape could not prove whether this was a brand-new bet or the profit-taking exit of an existing bullish position.
The next-day open interest answered it: this is a brand-new bear call spread. Both strikes gained open interest well in excess of the printed size — the $400 call added 29,826 contracts and the $425 call added 26,961. Contracts were created, not retired. Someone opened a fresh $13.6M-credit position betting gold's rally stalls at $400 into September.
🏢 Company Overview
SPDR Gold Shares (GLD) is the largest physically-backed gold ETF in the world, with $132.48 billion in AUM (StockAnalysis). It's structured as a trust that holds actual gold bars in London vaults and tracks the LBMA Gold Price less a 0.40% expense ratio (StockAnalysis). GLD has traded since November 18, 2004 and is managed by State Street (StockAnalysis). Over the trailing year the fund is up +25.78% (StockAnalysis).
⚠️ Important strike-math note: GLD is not one-tenth of the spot gold price. Because the fund sells gold out of the trust each year to pay its 0.40% fee, the ounces-of-gold backing each share declines slowly over time. SPDR's official "ounces per share" figure was unavailable at the time of this research (spdrgoldshares.com), so here's a derived estimate: dividing GLD's $390.73 price by spot gold's $4,259.30/oz (Kitco, StockAnalysis) gives ≈0.0917 oz of gold per GLD share — roughly $9.17 of GLD price per $100/oz move in spot gold. That means a $4,500/oz gold target maps to roughly $412 GLD, not $450. Verify the live official ratio before sizing any strike-based trade off a gold price target.
💰 The Option Flow Breakdown
📊 What Just Happened
A single package printed on the exchange floor — negotiated, not swept off the lit book:
| Time (ET) | Buy/Sell | Call/Put | Expiration | Strike | Premium | Volume | Prior OI | Size | Spot | Option Price | Option Symbol |
|---|---|---|---|---|---|---|---|---|---|---|---|
| 10:18:33 | SELL | CALL | 2026-09-18 | $400 | $20.98M | ≈31,000 | 38,167 | 23,839 | $388.37 | $8.80 | GLD20260918C400 |
| 10:18:33 | BUY | CALL | 2026-09-18 | $425 | $7.39M | ≈28,000 | 30,626 | 23,839 | $388.37 | $3.10 | GLD20260918C425 |
🏗️ Flow tag: MULTI-LEG FLOOR TRADE. Both legs were negotiated on the exchange floor as a matched package — a known counterparty took the other side. This is not aggressive sweeping into the lit book, so there's no meaningful "% across the spread" aggressor read here; treat it as a facilitated block, not urgent buy-or-sell pressure.
- 💵 Net credit collected: $13,588,230 ($20,978,320 sold − $7,390,090 bought)
- 📐 Structure: Bear call spread (call credit spread) — same expiration, same size on both legs, printed in the same second
- 📉 Package delta: the desk's own greeks show roughly −968,340 share-equivalents of net delta. That's a net short-delta package — makes sense, since the sold $400 call's delta (0.406) is more than double the bought $425 call's delta (0.177). Even though it's a defined-risk two-leg trade, its net exposure leans against gold continuing to rally.
✅ RESOLVED — Both Legs Opened; the Bear Call Spread Is Real
Updated 2026-08-06 pre-market. The ≈06:30 ET OPRA open-interest snapshot (reflecting the August 5 close) has published.
| Leg | Baseline OI (Aug-5 snap) | Resolving OI (Aug-6 snap) | Δ | Print size | Δ as % of print | Day vol | Verdict |
|---|---|---|---|---|---|---|---|
| Sep-18 $400 C (sold 23,839) | 38,167 | 67,993 | +29,826 | 23,839 | ≈+125.1% | 35,165 | ✅ OPEN (STO) |
| Sep-18 $425 C (bought 23,839) | 30,626 | 57,587 | +26,961 | 23,839 | ≈+113.1% | 28,783 | ✅ OPEN (BTO) |
The direction of the $400 leg was the deciding number, and it went up. We said a rise confirms a fresh bear call spread and a fall would mean someone was closing a profitable bull call spread. Open interest rose by 29,826 — more than the print itself, meaning other participants were opening at that strike too, and certainly ruling out any net closing.
Both legs exceeding 100% of the print size is worth a note. It tells you this desk was not the only one adding at these strikes on August 5; day volume was 35,165 at the $400 line against a 23,839-lot package. So the confirmed structure is real, and it landed inside a broader wave of positioning around $400 as gold ripped.
What is now established: a new short at $400 financed by a long wing at $425, collecting $13.6M as a fresh bet that gold stalls under $400 into September. What the tape still cannot show: whether this is a standalone directional view or an overlay against physical gold, miners, or a much larger book we cannot see.
🤓 What This Actually Means — Plain English
Here's the trade in retail terms: someone sold the right for a buyer to take GLD above $400 by September 18, and used part of that premium to buy a cheaper "insurance" call at $425 in case gold really rips. Net result: they pocketed $13.6M in cash today.
That sounds like free money, but it isn't. This is a defined-risk, capped-reward position, not a lottery ticket:
- Best case (max profit = $13.6M): GLD closes at or below $400 on September 18. Both calls expire worthless, and the seller keeps the entire credit.
- Worst case (max loss ≈ $46.0M): GLD closes at or above $425 on September 18. The $25-wide spread between the strikes costs the full $25 per share, minus the $5.70 credit already banked, times 23,839 contracts × 100 shares — that's roughly $46 million on the table if gold keeps running.
- Breakeven: ≈$405.70 (+4.5% above today's $388.37 spot). Below that, the trade is profitable; above it, losses start accumulating up to the $425 cap.
The risk/reward here is lopsided — roughly $3.40 risked for every $1.00 collected — which tells you this is a trade with real conviction that $400 holds as a ceiling, not a casual income play. It is now confirmed opening (see the ✅ RESOLVED box above), so it reads as a live bet that gold's +4.4%-in-a-day rally runs out of steam close to where it was already trading, rather than a bet on a reversal lower. It caps the upside it's willing to give up ($400–$425) while still leaving unlimited room to be right if gold simply doesn't get there.
Because this printed as a negotiated floor trade rather than a lit sweep, there's a known counterparty on the other side and no signal of panicked, urgent buying or selling — weigh the open/close resolution and the strike geometry here more than the raw $13.6M headline number.
📈 Technical Setup / Chart Check-Up
YTD Chart
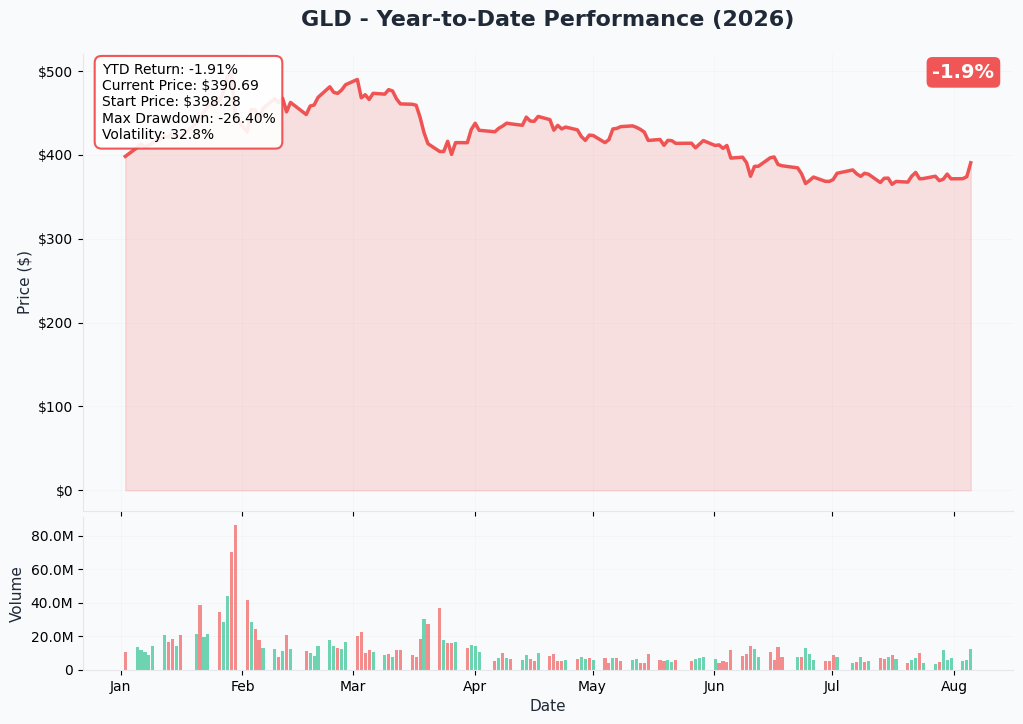
GLD has been on a strong multi-month uptrend, capped off by today's outsized +4.4% single-day move that follows a soft ADP print and a Fed that just held rates with three members actually dissenting for a hike. That's an unusually large one-day move to be selling calls into — it raises the odds of some mean reversion, but it's also exactly the kind of spike that makes rich call premium worth selling if you think it's overextended near term.
Gamma-Based Support & Resistance Analysis
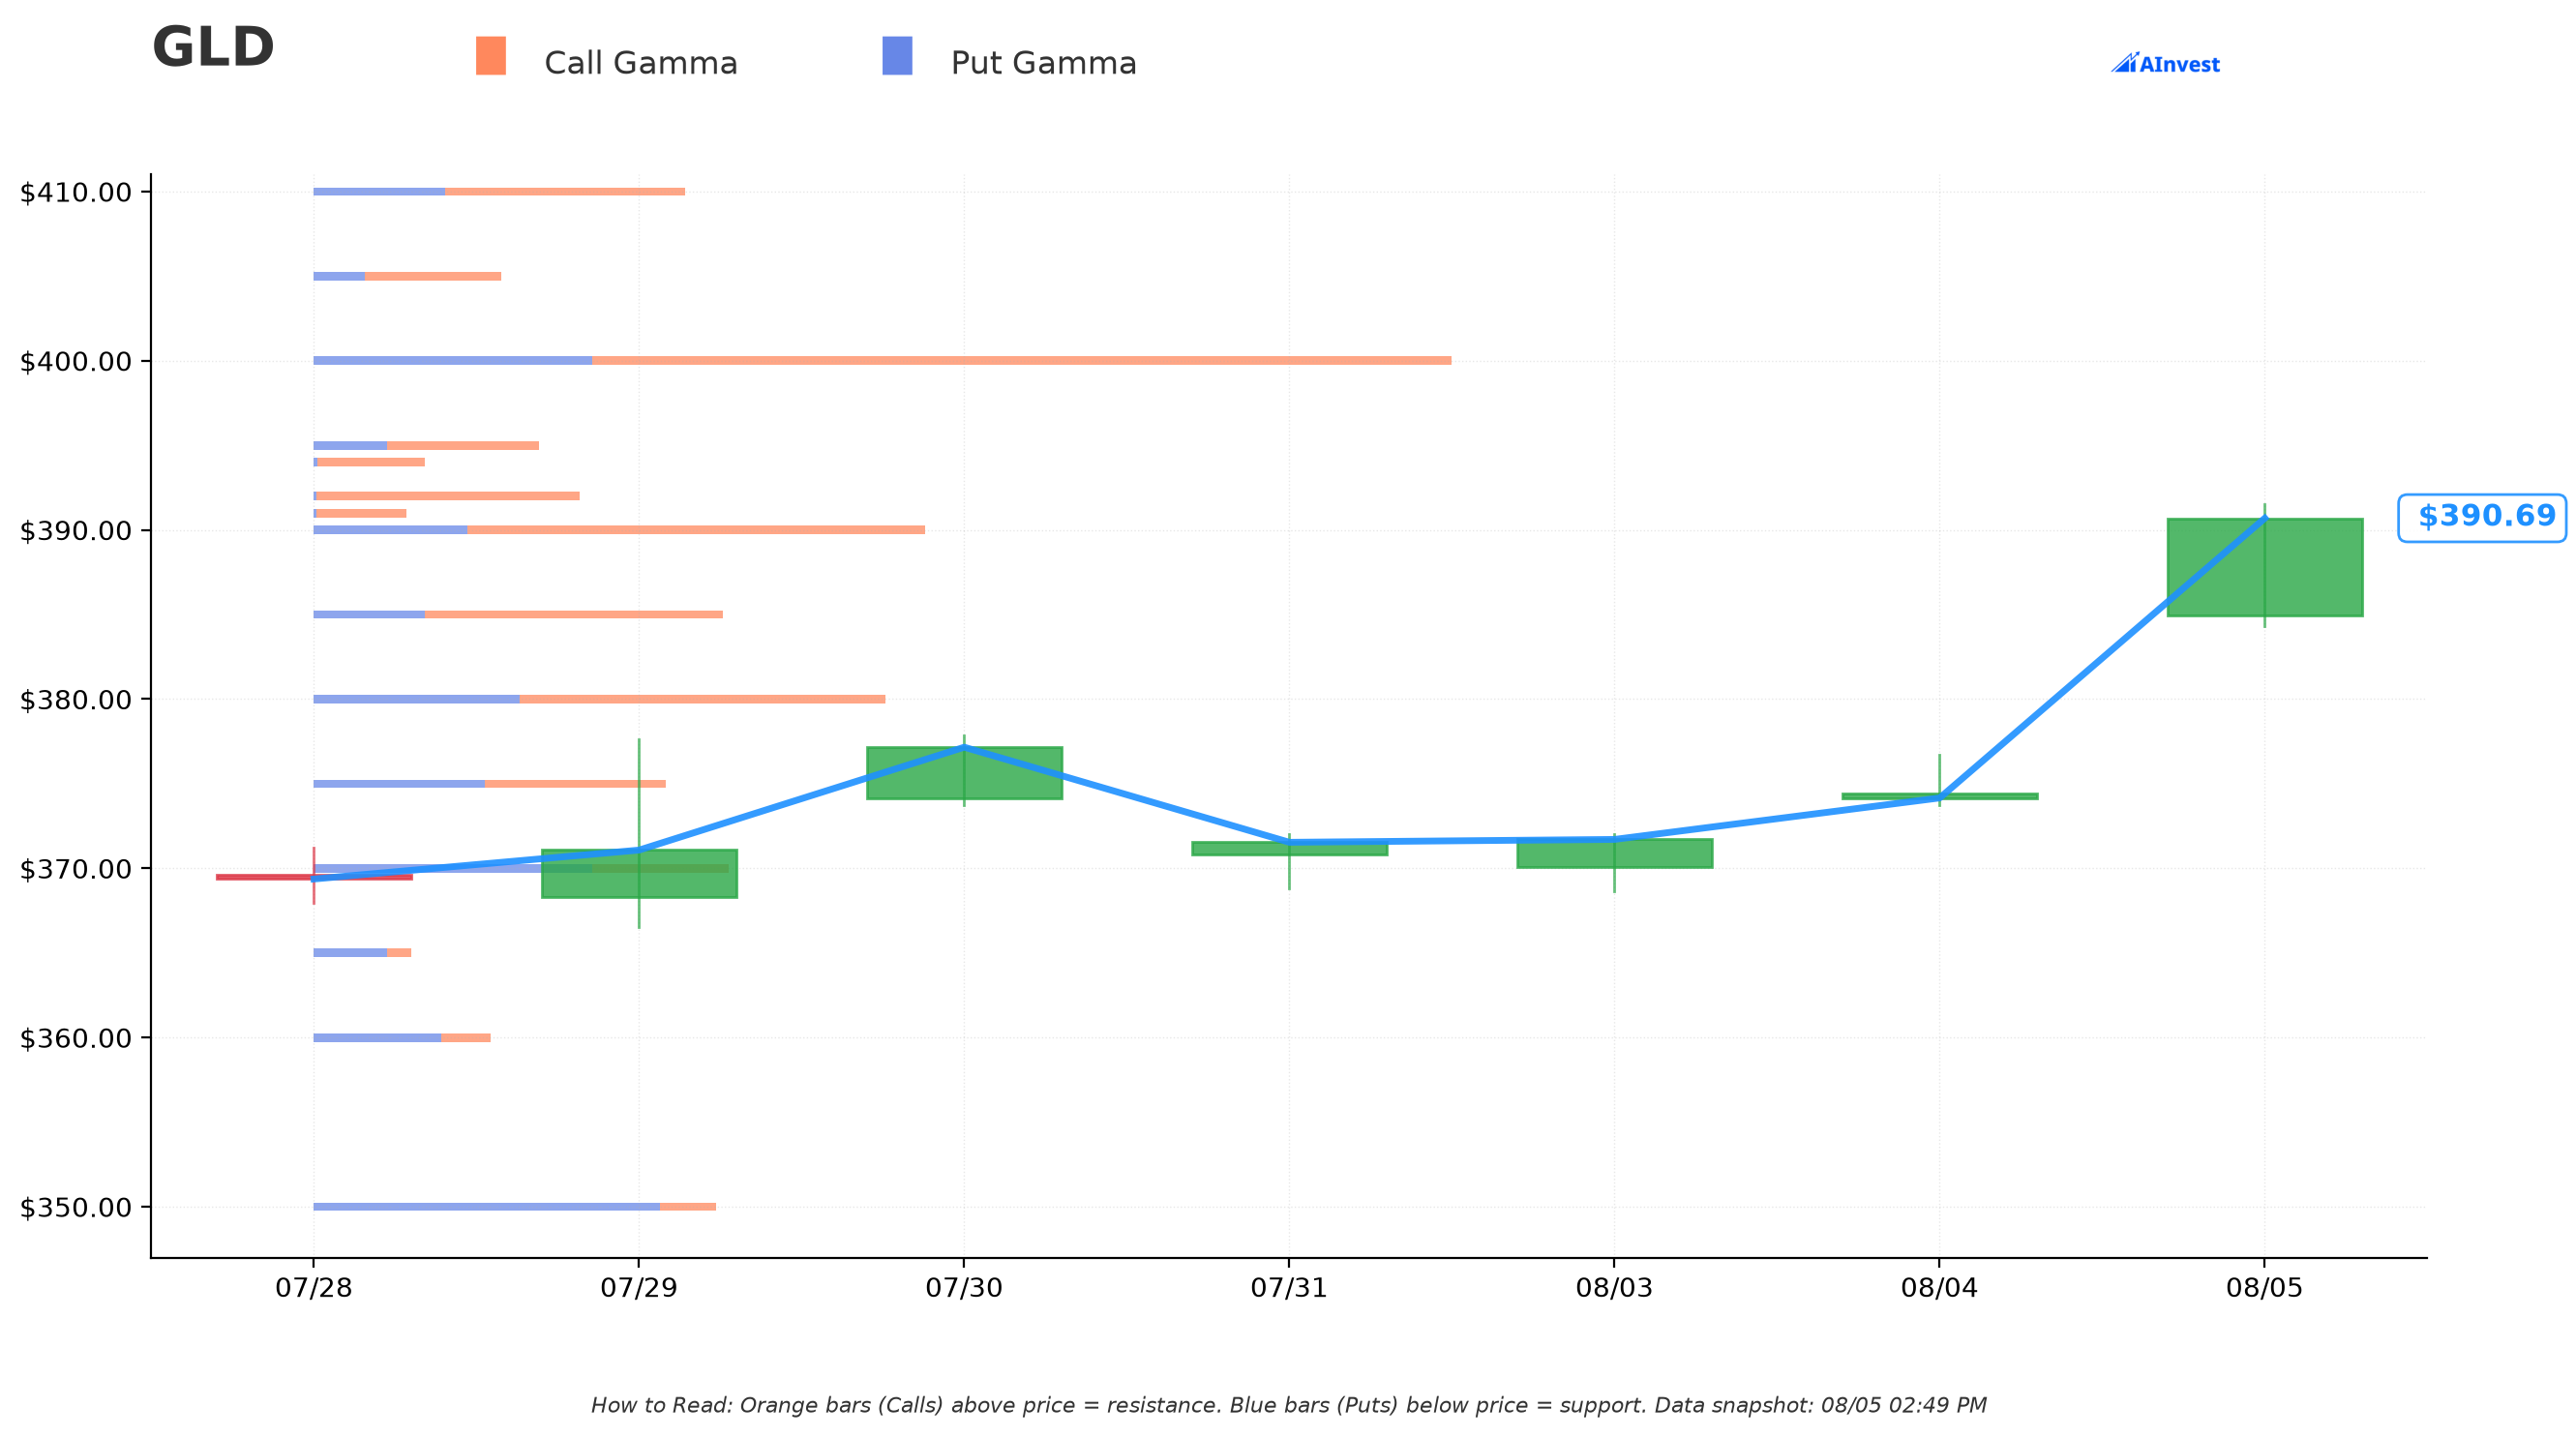
Reading gex.json as of today:
- 🟠 The $400 strike is the single strongest resistance wall in the entire GLD options chain — "Very Strong," roughly 2.4% above the current $390.67 gamma-snapshot price, with far more total dealer gamma sitting there than at any other strike. This is the exact strike this package sold calls against.
- 🟠 Secondary resistance walls sit at $410 (+4.9%) and $420 (+7.5%), also flagged "Very Strong."
- 🟠 The $425 strike (the long wing bought in this trade) also carries "Very Strong" resistance gamma, roughly 8.8% above spot.
- 🔵 On the downside, $390 is a "Very Strong" support wall essentially at the money, with $385 and $375 as the next support levels below.
In plain terms: dealer hedging flows are already concentrated at $400, meaning market-maker positioning tends to dampen rallies as price approaches that level — independent of this specific trade. The seller of the $400 call isn't fighting the tape here; if anything, they're leaning on where dealers are already positioned to sell into strength.
Implied Move Analysis
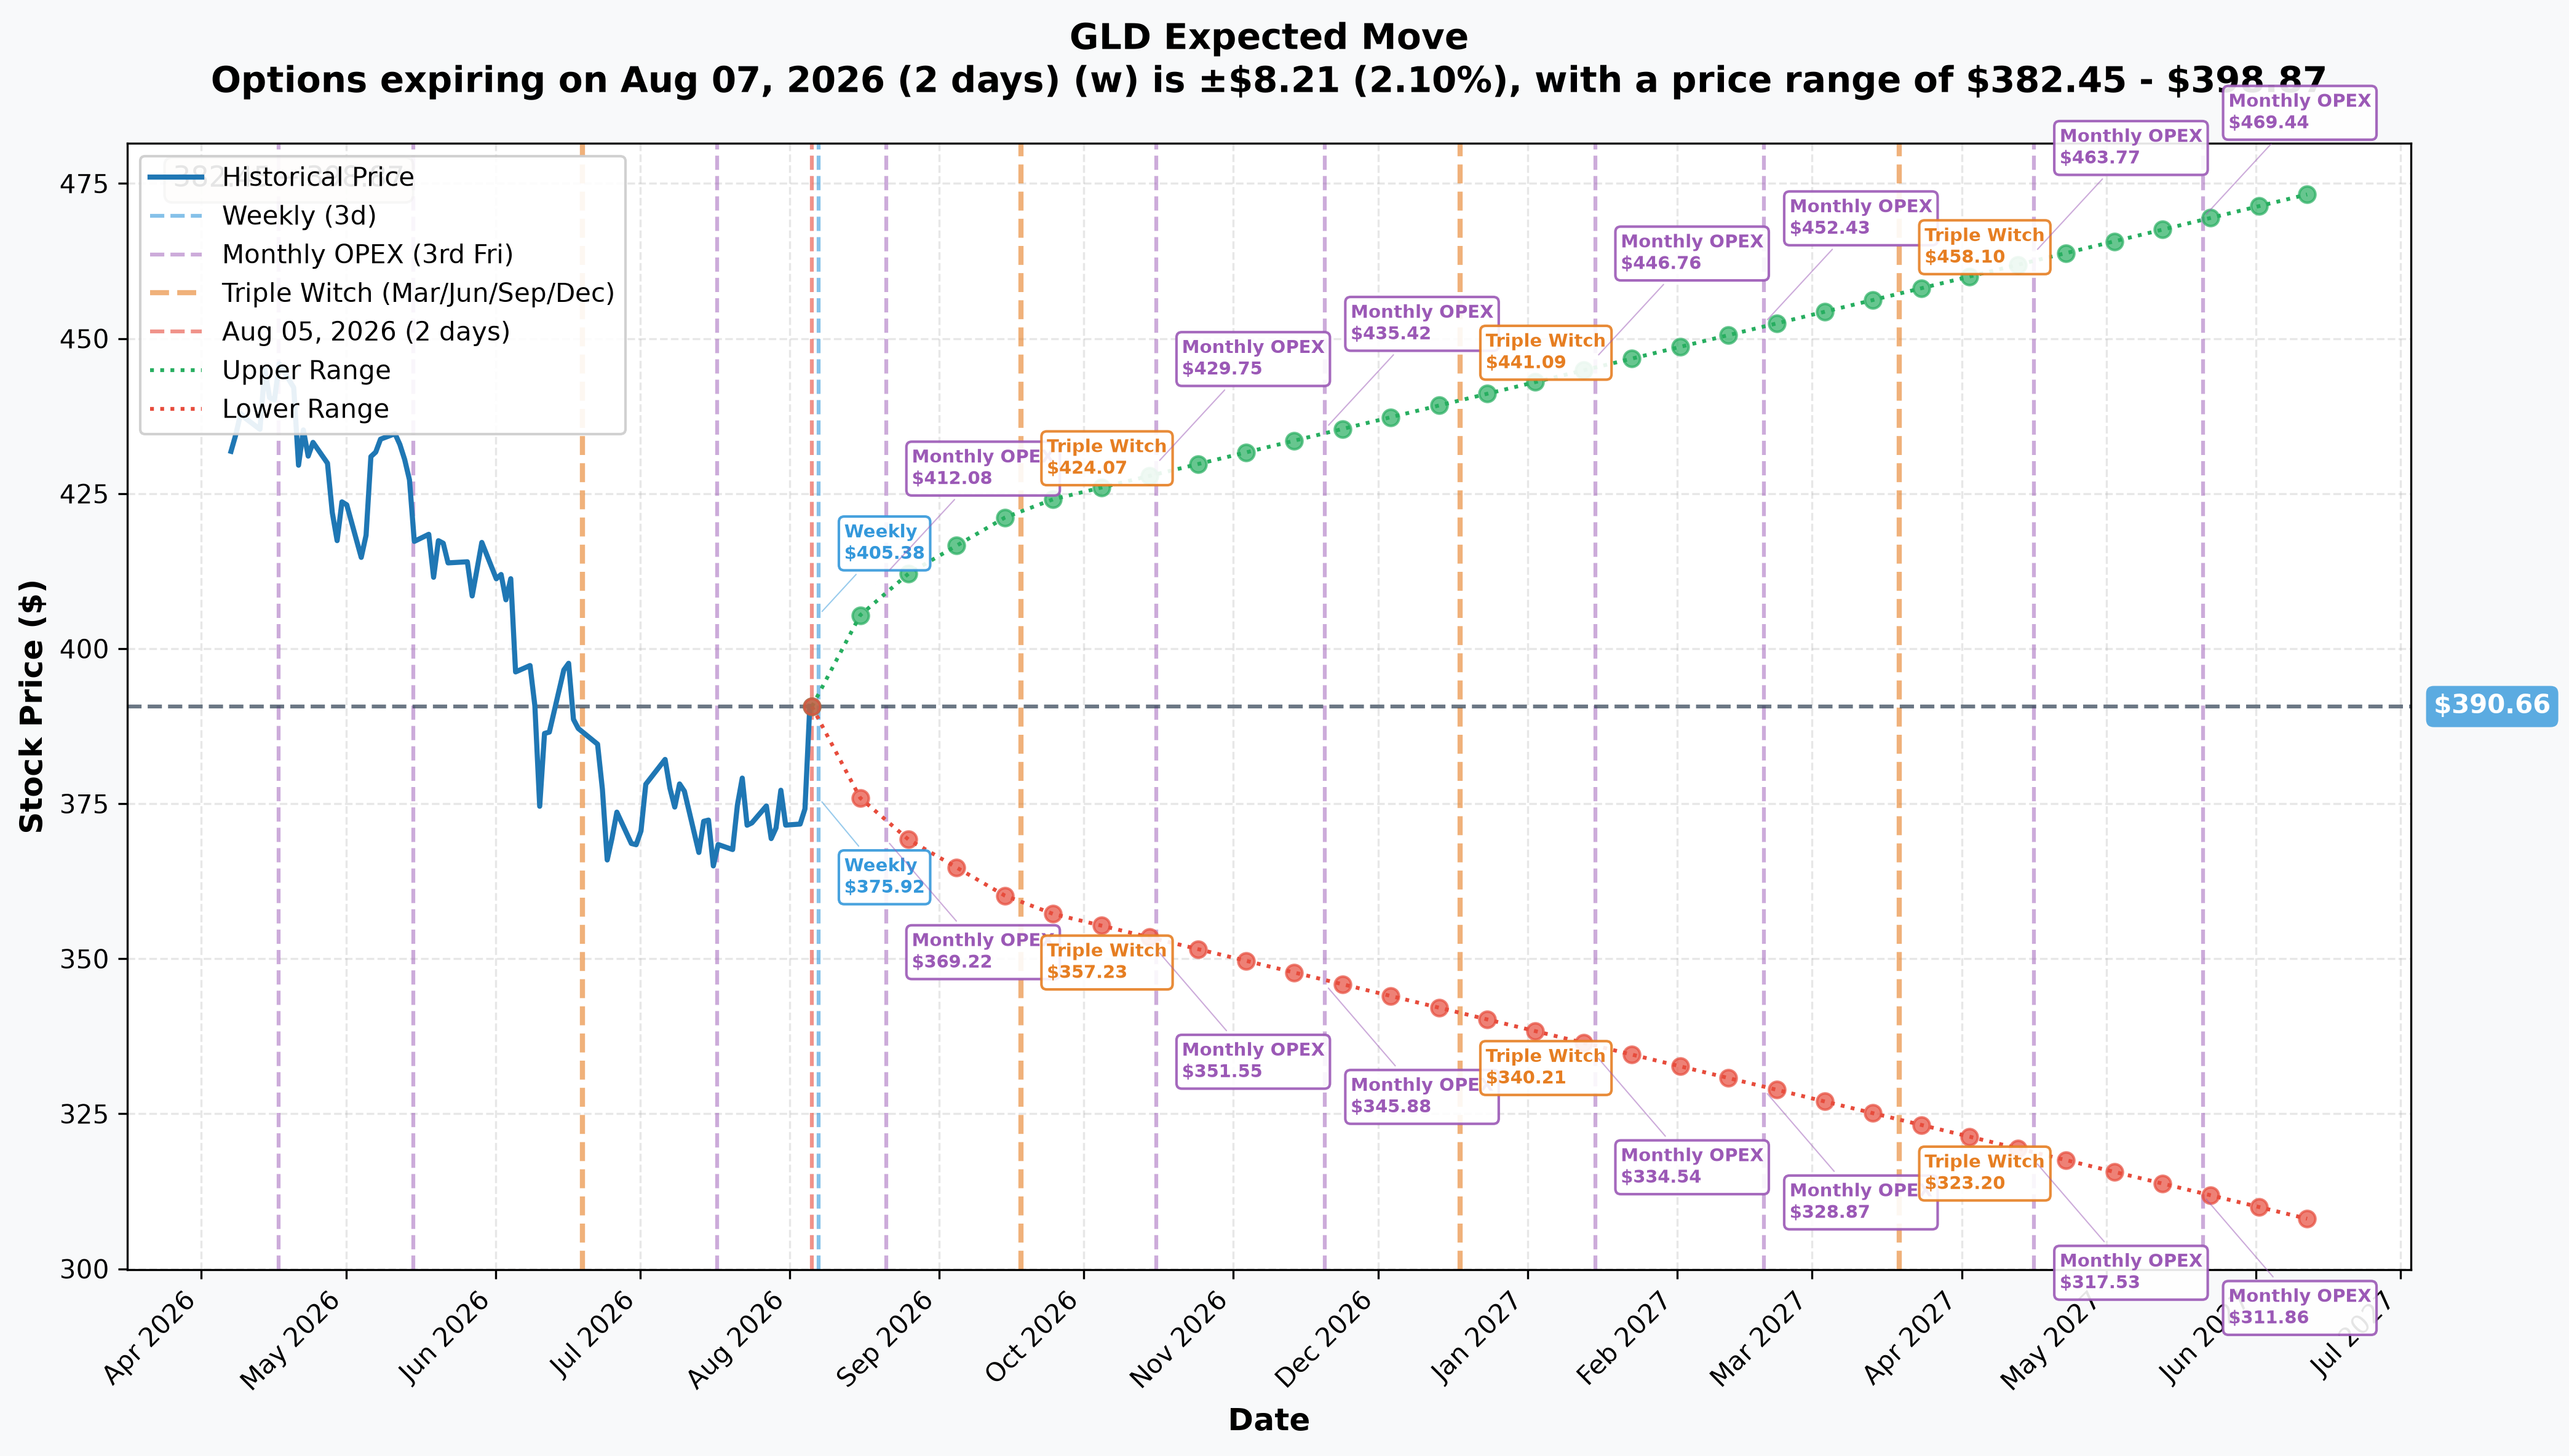
Reading GLD_implied_move.json off the current $390.67 gamma-snapshot price:
| Expiry | DTE | Implied Move | Range |
|---|---|---|---|
| Weekly (2026-08-07) | 2 | ±2.1% (±$8.21) | $382.45 – $398.87 |
| Monthly OPEX (2026-08-21) | 16 | ±5.0% (±$19.62) | $371.03 – $410.27 |
| Quarterly / this trade's expiry (2026-09-18) | 44 | ±8.3% (±$32.29) | $358.36 – $422.94 |
| Yearly LEAPS (2027-06-17) | 316 | ±21.4% (±$83.71) | $306.94 – $474.36 |
This is the number worth sitting with: the options market's own implied move to September 18 puts the upper edge at $422.94 — almost exactly where the $425 long wing sits, and comfortably above the $400 short strike. In other words, the $400 strike this package sold isn't some remote out-of-the-money throwaway — it's well inside the market's own priced range of outcomes by expiration. The $425 wing, by contrast, sits almost precisely at the statistical edge of what the options market is currently pricing as a plausible one-range move. That's a meaningful tell: the breakeven at $405.70 sits only about a third of the way through the implied move range, while max loss doesn't fully kick in until price approaches the very edge of what the market currently considers "expected."
🎪 Catalysts
Already Happened
- July 29, 2026 FOMC: held the target range at 3.50%–3.75% on a 9–3 vote — but three members (Beth Hammack, Neel Kashkari, Lorie Logan) dissented in favor of a rate hike, not a cut (Federal Reserve). This is a genuinely two-sided, hawkish-leaning debate right now — do not read this setup as a "rate cuts coming" story.
- Today's rally driver: soft ADP private payrolls (44k jobs in July), below expectations, is being credited with cooling rate-hike bets and pushing gold toward $4,200+/oz (Kitco News).
- ISM Services PMI at 54.1, with gold trading near session highs (Kitco News).
- Bank of Korea announced a long-term domestic gold-buying program, adding to official-sector demand (Kitco News).
- The dollar (UUP) at $28.09, close to its 52-week high of $28.60 (StockAnalysis) — a headwind gold has been overriding so far.
Upcoming
- September FOMC: September 15–16, 2026, with a Summary of Economic Projections dot plot (Federal Reserve calendar). Critically, this meeting lands just two days before this spread's September 18 expiration — whatever the Fed does on rates will be known and priced before these options expire, and it's the single highest-information date in this trade's life.
- October FOMC: October 27–28, 2026 — tentative pending confirmation at the September meeting.
- December FOMC: December 8–9, 2026, with another SEP dot plot.
- The Fed's own caveat applies to all three: each date is "tentative until confirmed at the meeting immediately preceding it" (Federal Reserve).
🎲 Price Targets & Probabilities
Combining the gamma walls and the implied move:
- Base case: GLD gravitates toward the $390 support wall / grinds up toward the $400 resistance wall, where the heaviest dealer gamma sits. That's also right at the credit spread's short strike.
- Bull case: a dovish tilt out of the September 15–16 FOMC pushes GLD through $400 toward the $410–$420 resistance zone, inside the ±8.3% implied move band. This is the scenario that starts eating into this spread's credit.
- Bear case: a hawkish surprise (a real push for that 25bp hike three FOMC members already wanted) sends real yields higher and gold back toward the $375–$385 support zone, comfortably inside the spread's profit zone.
💡 Trading Ideas
These are retail-sized ways to express a similar view — not a suggestion to mirror the $13.6M institutional package, which requires far more buying power and margin than most retail accounts carry.
🛡️ Conservative
Sell a much narrower, further-out-of-the-money call spread, e.g. GLD September $410/$415 calls, for a modest credit. Smaller premium, smaller max loss, and the short strike sits above even the gamma resistance wall at $410 rather than right on top of the single strongest one at $400.
⚖️ Balanced
Mirror the structure at retail size: sell 1 GLD September $400 call, buy 1 GLD September $425 call. Collect roughly $570 in credit per spread, risk roughly $1,930 per spread if gold runs to $425 or beyond. Same $405.70 breakeven, same defined-risk shape, sized for a normal account instead of institutional size.
🚀 Aggressive
If you think the July FOMC hawkish dissents matter more than today's soft ADP print, buying GLD September $400 puts is the more direct way to express a "gold's rally is overextended" view — unlimited-ish downside profit potential, but full premium at risk if gold keeps climbing toward the gamma walls at $410–$420.
⚠️ Risk Factors
- Open vs. close is now RESOLVED as opening. Both legs gained open interest well above the printed size ($400 call +29,826, $425 call +26,961), confirming a genuine new bear call spread rather than a bullish position being closed for a profit. The day-of caveat was correct at the time and has been settled by the data.
- Both legs are illiquid relative to size — 23,839 contracts against OI of 38,167 and 30,626 respectively is a meaningful chunk of existing interest, which is part of why size alone can't settle open vs. close today.
- A hawkish September FOMC is the clearest threat to the credit-seller's thesis. Three sitting members already wanted a hike in July.
- Gold just moved +4.4% in a single session. Positioning after a move this large — and GLD is already up +25.78% over the past year — raises real odds of near-term mean reversion in either direction.
- What the tape cannot tell us: OPRA data does not reveal the broker, the customer's identity, whether this desk is delta-hedging elsewhere (stock, futures, or other options), or whether there was a pre-existing position being adjusted rather than a clean open or close. Treat every directional read here as inferred, not proven.
🎯 The Bottom Line
Real talk: someone collected $13.6M today betting gold's blistering one-day rally runs out of room near $400 — a strike that also happens to be the strongest gamma resistance wall in the entire GLD chain, and a level the options market's own implied move to September 18 says is well within reach. That's a coherent, defined-risk way to fade an extended move without going flat-out short.
But it's a capped-reward, real-risk trade — $13.6M to gain, roughly $46M at stake if gold keeps running to $425 and beyond — not free income. The one open question on the day, whether this was a fresh bearish cap or a bullish trader cashing out a winner, has been answered by the ≈06:30 ET open-interest snapshot: both legs opened. This is a live new position betting gold stalls under $400 into September, and it is now on the board rather than coming off it.
This analysis is for informational purposes only and is not investment advice. Options trading involves substantial risk, including the potential loss of the entire premium paid and, in spread strategies, losses up to the full width between strikes. Past option flow does not predict future price movement. Trade sizing and strategy selection should reflect your own risk tolerance and account size.
Last updated: 2026-08-06 (pre-market) — next-day OPRA open interest resolved both legs as opening ($400 call 38,167 → 67,993; $425 call 30,626 → 57,587), confirming a brand-new bear call spread rather than the exit of an existing bull call spread. Title, lead and the resolution section were updated.