🥇 GLD — Yesterday's Gold Bet Was Never Torn Up. A Second, Bigger One Was Stacked On Top — For Free
🔄 Updated August 10, 2026 — our read was wrong and the open interest says so. We published this as a roll: yesterday's long strangle closed out and rebuilt wider. It was not. Monday's OPRA snapshot shows all four legs opened — the two sold strikes rose by ≈39,000 contracts each instead of falling toward zero. Nothing was closed. The title, the thesis and the structure section below have been corrected. The original prediction table and both forks are preserved in the ✅ RESOLVED box so you can see exactly how the call went wrong.
SPDR Gold Shares holds physical gold bars vaulted in London and tracks the LBMA Gold Price. Assets $132.48B, expense ratio 0.40%, listed since 2004. The fund trades at $398.12, up 2.17% today, and is +28.21% over the past year (StockAnalysis). Follow it on the SPDR Gold Shares fund page.
🤝 The Trade in Plain English
At 13:42:47, with the fund at $397.96, four legs crossed together as block crosses — all one negotiated package, all expiring November 20:
Sell 39,000 $460 calls, buy 43,875 $470 calls, buy 48,750 $335 puts, sell 29,250 $345 puts.
| Time | Buy/Sell | C/P | Expiration | Strike | Size | Volume | OI (prior) | Option Price | Premium | Spot | Option Symbol |
|---|---|---|---|---|---|---|---|---|---|---|---|
| 13:42:47 | SELL | CALL | 2026-11-20 | $460 | 39,000 | 39,219 | 28,629 | $5.14 | $20,046,000 | $397.96 | GLD20261120C460 |
| 13:42:47 | BUY | CALL | 2026-11-20 | $470 | 43,875 | 44,140 | 1,794 | $4.16 | $18,252,000 | $397.96 | GLD20261120C470 |
| 13:42:47 | BUY | PUT | 2026-11-20 | $335 | 48,750 | 48,762 | 3,451 | $2.15 | $10,481,250 | $397.96 | GLD20261120P335 |
| 13:42:47 | SELL | PUT | 2026-11-20 | $345 | 29,250 | 39,012 | 31,667 | $3.03 | $8,862,750 | $397.96 | GLD20261120P345 |
Net: a $175,500 CREDIT. On $57.6M of premium changing hands, the package cost essentially nothing — the two sales paid for the two purchases almost exactly. Package delta −120,802 shares.
⭐ The Two Strikes Being Sold Were Bought Yesterday
This is what makes today's trade legible, and it took one query to find.
Both sold strikes had flat open interest for weeks, then exploded overnight:
| Strike | Jul 27 → Aug 6 | Aug 7 snapshot | Overnight change |
|---|---|---|---|
| $460 call | 806 → 790 | 28,629 | +27,839 |
| $345 put | 329 → 357 | 31,667 | +31,310 |
Open interest published on the morning of August 7 reflects August 6's trading. So we pulled yesterday's tape — and found both blocks, at the same instant:
- 26,250 × $460 calls at $3.65 — filled at 100% across the spread, at the ask
- 30,000 × $345 puts at $4.20 — also at the ask
Both bought. Same timestamp. Both as stock-plus-options crosses, meaning both carried a share hedge.
That is a long strangle — long an out-of-the-money call and an out-of-the-money put, a bet that gold makes a big move in either direction. Cost: ≈$22.2M.
🔍 Then Gold Rallied — and a Second, Bigger Package Went On Top, For Free
Overnight, gold surged to seven-week highs around $4,300 an ounce, driven by weaker-than-expected U.S. employment data, reduced Fed rate-hike expectations, geopolitical developments, and continued central-bank buying — particularly from the People's Bank of China (StockAnalysis). GLD rose 2.17%.
The strangle's two legs moved as you would expect:
- $460 call: $3.65 → $5.14 (+40.8%)
- $345 put: $4.20 → $3.03 (−27.9%)
Roughly a wash in value — but the position is now unbalanced, with all the life in the call side.
So today a second package went on — and Monday's open interest proves it was stacked on top rather than swapped in. All four legs opened. The $460 calls and $345 puts sold today were not yesterday's longs being retired: those strikes grew by ≈39,000 contracts each.
| Yesterday (still open) | Today (all four new) | |
|---|---|---|
| Call side | long 26,250 × $460 | short 39,000 × $460, long 43,875 × $470 |
| Put side | long 30,000 × $345 | long 48,750 × $335, short 29,250 × $345 |
| Cost | ≈$22.2M paid | $175,500 collected |
Read on its own, today's package is a self-financing double backspread: sell the inner strangle, use the proceeds to buy a larger outer strangle. Note the ratios — they bought more wings than they sold body: net long 4,875 extra $470 calls and net long 19,500 extra $335 puts.
That shape has a distinctive payoff at November expiry:
| GLD at Nov 20 | Package P&L |
|---|---|
| $345–$460 (the wide middle, where gold is now) | ≈flat — keeps the $175,500 |
| $335 | ≈−$29M (worst case down) |
| below ≈$320 | profitable, rising steeply |
| $470 | ≈−$39M (worst case up) |
| above ≈$550 | profitable |
So this is a bet on a violent move, not a range-bound income trade. A short iron condor — the other reading we floated — would collect a large credit to profit in the middle. This collects $175,500 on $57.6M of premium and profits only in the far tails. The middle is where it does nothing; the near tails are where it hurts.
One honest complication that survived the resolution — and grew. We flagged that at least 10,371 of the $460 call sale had to be a genuinely new short. The snapshot says all 39,000 of it was. There is a real short call position at $460 and a real short put position at $345, and the loss bands above are the price of financing those wings.
✅ RESOLVED — The Decisive Test Came Back, and It Went Against Us
We said this fork would settle it and that we would publish whichever way it landed. It landed on the fresh-opens side. Our roll read was wrong.
The resolving OPRA snapshot is timestamped August 10 and reflects the August 7 close.
| Strike | Baseline (Aug-7 snap) | Resolving (Aug-10 snap) | Δ | Print size | Our roll call | Verdict |
|---|---|---|---|---|---|---|
| $460 call (sold) | 28,629 | 67,622 | +38,993 | 39,000 | falls to ≈0–1,000 | ❌ OPEN (STO) — 100.0% of the print |
| $345 put (sold) | 31,667 | 70,659 | +38,992 | 29,250 | falls to ≈2,400 | ❌ OPEN (STO) — 133% of the print |
| $470 call (bought) | 1,794 | 44,689 | +42,895 | 43,875 | ≈45,700 | ✅ OPEN (BTO) — 97.8% |
| $335 put (bought) | 3,451 | 51,342 | +47,891 | 48,750 | ≈52,200 | ✅ OPEN (BTO) — 98.2% |
All four legs opened. Nothing was closed. The $460 call went to 67,622 against our stated alternative-case number of ≈67,600 — the fresh-position path, essentially to the contract.
What this changes. Yesterday's long strangle is still on the books — its strikes grew, they did not shrink. Today's four legs are a separate, additional package, not a replacement. The correct description is a self-financing double backspread (short inner strangle funding a larger outer strangle), detailed in the section above.
What it does not change. The two wings were proven opens under either reading, and they still are — 24× and 14× their prior open interest. The catalyst logic, the strike geometry versus the implied-move band, and the observation that this is a volatility position rather than a directional one all survive intact.
Why we got it wrong, stated plainly. We reasoned from a strike-level match: yesterday's documented purchases sat on exactly the strikes sold today, and the sizes lined up to within 2.5%. That is real evidence, and it is the kind of evidence that usually identifies a roll. But a matching strike and size is equally consistent with somebody taking the other side of yesterday's trade — and open interest is the only thing that separates those two. We said so at the time, we said the fork was enormous, and we said we would publish the answer. Here it is.
🤓 What This Actually Means — Plain English
A strangle buys both directions at once. Own a call above the price and a put below it, and you profit from a big move either way — you lose if nothing happens, because both options decay.
Selling a nearer strangle to pay for a wider one is the trade here. That is what the open interest proved: they did not close anything, they added a short inner strangle ($345 put / $460 call) and used the proceeds to buy a bigger outer strangle ($335 put / $470 call). Net cost: a $175,500 credit. You get the wider bet for free — and in exchange you take on the short strikes' risk.
That risk is not theoretical, and it is where the free lunch ends. If gold lands at $335 in November this package loses ≈$29M; at $470 it loses ≈$39M. The wings only start paying below ≈$320 or above ≈$550. The structure needs a genuinely violent move to work — a merely large one lands in the loss band.
The one thing to take from the correction. "They rolled" and "they sold to somebody who was rolling" produce identical tape — same strikes, same sizes, same timestamp. Only open interest tells them apart, and it is published the next morning. When you see a big print land on strikes that were bought the day before, that is a genuine clue — but it is a clue with two answers, and waiting one session is what settles it.
And note what this position still is not. It is not a bet that gold goes up. The put side carries the larger net long — 19,500 extra $335 puts against 4,875 extra $470 calls. This desk is positioned for volatility, with the bigger side of the tail bet pointing down.
📊 The Charts
One-Year Price Action
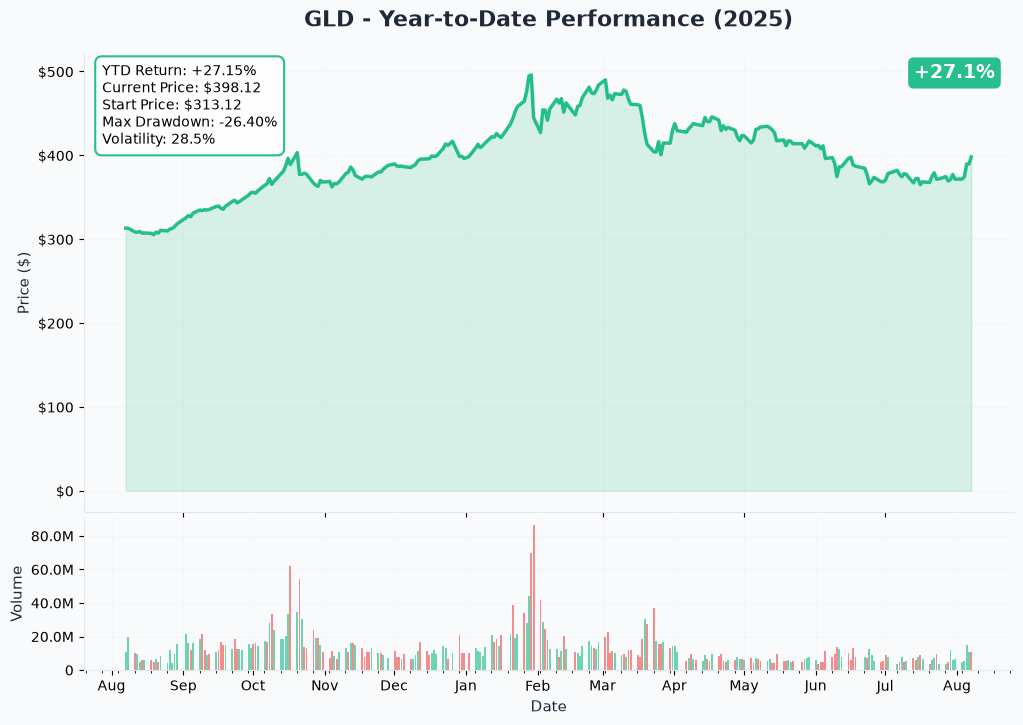
GLD is +27.1% on this chart, with a quoted one-year total return of +28.21% (StockAnalysis). The 52-week range is $305.19–$509.70, so today's $398 sits in the middle of a very wide band — the fund is ≈21.9% below its high and ≈30.4% above its low. A middle-of-the-range position is exactly where a strangle makes sense, with room to run in both directions.
Gamma Support and Resistance
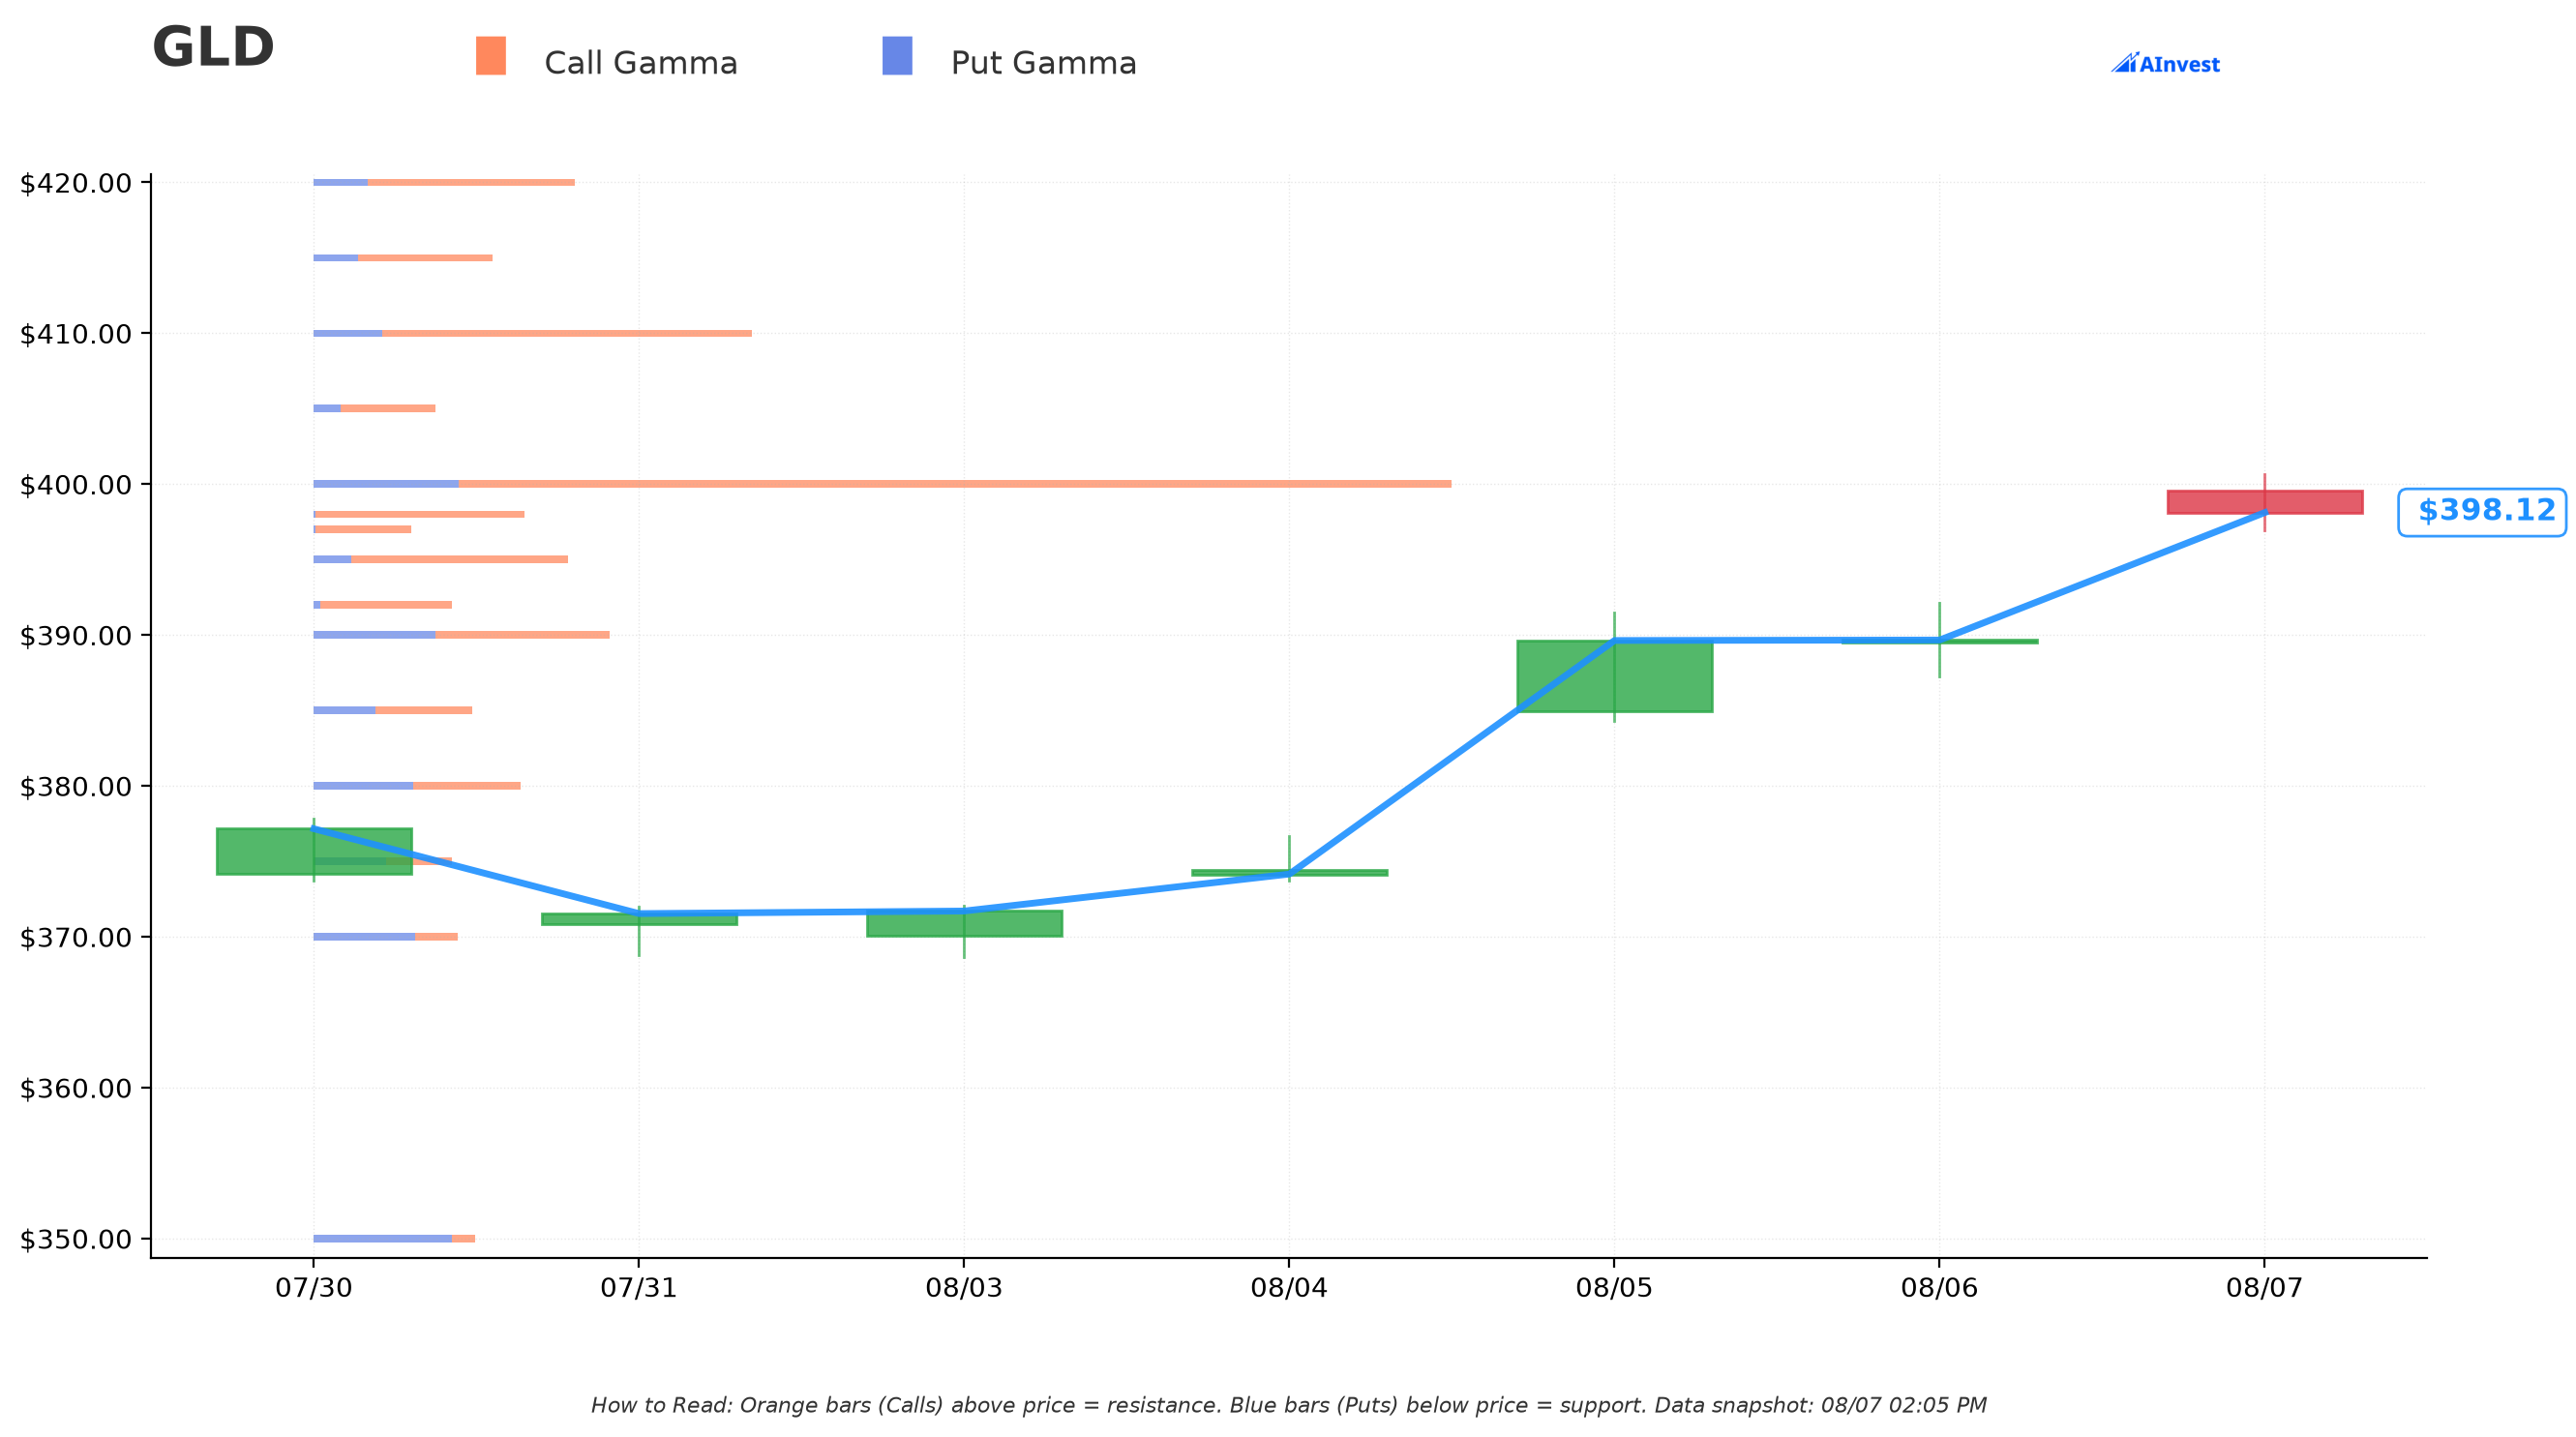
Dealer gamma sits tightly around spot: support at $398, $395, $390 and $380, resistance at $400, $410, $420 and $425. The fund is pressed right against the $400 resistance level after today's move.
Now look at where the traded strikes fall. $470 and $335 are far outside the entire gamma structure — nowhere near any level dealers are hedging. That is consistent with tail positioning rather than a near-term directional play, and it is why those options are cheap enough to buy 92,625 of them for free.
Implied Move
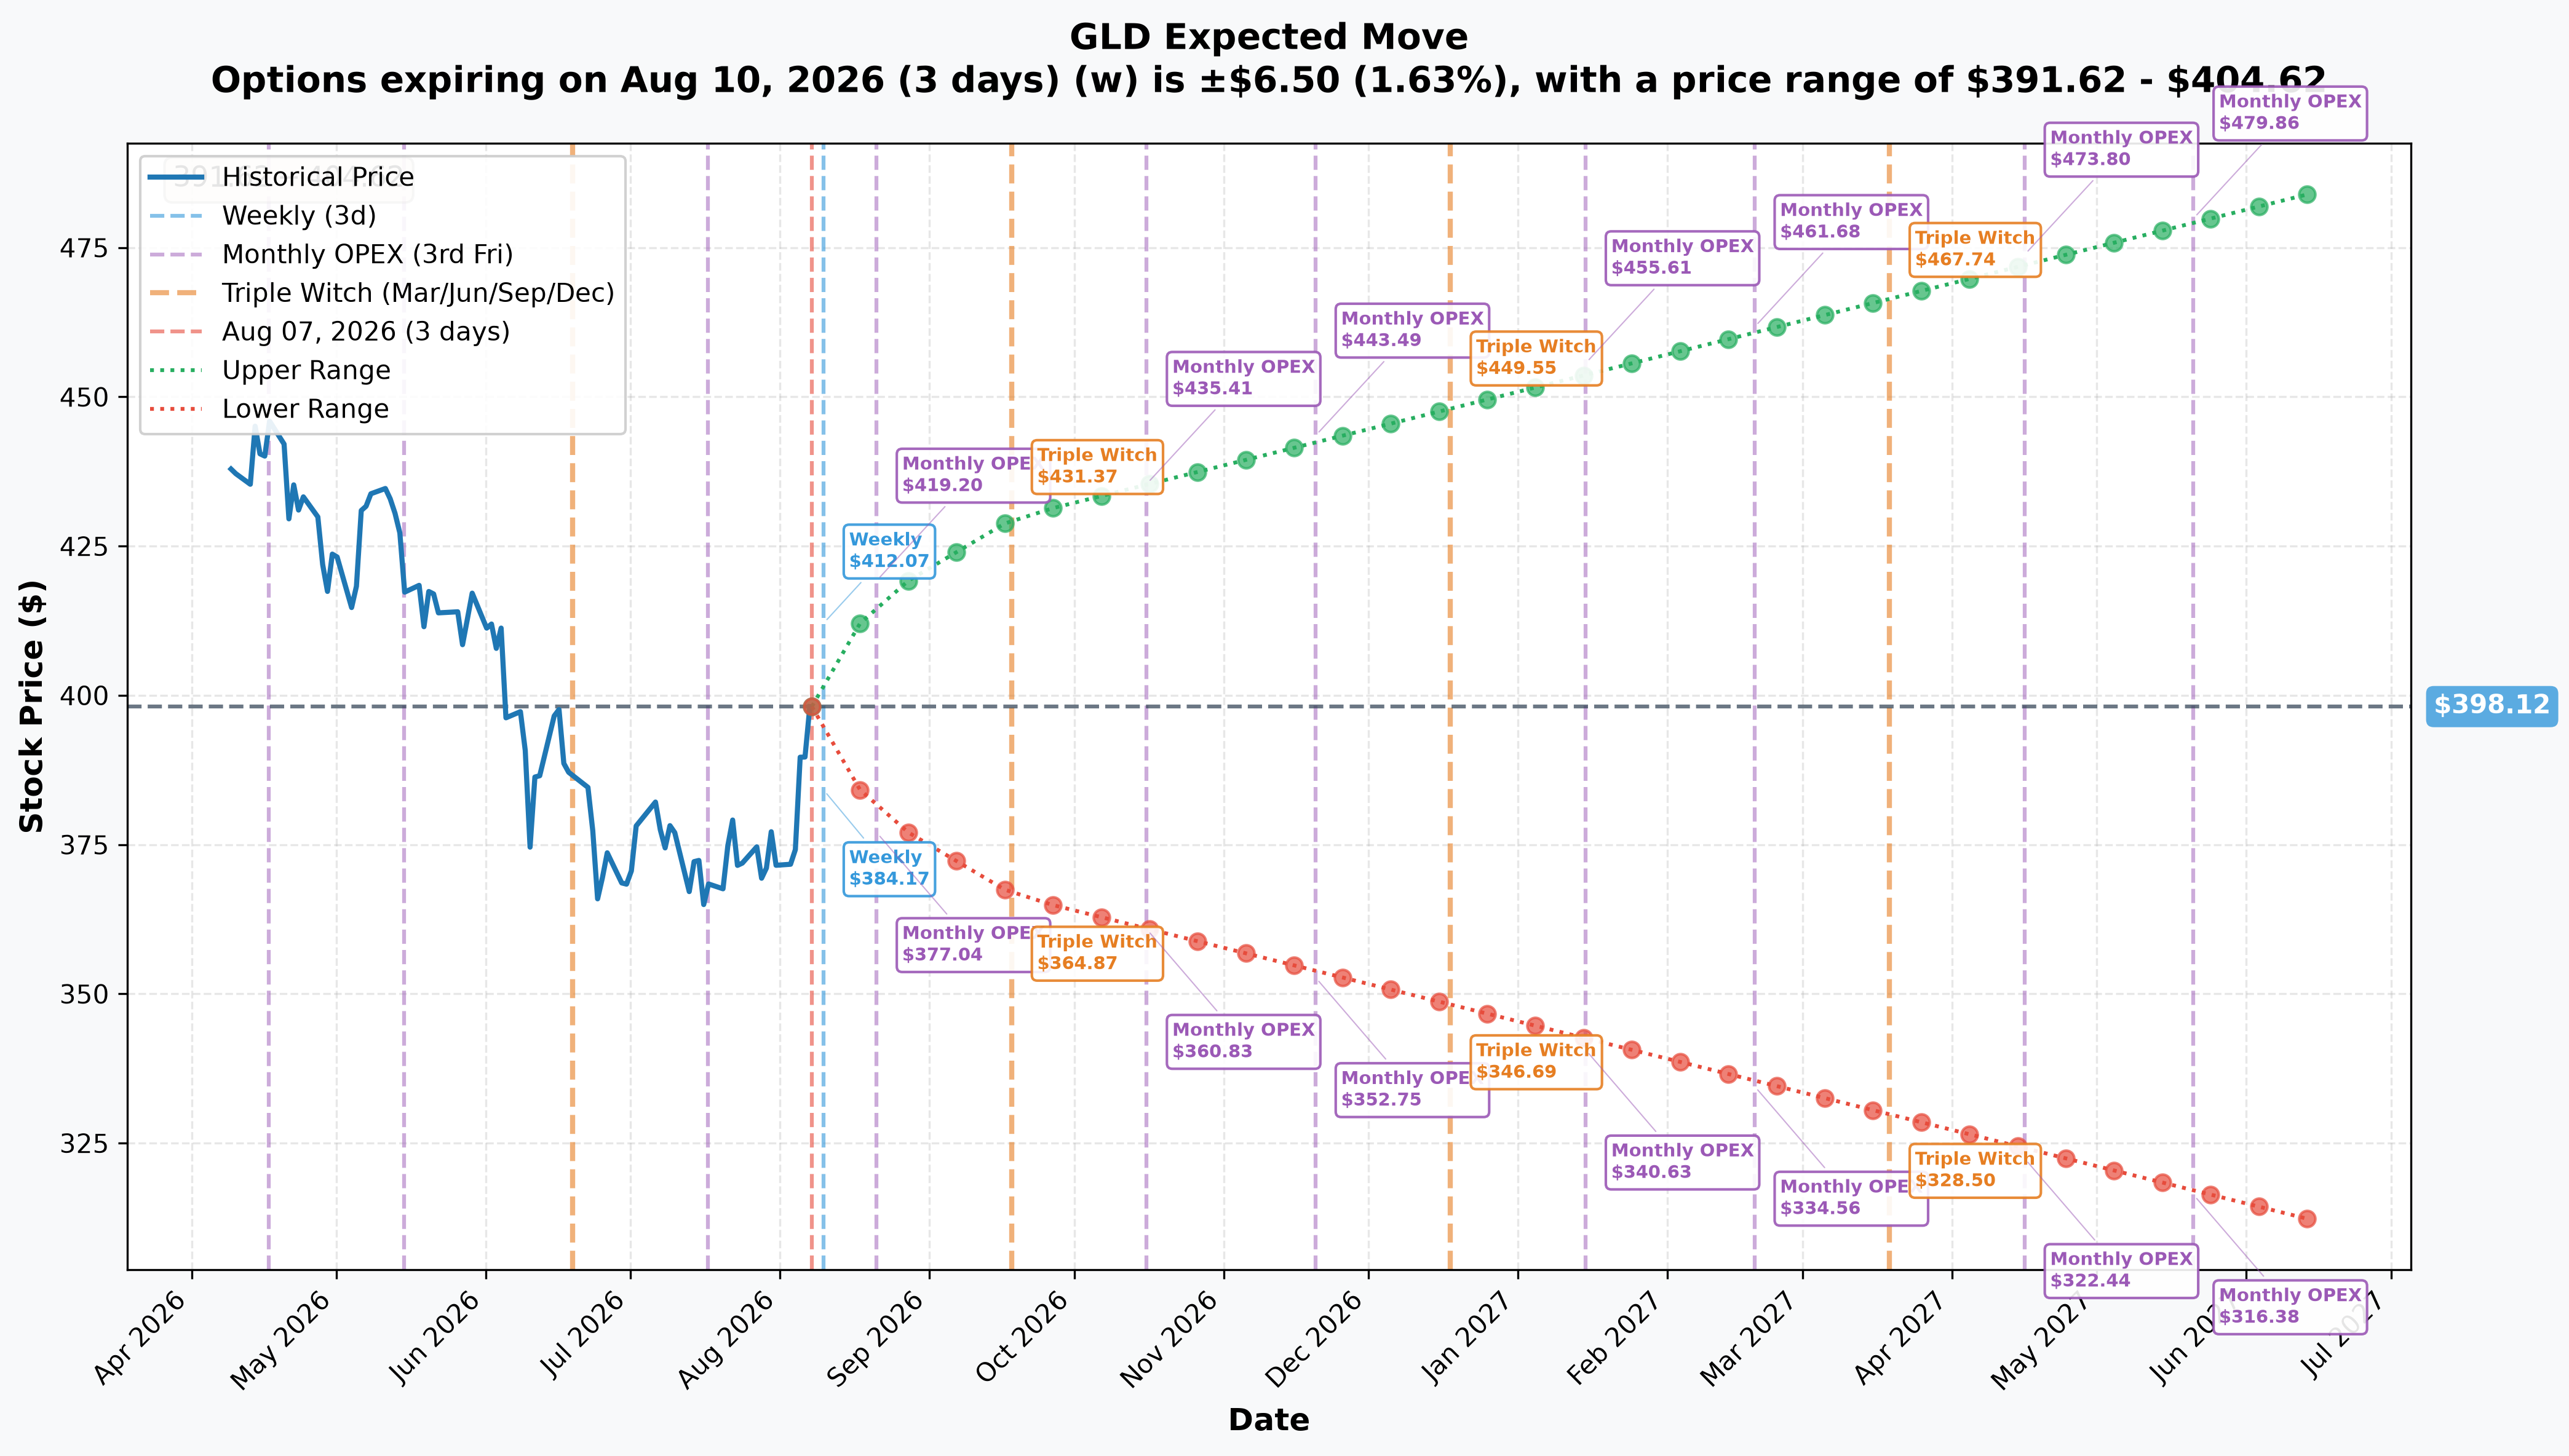
The chain prices ±1.63% by August 10 ($391.62–$404.62), ±4.57% by August 21 ($379.92–$416.32), ±7.94% by September 18 ($366.49–$429.75), and ±21.75% out to June 2027 ($311.53–$484.71).
This is the number that shows what the strangle is really asking for. The market's expected range through September 18 is $366.49–$429.75 — and the new strikes sit at $335 and $470, outside it on both sides. Even the June-2027 band ($311.53–$484.71) only just contains them.
So this desk is paying for a move the options market does not expect. That is what a wide strangle is: buying the tails cheaply because everyone else is pricing the middle.
📅 Catalysts
- ⭐ Gold at seven-week highs, ≈$4,300/oz. Drivers cited: weaker-than-expected U.S. employment data, reduced Fed rate-hike expectations, geopolitical developments, and central bank demand led by the People's Bank of China (StockAnalysis). One analyst argues "gold's rally has further to run as debt, de-dollarization fuel secular bull market."
- ⚠️ A genuine cross-current worth naming. The rally narrative cites reduced hike expectations — but the July 29 FOMC record shows the opposite pressure: held at 3.50–3.75% on a 9–3 vote, with three officials preferring a hike (Federal Reserve). Higher real rates are the classic headwind for a non-yielding asset. All three remaining meetings — September 15–16, October 27–28, December 8–9 — fall inside the November 20 expiry (Federal Reserve). A desk long volatility into three FOMC meetings has a coherent reason to be.
- GDX, the gold miners ETF, rose 6.12% today — roughly 2.8× GLD's move, which is the leverage miners carry. Notably, GDX's own largest trade today was a financing spread with no directional content, making this GLD package the only real gold-direction position on the board.
👥 Four Ways to Read This
🎲 The YOLO trader — the wings are genuinely cheap: $4.16 and $2.15. But understand what you would be buying. Both strikes sit outside the market's expected range through September, and a strangle's most common outcome is that both legs expire worthless. This desk can afford 92,625 of them; a retail account buying a handful is taking the same bet without the balance sheet.
📈 The swing trader — the near-term map is clear: $398 support, $400 resistance, with the fund pressed against the upper edge after a 2.17% day. The traded strikes tell you nothing about the next two weeks; they are a November position.
💰 The premium collector — this desk is doing your trade and your opposite at the same time: short the inner strangle, long the outer one. If you sell $470 calls or $335 puts here, you are taking the side they paid to own. But note the shape of what they built — the credit is trivial ($175,500 on $57.6M) and the loss bands are wide. This is not a premium-collection structure dressed up; it is a tail bet financed by one.
🌱 The beginner — this article is the lesson, including the part where we got it wrong. Checking open-interest history is what makes a big print legible — two strikes sat flat near 800 and 350 for weeks, then jumped overnight, which told us the strikes sold today had been bought yesterday. That was correct and useful. But we then took one step too far and assumed the same desk was unwinding. A matching strike and size does not identify a participant. Only the next morning's open interest separates "they closed it" from "somebody sold them more" — and this time it was the second one.
⚠️ Honest Risk and Limits — What the Tape Cannot Prove
- ✅ Settled by the August 10 snapshot: all four legs opened. The roll reading is refuted; yesterday's strangle is still on the books.
- The whole 39,000-contract $460 call sale is a new short, not the 10,371 minimum we estimated. Same for the $345 put sale. The short-strike risk is larger than the original article implied.
- We could not prove today's participant is yesterday's — and we should not have leaned on it. The strike-level match was strong evidence of what was being traded and weak evidence of by whom. That is the error this update corrects.
- A 39,000-share block crossed the equity tape at the same second with the flags that mark an options-related hedge — but it covers only ≈32% of the package's −120,802-share delta. We cannot tell you what the rest of the hedge is, or whether there is one. Open interest does not resolve this, and it remains unknown.
- Whether the two days are one book or two desks is still unproven. If it is one desk, the combined position nets to a wider strangle and the original intuition survives in economic terms. If it is two, a fresh seller simply faded yesterday's buyer. The tape cannot distinguish these, and we are not going to pick one.
- This structure needs a violent move, not merely a large one. Gold drifting anywhere between $345 and $460 through November leaves the package flat, and the $335 and $470 areas are outright losses.
Nothing here is investment advice.
Last updated: August 10, 2026 — ⏳ provisional open/close flags resolved against the August 10 OPRA open-interest snapshot. Our roll thesis was refuted; title, structure section and reader takes corrected accordingly.