🥇 GLD $40.1M Net Credit on $390M Gross — and the "Self-Financing Bullish" September Spread Was Actually Being CLOSED
📅 August 10, 2026 | 🔥 Unusual Activity Detected | ⚠️ Correction Inside
🔄 Updated 2026-08-11 pre-market — the next-day OPRA open interest resolved all four provisional legs, and two of them inverted the headline package's meaning. The November legs confirmed as opens, decisively ($470C 44,689 → 89,424; $460C 67,622 → 106,666). But the September $400/$425 "long call spread" — the bullish half of the ≈$308M package — resolved as a CLOSE on both legs, in lockstep: $400C 68,341 → 50,379 (−17,962) and $425C 58,412 → 40,384 (−18,028). Open interest fell where a genuine opening would have pushed it toward ≈123,000 and ≈113,000. The desk was not establishing bullish September upside — it was unwinding roughly 18,000 lots of an existing $400/$425 long spread while opening a 110,584-lot SHORT $420/$445 spread and a 55,292-lot short Sep-04 $410/$430 spread on top. That makes the September package materially more premium-selling and less bullish than this article originally described. See the ✅ RESOLVED box.
🎯 The Quick Take
GLD printed four separate packages today for ≈$40.13 million of net credit on ≈$390.0 million of gross premium — the largest gross dollar figure of any name on the board. The headline is a ≈$308 million, six-leg floor-block package at 15:27:26 whose two September call spreads almost exactly offset in cash — the $400/$425 spread against a $420/$445 spread at twice the size, netting just ≈$0.18M on ≈$243M of gross trading, plus a separate Sep-04 $410/$430 short call spread for ≈$26.82M credit. The resolved open interest shows those two spreads were doing opposite things: the $400/$425 leg was an existing long spread being unwound (both strikes' OI fell ≈18,000), while the $420/$445 and Sep-04 $410/$430 spreads were genuine new short spreads (+109,184 and +55,417). Cash-neutral on the day, but a clear rotation out of long September upside and into sold upside. We are also correcting an earlier read: the 13:37:56 Nov-20 $330 put we described as a SELL was cancelled on the tape and re-priced as a BUY — which turns the November package from a naked both-tails premium sale into a defined-risk condor with capped risk on both sides. Spot ≈$402.63-$403.
⚠️ CORRECTION — A Trade We Reported Has Been Busted, Re-Priced, and Its Direction Flipped
Say this plainly: an earlier read on GLD was wrong, and here is exactly why. The 13:37:56 print of 34,722 November-20 $330 puts at $1.77 (≈$6.15M), which we described as a SELL, carries a matching cancellation on the tape at 15:26:56. It was re-reported as two out-of-sequence prints totalling exactly the same 34,722 contracts — 18,192 at $1.81 and 16,530 at $1.82 — this time on the BUY side, at 93% across the NBBO (near the ask). In plain terms: the original print was busted, and when it came back, it came back as a purchase, not a sale.
Why this matters more than a simple correction. With the $330 put now bought instead of sold, the November package is no longer "sell both tails and collect the premium" — it is a defined-risk condor: short the $340/$330 put spread (sell $340, buy $330) and short the $460/$470 call spread (sell $460, buy $470). Selling a spread instead of a naked leg caps the maximum loss on both the downside and the upside. That is a materially safer structure than what we originally described, and it changes the read on this desk's risk tolerance — this looks like disciplined, defined-risk premium collection, not an unlimited-risk bet on gold staying range-bound. Net on the corrected four-leg November package: ≈$2.15 million credit, with capped risk on both wings.
The corrected CSV and every figure below reflect the busted-and-re-priced version. Any earlier "sells both tails, unlimited risk" framing for the November package is retracted.
📊 Fund Overview — What GLD Actually Is
GLD (SPDR Gold Shares) is a grantor trust that holds physical gold bullion — no futures, no swaps, no miners, no cash-settled derivatives. Per the fund's issuer page, GLD's objective is for the shares "to reflect the performance of the price of gold bullion, less GLD's expenses," with bullion held by custodians HSBC Bank plc and JPMorgan Chase Bank, N.A.
- Net assets (AUM): ≈$141.8 billion (Aug 7, 2026)
- Gross expense ratio: 0.40% — a permanent ≈0.30%/year drag versus its own cheaper sibling GLDM (0.10%)
- NAV per share: $397.72; share price today: ≈$399.91-$403
- 52-week range: $305.19 – $509.70; 1-year total return: +27.79%
GLD is not a fixed fraction of an ounce — each share represents roughly 0.0917 ounces of gold, a ratio that bleeds down every year as the trust sells bullion to pay the expense drag. GLD tracks spot gold directly (no futures roll, no contango/backwardation), has no earnings, no guidance, no management, no product cycle — every catalyst in this article is macro. GLD's edge over GLDM/IAU isn't cost, it's liquidity — a 0.01% median bid/ask spread and ≈6.5M shares/day — which is exactly why institutional options flow concentrates in GLD.
Framing correction, stated up front: 2026 has been a DOWN year for gold. The record was $5,405/oz on January 29, 2026; today's ≈$4,330 is ≈20% below that record. Do not read any of today's flow as "gold at all-time highs" — it is a sharp rebound inside a down year, not a breakout to new highs.
💰 The Trades — Plain English, By Package
Four separate packages printed today, in chronological order:
1️⃣ 10:51:16 — Short January-2027 $465 call, tape-recovered from Friday's thread
SELL 11,000 Jan-2027 $465 calls at $8.10 → ≈$8.91M collected. Prior OI 1,564 → size proves a genuine open. This leg was not visible in the original captured trade list; it was recovered directly from the OPRA tape as a single-leg block cross, and its SELL direction is inferred (it printed at ≈25% across the NBBO, closer to the bid) rather than read from an explicit buy/sell tag. Treat this one leg with a wider error bar than the rest.
2️⃣ 11:42:13 — January-2027 $335/$330 put credit spread, block cross 🤝
- BUY 45,000 Jan-2027 $330 puts at $3.11 → ≈$14.00M paid. Prior OI 1,900 → proven open.
- SELL 45,000 Jan-2027 $335 puts at $3.57 → ≈$16.07M collected. Prior OI 40,000 → proven open (size just clears OI).
Net: ≈$2.07M credit on a $5-wide spread — collecting a small credit against a capped loss if gold falls below $330 by mid-January. Both strikes sit well below spot (≈$399-403).
3️⃣ 13:37:56 + 15:26:56 (corrected) — Nov-20 defined-risk condor, floor block 🤝
- BUY 30,993 Nov-20 $470 calls at $4.50 → ≈$13.95M paid. Prior OI 45,000 → size ≤ OI at the time; ✅ resolved OPEN (OI 44,689 → 89,424).
- SELL 29,645 Nov-20 $340 puts at $2.42 → ≈$7.17M collected. Prior OI 1,400 → proven open.
- SELL 26,950 Nov-20 $460 calls at $5.65 → ≈$15.23M collected. Prior OI 68,000 → size ≤ OI at the time; ✅ resolved OPEN (OI 67,622 → 106,666).
- BUY (corrected) 34,722 Nov-20 $330 puts — printed as two out-of-sequence fills, 18,192 at $1.81 and 16,530 at $1.82 → ≈$6.30M paid combined. Prior OI 3,456 → size well above OI, proven open. This is the corrected leg — see the correction box above.
Net on this four-leg condor: ≈$2.15M credit, with the maximum loss capped at each spread's width minus the credit collected — a materially different (and materially safer) risk profile than a naked both-tails sale.
4️⃣ 15:27:26 — The headline: a ≈$308M, six-leg, nearly self-financing gold package, floor block 🤝
Spot ≈$402.63. This is the largest single print of the day on GLD.
Sep-18 $400/$425 call spread — printed as a long spread, ✅ resolved as an UNWIND of an existing long spread:
- BUY 55,070 Sep-18 $400 calls — 23,080 at $15.66 + 31,990 at $15.65 → ≈$86.21M paid. Prior OI 68,341 → 🔄 resolved CLOSE (OI fell to 50,379, −17,962).
- SELL 55,070 Sep-18 $425 calls at $6.35 → ≈$34.97M collected. Prior OI 58,412 → 🔄 resolved CLOSE (OI fell to 40,384, −18,028).
- Net: ≈$51.24M debit.
Sep-18 $420/$445 call spread, SHORT — at exactly twice the size:
- SELL 110,584 Sep-18 $420 calls at $7.85 → ≈$86.81M collected. Prior OI 20,521 → proven open.
- BUY 110,584 Sep-18 $445 calls at $3.20 → ≈$35.39M paid. Prior OI 5,855 → proven open.
- Net: ≈$51.42M credit.
These two nearly cancel: net ≈$0.18M on ≈$243M of gross Sep-18 trading. The long spread is financed almost exactly by the short spread at double the size — the same self-financing signature as Friday's original gold package. That self-financing structure is the actual headline here, not the raw dollar figure: a desk moved roughly a quarter of a billion dollars of gold exposure for essentially no net premium.
Sep-04 $410/$430 call spread, SHORT:
- SELL 55,292 Sep-04 $410 calls at $8.30 → ≈$45.89M collected. Prior OI 209 → proven open.
- BUY 55,292 Sep-04 $430 calls at $3.45 → ≈$19.08M paid. Prior OI 78 → proven open.
- Net: ≈$26.82M credit.
One leg deserves a specific callout: the $425 call printed BELOW the bid, at −100% across the NBBO — the only leg on the entire board today to do so. That is a genuine, tape-confirmed sign of seller urgency on that specific strike, distinct from the rest of the package, which printed at normal negotiated-block levels.
Package 4 net: ≈$27.00M credit (Sep-18's ≈$0.18M + Sep-04's ≈$26.82M) on ≈$308.34M gross, across ≈442,000 total contracts.
GLD total: ≈$40.13M net credit across four packages (≈$8.91M + ≈$2.07M + ≈$2.15M + ≈$27.00M), on ≈$390.0M gross — the largest gross dollar figure of any name on today's board.
This is a direct continuation of Friday's gold package. Friday's structure was a self-financing double backspread, and the open interest proves the lineage: the Nov-20 $460 call went 790 contracts → 28,629 on August 7 → 67,622 as of today's prior-OI snapshot, exactly the trajectory predicted in the morning OI review.
Full trade-details table — all 15 legs
| Time | Buy/Sell | Call/Put | Expiration | Premium | Strike | Volume | OI | Size | Spot | Opt. Price | Symbol | Order Type | Strategy |
|---|---|---|---|---|---|---|---|---|---|---|---|---|---|
| 10:51:16 ⚠️ | SELL (inferred) | CALL | 2027-01-15 | $8.91M | $465 | 15,346 | 1,564 | 11,000 | $398.53 | $8.10 | GLD20270115C465 | STO | Short Call Jan-2027 465 (tape-recovered) 🤝 |
| 11:42:13 | BUY | PUT | 2027-01-15 | $14.00M | $330 | 45,000 | 1,900 | 45,000 | $399.03 | $3.11 | GLD20270115P330 | BTO | Put Credit Spread Jan-2027 335/330 🤝 |
| 11:42:13 | SELL | PUT | 2027-01-15 | $16.07M | $335 | 45,000 | 40,000 | 45,000 | $399.03 | $3.57 | GLD20270115P335 | STO | Put Credit Spread Jan-2027 335/330 🤝 |
| 13:37:56 | BUY | CALL | 2026-11-20 | $13.95M | $470 | 31,000 | 45,000 | 30,993 | $400.27 | $4.50 | GLD20261120C470 | ✅ BTO (resolved OPEN) | Nov-20 Condor (340/330P + 460/470C) 🤝 |
| 13:37:56 | SELL | PUT | 2026-11-20 | $7.17M | $340 | 30,000 | 1,400 | 29,645 | $400.27 | $2.42 | GLD20261120P340 | STO | Nov-20 Condor (340/330P + 460/470C) 🤝 |
| 13:37:56 | SELL | CALL | 2026-11-20 | $15.23M | $460 | 27,000 | 68,000 | 26,950 | $400.27 | $5.65 | GLD20261120C460 | ✅ STO (resolved OPEN) | Nov-20 Condor (340/330P + 460/470C) 🤝 |
| 15:26:56 🔧 | BUY (corrected) | PUT | 2026-11-20 | $3.01M | $330 | 65,000 | 3,456 | 16,530 | $402.64 | $1.82 | GLD20261120P330 | BTO | Nov-20 Condor — corrected leg, replaces cancelled 13:37:56 SELL 🤝 |
| 15:26:56 🔧 | BUY (corrected) | PUT | 2026-11-20 | $3.29M | $330 | 83,000 | 3,456 | 18,192 | $402.64 | $1.81 | GLD20261120P330 | BTO | Nov-20 Condor — corrected leg, replaces cancelled 13:37:56 SELL 🤝 |
| 15:27:26 | BUY | CALL | 2026-09-18 | $36.14M | $400 | 58,000 | 68,341 | 23,080 | $402.63 | $15.66 | GLD20260918C400 | 🔄 BTC (resolved CLOSE) | Sep-18 400/425 Call Spread — being unwound 🤝 |
| 15:27:26 | BUY | CALL | 2026-09-18 | $50.06M | $400 | 35,000 | 68,341 | 31,990 | $402.63 | $15.65 | GLD20260918C400 | 🔄 BTC (resolved CLOSE) | Sep-18 400/425 Call Spread — being unwound 🤝 |
| 15:27:26 | SELL | CALL | 2026-09-18 | $34.97M | $425 | 56,000 | 58,412 | 55,070 | $402.63 | $6.35 | GLD20260918C425 | 🔄 STC (resolved CLOSE) | Sep-18 400/425 Call Spread — being unwound; −100% across NBBO 🤝 |
| 15:27:26 | SELL | CALL | 2026-09-18 | $86.81M | $420 | 115,000 | 20,521 | 110,584 | $402.63 | $7.85 | GLD20260918C420 | STO | Sep-18 420/445 Call Spread (short, 2× size) 🤝 |
| 15:27:26 | BUY | CALL | 2026-09-18 | $35.39M | $445 | 111,000 | 5,855 | 110,584 | $402.63 | $3.20 | GLD20260918C445 | BTO | Sep-18 420/445 Call Spread (short, 2× size) 🤝 |
| 15:27:26 | SELL | CALL | 2026-09-04 | $45.89M | $410 | 55,000 | 209 | 55,292 | $402.63 | $8.30 | GLD20260904C410 | STO | Sep-04 410/430 Call Spread (short) 🤝 |
| 15:27:26 | BUY | CALL | 2026-09-04 | $19.08M | $430 | 56,000 | 78 | 55,292 | $402.63 | $3.45 | GLD20260904C430 | BTO | Sep-04 410/430 Call Spread (short) 🤝 |
🤝 = negotiated block (floor block or block cross) — a broker matched a known counterparty off the lit book. Every leg today was a negotiated block; there is no urgency to read into the mechanism itself, with the single tape-confirmed exception of the $425 call's −100%-across print noted above.
✅ RESOLVED — The November Legs Opened; the September $400/$425 Spread Was Being Unwound
Updated 2026-08-11 pre-market. Resolving OPRA snapshot timestamped August 11 (reflects the August 10 close); baseline is the August 10 snapshot (reflects August 7 — before these prints).
| Leg | Baseline (Aug-10) | Resolving (Aug-11) | Δ | Print size | Δ as % | Day vol | Our published prediction | Verdict |
|---|---|---|---|---|---|---|---|---|
| Nov-20 $470 call (bought) | 44,689 | 89,424 | +44,735 | 30,993 | +144.3% | 45,330 | ≈76,000 if opening | ✅ OPEN (BTO) — decisive |
| Nov-20 $460 call (sold) | 67,622 | 106,666 | +39,044 | 26,950 | +144.9% | 39,411 | ≈95,000 if opening | ✅ OPEN (STO) — decisive |
| Sep-18 $400 call (bought) | 68,341 | 50,379 | −17,962 | 55,070 | −32.6% | 57,998 | ≈123,000 if opening; falls if closing | 🔄 CLOSE — was BTO ⏳ |
| Sep-18 $425 call (sold) | 58,412 | 40,384 | −18,028 | 55,070 | −32.7% | 56,348 | ≈113,000 if opening; falls if closing | 🔄 CLOSE — was STO ⏳ |
And, for completeness, the eleven legs that were already provable opens all confirmed: Jan-15 $465C 1,564 → 12,031; Jan-15 $330P 1,927 → 46,193; Jan-15 $335P 39,593 → 64,172; Nov-20 $340P 1,369 → 43,320; Nov-20 $330P 3,456 → 52,816; Sep-18 $420C 20,521 → 129,705 (+109,184 on a 110,584 print); Sep-18 $445C 5,855 → 115,393 (+109,538); Sep-04 $410C 209 → 55,626; Sep-04 $430C 78 → 55,594. Nothing in the rest of the board moved against expectation.
The two November legs blew past the predicted numbers. We said an opening $470 call would push open interest toward ≈76,000 — it printed 89,424, a rise of 44,735 against a 30,993-lot print, meaning other participants were building the same strike alongside this desk. Same story at $460 (+39,044 on a 26,950 print). The defined-risk condor is real, opened, and being added to more broadly than one desk's package.
The September $400/$425 spread is the inversion, and the lockstep is what proves it. Both legs lost almost exactly the same number of contracts — −17,962 and −18,028, a difference of 66 across a 55,070-lot print. Two strikes moving down together by an identical amount is the signature of one two-legged position being retired, not two unrelated flows. Roughly 33% of the print retired open interest and ≈67% transferred to new holders, so this was a partial unwind of a larger existing spread rather than a clean full exit.
What that does to the story. We described the ≈$308M package as "almost perfectly self-financing" — a long $400/$425 spread paid for by a double-size short $420/$445 spread — and framed the net as moderately bullish with a capped-cost tilt. The open interest says the long half was an exit, not an entry. What actually entered the market on August 10 was: a 110,584-lot short $420/$445 call spread, a 55,292-lot short Sep-04 $410/$430 call spread, and the November condor — all premium-selling, defined-risk structures. The bullish September tilt we credited to this desk was them taking that tilt off. Read the September package as a roll out of long upside and into short upside, and the day's gold posture as decidedly more short-volatility than the original write-up implied.
🤓 What This Actually Means — Plain English
Call spreads, in one sentence: buying a call spread (buy a lower strike, sell a higher strike) caps both your cost and your maximum payout — you profit if the stock rises but your gain tops out at the short strike. Selling a call spread (sell the lower strike, buy the higher strike as protection) collects a credit up front and caps your maximum loss at the strike width. Every leg in today's ≈$308M package is one side or the other of that trade — nobody sold a naked, uncapped call today.
The self-financing insight — and the correction the open interest forced on it. On the tape, the desk bought a $400/$425 call spread (≈$51.24M cost) and simultaneously sold a $420/$445 call spread at exactly twice the number of contracts (≈$51.42M collected), so the credit almost exactly paid for the debit — net ≈$0.18M on ≈$243M of gross trading. We originally read that as the desk acquiring long $400–$425 upside, funded by selling the bigger rally above $420 — a moderately bullish, capped-cost structure.
The next-day open interest says the long half was an exit. Open interest at $400 and $425 both fell by ≈18,000 contracts, in near-perfect lockstep, where a genuine opening would have driven them toward ≈123,000 and ≈113,000. So the correct reading is: the desk closed part of a $400/$425 long call spread it already held, and used the proceeds to put on a much larger short $420/$445 spread (110,584 lots, open interest +109,184 and +109,538 — unambiguously new). The Sep-04 short $410/$430 spread on top (+55,417 / +55,516, also unambiguously new) is pure premium collection: betting gold does not clear $410 by September 4, with the loss capped at $20 of width if it does.
Net effect on positioning, in plain terms: long September gold upside left this desk's book and short September gold upside entered it, at roughly double the size. That is the opposite of a bullish tilt. The lesson worth carrying: a spread's cash flows tell you what it cost, not which direction the position moved. Only open interest separates "buying a call spread" from "selling back the call spread you already owned" — the two look identical on the tape.
The condor, corrected. A condor sells two credit spreads at once — one on the put side, one on the call side — betting the underlying stays inside a range through expiration. After today's correction, GLD's November structure is: short the $340/$330 put spread (collect credit, lose money only if gold falls below $330) and short the $460/$470 call spread (collect credit, lose money only if gold rallies past $470). Both losses are capped at the strike width minus the credit collected — that is the entire point of a condor versus selling naked puts and calls. The corrected version we're publishing today is meaningfully lower-risk than the naked-both-tails read we originally reported, and it is worth saying so plainly: this desk is running defined-risk premium collection, not open-ended tail selling.
Motive, stated honestly: across all four packages, this reads as an institutional desk running a structured, defined-risk volatility-selling program on gold, financed in large part by selling spreads at scale rather than buying naked protection. We originally credited the Sep-18/Sep-04 package with adding a genuinely bullish tilt (long $400/$425 exposure); the resolved open interest removes that qualifier — the long $400/$425 exposure was being closed, so every structure that actually opened on August 10 was a defined-risk short spread or condor. The program is more uniformly premium-selling than we first described, and capped-risk throughout.
📈 Technical Setup / Chart Check-Up
YTD Chart
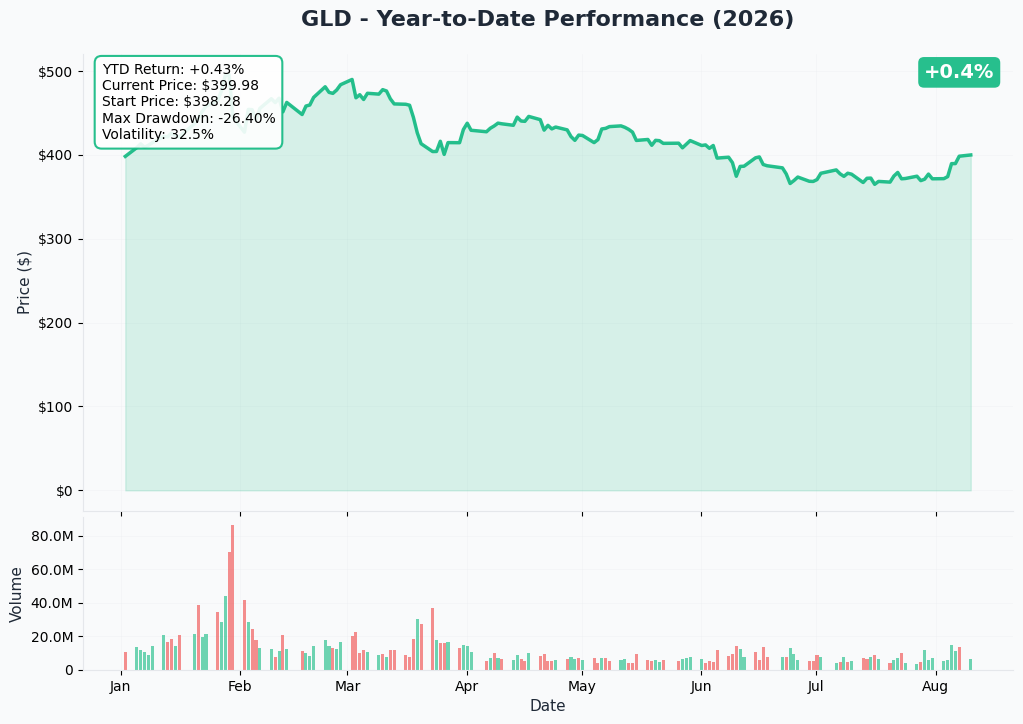
GLD's 52-week range is $305.19–$509.70, 1-year total return +27.79%. That range hides a violent 2026: gold's all-time record of $5,405/oz was set January 29, 2026, followed by a correction to $4,001.80 on June 25, 2026 (≈26% drawdown), and a down-7.8%-YTD stretch through July 31 before the week of August 3-7 delivered its best week since January — a ≈$300 (+7%) surge on soft labor-market data. Gold today at ≈$4,330/oz remains ≈20% below its January record. This is a sharp rebound inside a down year, not new highs.
Gamma-Based Support & Resistance Analysis
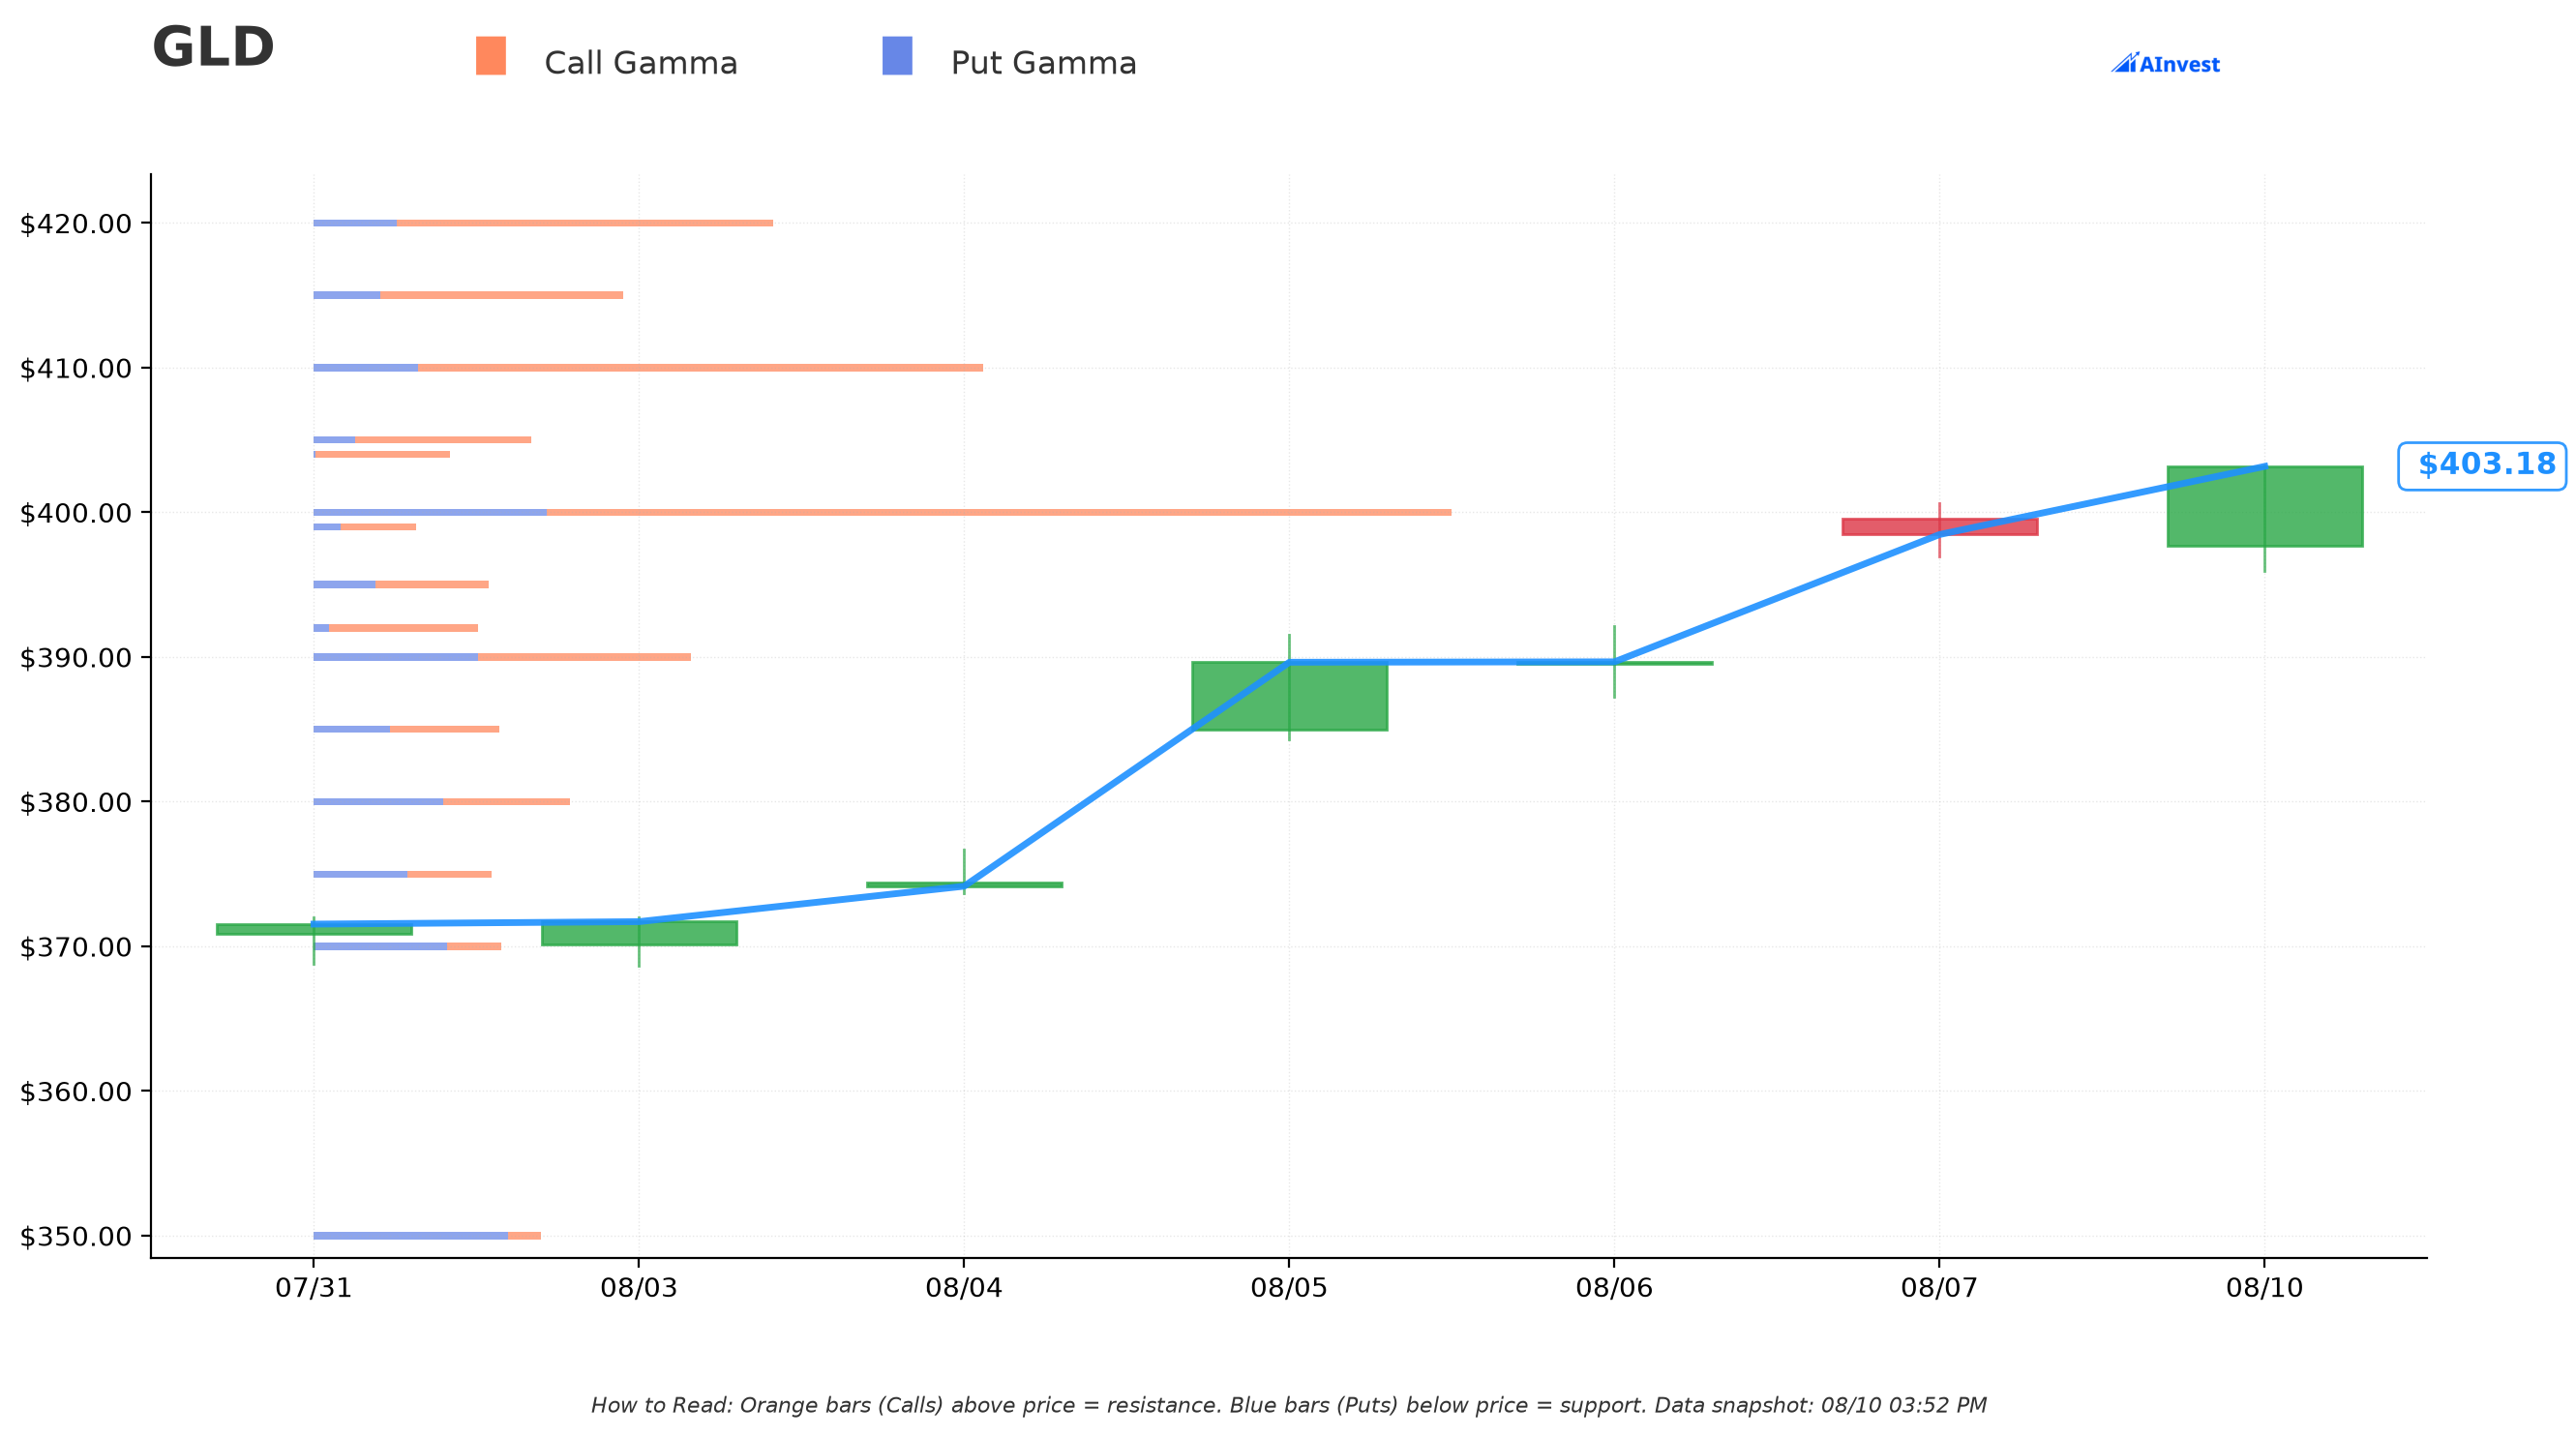
Current price per the gex.json snapshot: $403.02.
🔵 Support (Put Gamma Below Price):
- $400 — Very Strong, essentially at-the-money (total GEX ≈101.8, net GEX ≈60.2) — this is also the exact long strike of today's Sep-18 call spread.
- $390 — Very Strong (total GEX ≈33.7)
- $380 — Very Strong (total GEX ≈22.9)
🟠 Resistance (Call Gamma Above Price):
- $410 — Very Strong, the nearest ceiling (total GEX ≈59.7, net GEX ≈41.1), ≈1.7% above spot — the exact short strike of the Sep-04 spread.
- $420 — Very Strong (total GEX ≈40.9, net ≈26.2), ≈4.2% above spot — the exact short strike of the Sep-18 420/445 spread.
- $425 — Very Strong (total GEX ≈38.9, net ≈30.6), ≈5.5% above spot — the exact short strike of the Sep-18 long spread, and the −100%-across leg.
- $430 — Very Strong (total GEX ≈38.2, net ≈32.3), ≈6.7% above spot — the exact long strike of the Sep-04 spread.
- $460 and $470 — total GEX ≈22.3 and ≈18.5 — the exact strikes of the November condor's call side.
What this means for traders: today's entire six-leg gold package was built almost exactly on top of the existing gamma resistance ladder — $410, $420, $425, and $430 are already among the strongest call-gamma walls above spot, before accounting for today's new size. That means dealer hedging flow at those strikes was already meaningful, and today's trade adds directly to it. GLD is pinned near $400-403 right now, with $410 as the first real test.
Implied Move Analysis
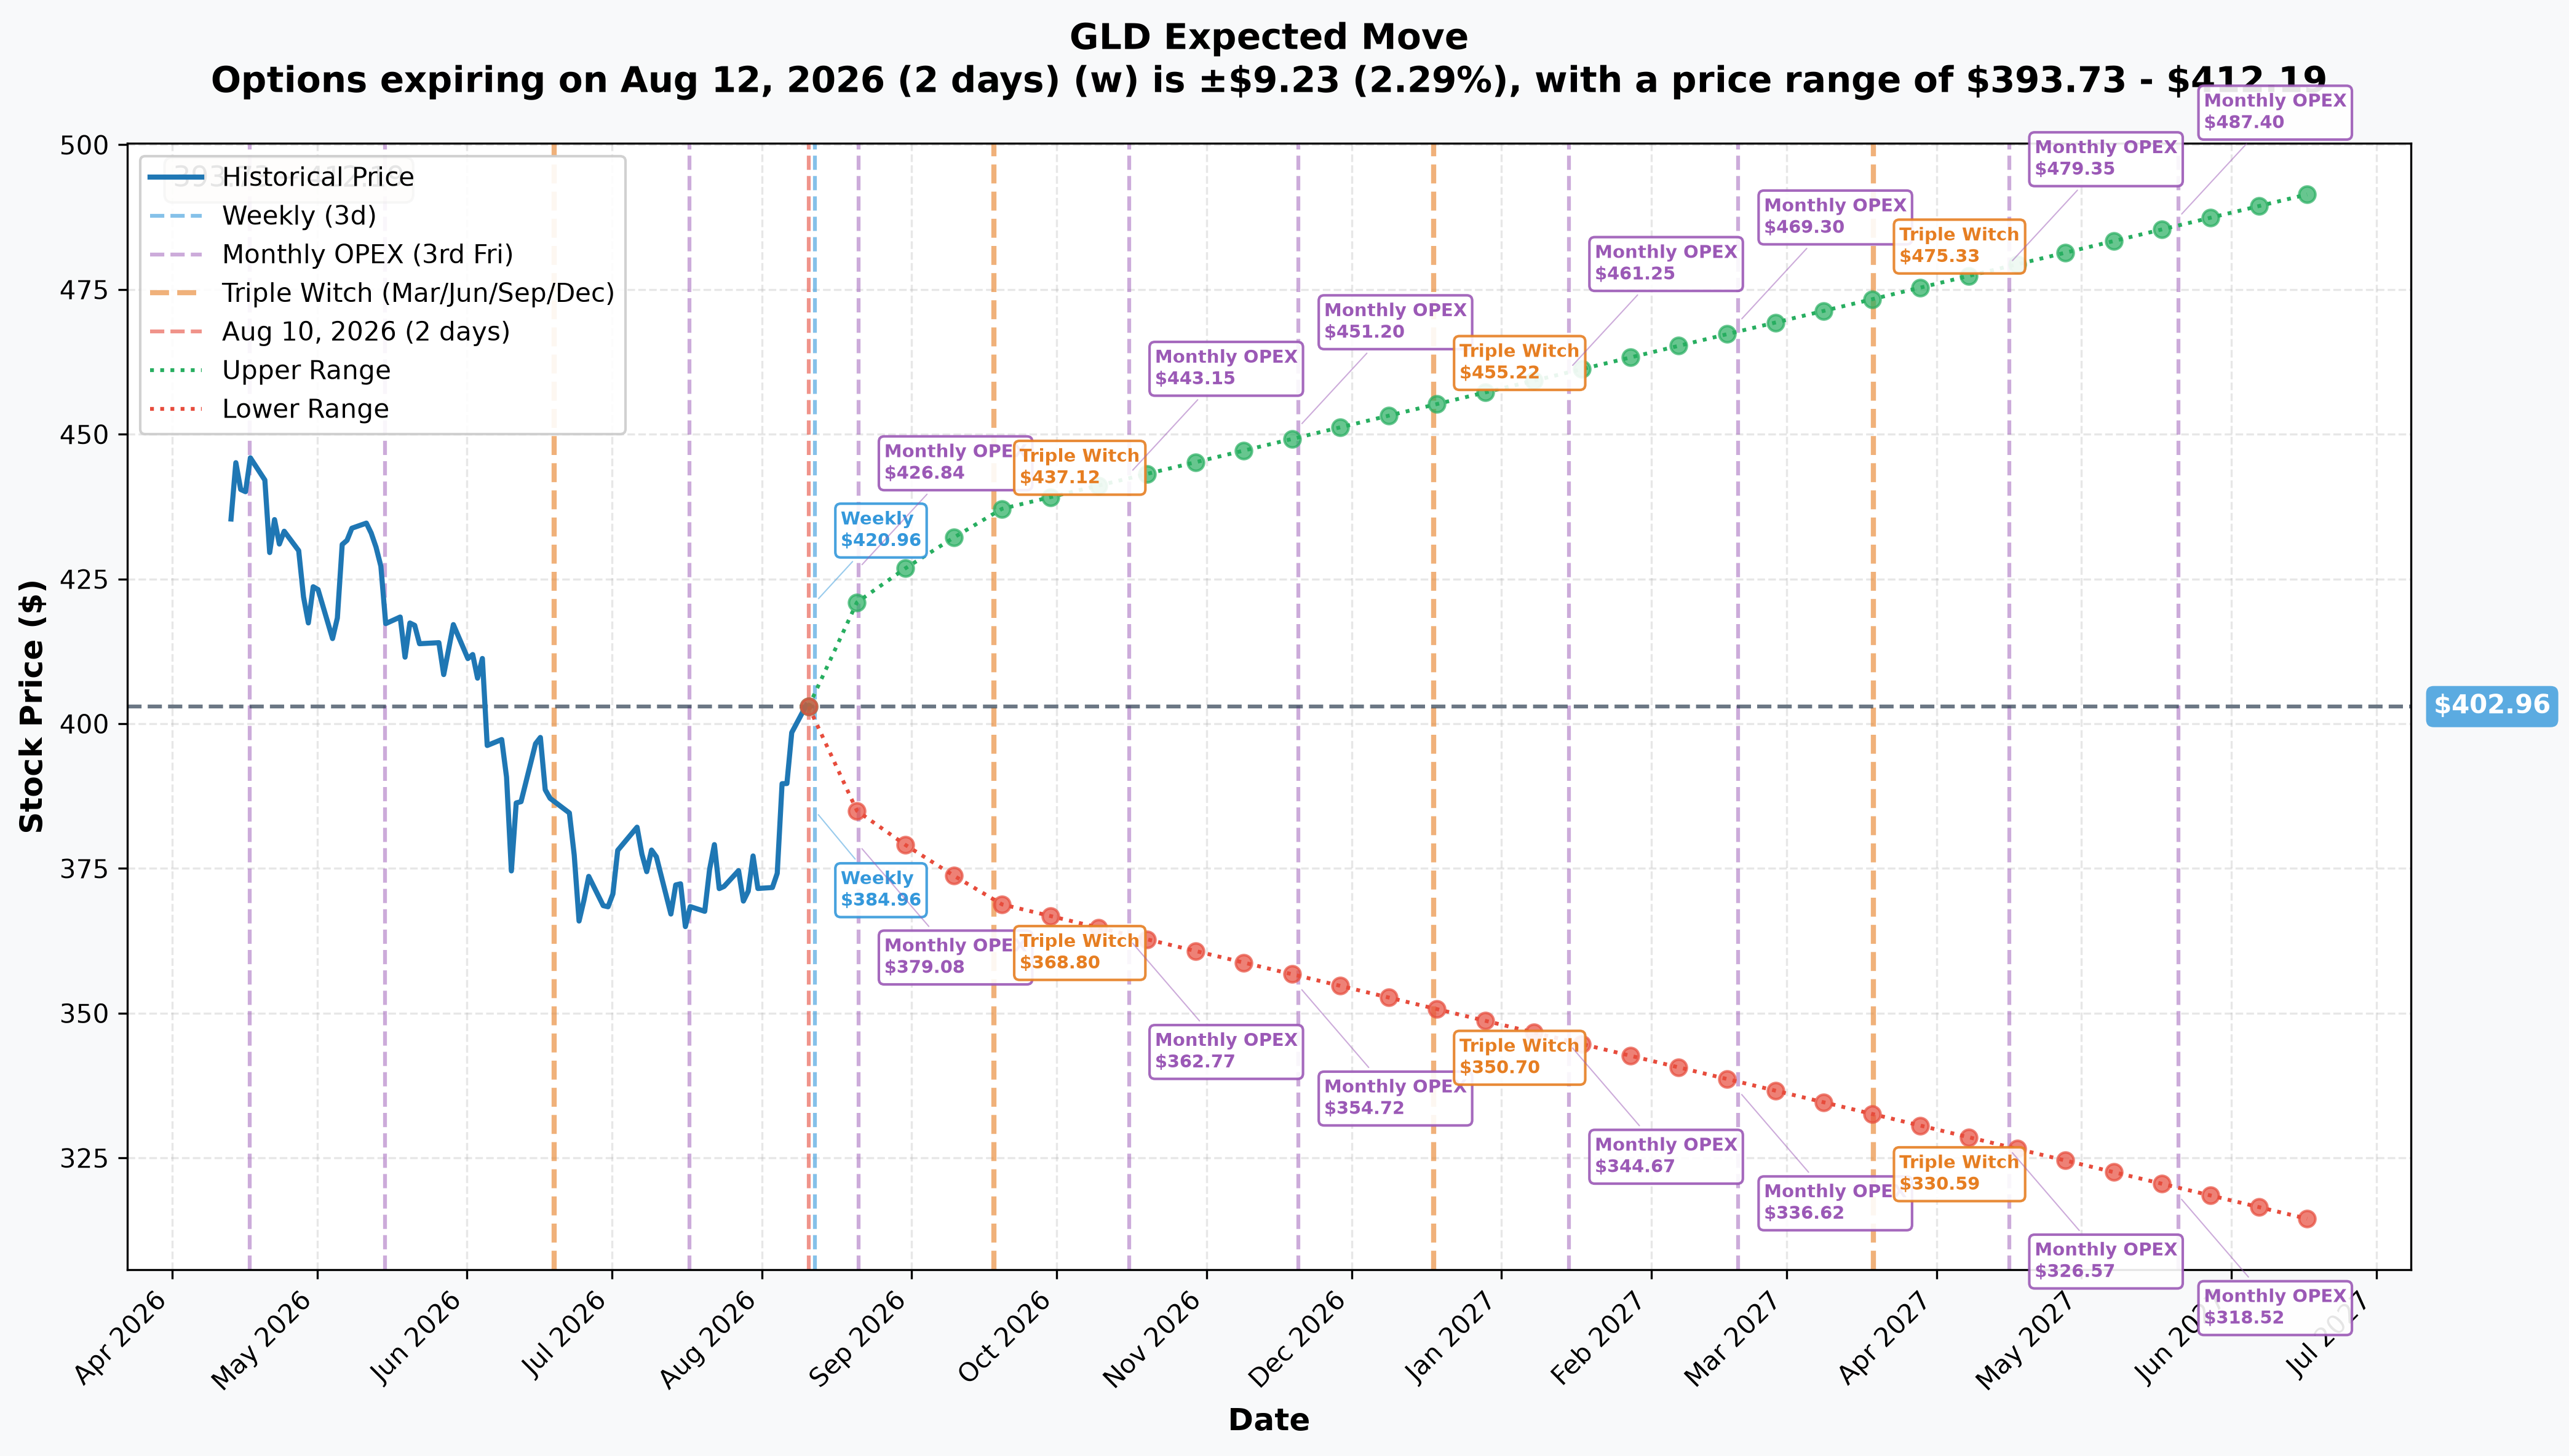
Per the options market's own pricing (implied_move.json), current price $402.96:
- Weekly (Aug 12, 2 days): ±2.29% (±$9.23) → range $393.73 – $412.19
- Monthly OPEX (Aug 21, 11 days): ±4.74% (±$19.10) → range $383.86 – $422.06
- Quarterly/Triple Witch (Sep 18, 39 days — the exact expiry of the $400/$425/$420/$445 legs): ±8.43% (±$33.96) → range $369.00 – $436.92; OPEX table bounds $368.80 – $437.12
- Sep-04 (25 days — no dedicated print; nearest bracket is the Aug 21 / Sep 18 pair above): implied range is somewhere between ≈$384 and ≈$429, interpolating between the two labeled tenors — treat as approximate.
- Nov-20 OPEX (102 days — the condor's expiry): implied bounds $354.72 – $451.20
- Jan-15, 2027 OPEX (158 days): implied bounds $344.67 – $461.25
- LEAPS (June 2027, 311 days, broader context): ±22.0% (±$88.66) → range $314.30 – $491.62
Translation: the Sep-18 long $400/$425 call spread sits entirely inside the market's own 39-day implied range ($369-$437) — a genuinely directional bet the market itself thinks is plausible. The short $420/$445 spread straddles the top of that range: $420 is inside it, but $445 sits just above the $437 ceiling — cheap, out-of-the-range protection. On the November condor, the $460 call and $470 call both sit above the $451 top of the 102-day implied range, and the $330/$340 puts sit below the $355 bottom — both wings are being sold outside the market's own expected move, which is exactly the economics of defined-risk premium collection. The Jan-2027 $465 call and $330/$335 put spread follow the identical pattern one tenor further out.
🎪 Catalysts
⚠️ Catalyst dates and option expiration dates are different things. Today's flow touches four expirations: September 4, 2026, September 18, 2026, November 20, 2026, and January 15, 2027 — contract dates only, not events.
The Sep-04 and Sep-18 expirations are new to the board — and very near-dated
Both land inside the highest-density catalyst window of the next month. Wednesday, August 12 — July CPI, per Kitco's August 10 AM report and confirmed by Trading Economics, is the single most important date on the calendar and lands inside both the Sep-04 and Sep-18 windows. MKS PAMP's Nicky Shiels was blunt: "CPI needs to really miss next week for expectations of the Fed remaining on hold throughout this year" (Kitco, Aug 7). Also inside both near windows: PPI (Aug 13), retail sales (Aug 14), the August employment report (Sep 4 — the very day the Sep-04 contracts expire), and, for the Sep-18 leg specifically, the September 15-16 FOMC decision with a fresh Summary of Economic Projections, per the Federal Reserve's calendar — that FOMC decision lands just two days before the Sep-18 contracts expire.
What the November and January legs add on top
The November condor also captures the October 27-28 FOMC (no SEP). The January legs (the $465 call and the $330/$335 put spread) additionally capture the December 8-9, 2026 FOMC meeting with a fresh dot plot — per the Fed's calendar, this is entirely inside the January window and entirely outside the November window, and it is the single highest-information Fed event before either contract's practical relevance ends. Note the January contracts still expire 11 days before the January 26-27, 2027 FOMC — neither GLD expiration in today's flow survives to see that meeting.
The macro backdrop driving gold right now
Gold's rally springs from a genuine labor-market crack: July nonfarm payrolls came in at −23,000 versus an expected +85,000 gain, with prior months revised lower, per Kitco, August 7. ADP private payrolls also missed (+44,000 vs. +65,000 forecast). This matters because the market has been pricing Fed hikes, not cuts, for most of 2026 — a reversal of the 2025 script — so for gold this year, lower hike odds are the bullish signal. State Street's Aakash Doshi called this "peak hawkishness" in a July 28 Kitco interview; September hike odds have fallen to ≈44% from roughly two-thirds a week earlier.
Underneath the macro noise, central banks bought the entire 2026 correction: the PBoC added 20 tonnes in July — its largest monthly purchase since October 2023, extending a 21-month buying streak — per Kitco, August 7. GLD's own demand channel, North American ETF flows, just turned from −$5.5 billion in June to +$71 million in July, per the WGC's July flow report, though North America remains net-negative for the year.
On the bear side: real yields (10-year TIPS ≈2.41%, the highest since October 2023, per Kitco, Aug 7) remain the dominant headwind if they haven't actually peaked, and gold sits just below the widely-watched $4,400 50-week moving average, flagged as resistance by Kitco.
🎲 Four-Reader Interpretation
🎰 YOLO Trader
There is nothing here to YOLO. Every leg is a negotiated block sized for an institutional book, and three of the four packages are explicitly capped-risk spreads or condors built to profit from gold staying inside a range, not from a big directional move. Even the one genuinely directional piece — the Sep-18 $400/$425 long call spread — is financed by giving away most of the upside above $420, which is the opposite of a lottery-ticket structure. If you want to express a real directional view, a single small-size call or put near the money, sized to what you can lose, is a more honest trade than trying to replicate any of these four packages.
📊 Swing Trader
The Sep-18 long $400/$425 call spread is the one piece of today's flow with a real directional lean, and it sits entirely inside the market's own 39-day implied range of $369-$437. A swing trader sharing a modestly bullish gold view into the September 15-16 FOMC could look at a smaller-scale version of the same structure — buy a near-the-money call, sell a call roughly 5-6% higher to reduce cost — sized at a fraction of this desk's 55,000+ contracts. Watch August 12 CPI as the next volatility trigger for the near-dated Sep-04 contracts specifically, since that expiration sits just 23 days out.
💰 Premium Collector
This is your natural habitat, and the corrected structure is actually the better teaching example today. The November condor — after correction — collects ≈$2.15M by selling the $340/$330 put spread and the $460/$470 call spread, with losses capped at each spread's width minus the credit, not open-ended. That is the textbook way to run this strategy: know your maximum loss before you put the trade on, the same discipline this desk demonstrated by using spreads instead of naked legs throughout all four packages today. If you're sizing a similar structure, calculate your worst-case dollar loss on each spread before entering, and make sure it's a number you can survive — this desk's condor risks roughly $10 of width per contract on the put side and roughly the same on the call side, scaled to whatever size fits your account.
🌱 Beginner
The one-sentence version: a trading desk placed four separate bets today, and three of the four are structured so the most they can lose is capped and known in advance — that's what a "spread" or "condor" means, as opposed to selling an option naked, where losses can be unlimited. The fourth piece (the Sep-18/Sep-04 package) is a wash in cash but not in direction: the next-day open-interest data shows they were selling back upside they already owned and opening a larger short-upside spread against it, so the net result leans away from a rally, not toward one. If any of this is your first exposure to options, start with buying a single call or put you fully understand before attempting multi-leg spreads like these — and note that even professional desks get trades cancelled and re-priced, as today's correction shows.
⚠️ Honest Limits — What the Tape Cannot Prove
- The 13:37:56 Nov-20 $330 put SELL was busted. We are correcting our own earlier read: the trade was cancelled on the tape and re-printed as a BUY at 93% across the NBBO. This changes the November structure from a naked both-tails sale to a defined-risk condor — a correction, not a reinterpretation, and we're stating it plainly rather than quietly editing the numbers.
- The four legs that could not be classified from the trade-day tape are now resolved (Nov-20 $460C and $470C = OPEN; Sep-18 $400C and $425C = CLOSE). See the ✅ RESOLVED box. What the snapshot still cannot show is whose September spread was retired, or whether the closing and the new short spread belong to the same book — the simultaneous print makes that likely, not proven.
- The Jan-2027 $465 call was not observed directly in the original trade capture — it was reconstructed from the OPRA tape, and its SELL direction is an inference from where it printed relative to the bid-ask (≈25% across, below mid), not a confirmed tag from a labeled feed. Treat this leg's direction with more caution than the other fourteen.
- The tape cannot identify the broker, the customer, or whether any of these legs are hedged elsewhere with gold futures, physical bullion, or another instrument entirely invisible to the options tape.
- The tape cannot prove motive — "structured, defined-risk premium-selling program" is the most consistent read of the strikes relative to the market's own implied-move bands and the corrected condor structure, but it is an inference, not a certainty. (The "modest bullish tilt" qualifier we originally attached to it has been removed: open interest showed the long September spread was being closed.)
- Dealer gamma exposure (the support/resistance levels above) is inferred from open interest and a sign assumption about dealer positioning — it is not observed market-maker data, and should be treated as a probabilistic map, not a guarantee.
- The Sep-04 implied-move range quoted above is interpolated between the labeled Aug-21 and Sep-18 tenors, not a direct market print for that exact date — treat it as approximate.
Disclaimer: Options trading involves substantial risk of loss and is not suitable for all investors. This analysis is for educational purposes only and is not financial advice. Even spreads and condors with capped risk can lose their full defined maximum; sizing any of these structures requires understanding that worst case before entering. The positions described here were built by an institutional desk at a scale that does not necessarily match a retail account's risk tolerance or margin capacity. Always do your own research and consider consulting a licensed financial advisor before trading. The open-interest update that resolves the provisional legs has now published; see the ✅ RESOLVED box above.
Last updated: 2026-08-11 (pre-market) — the next-day OPRA open-interest snapshot resolved all four provisional legs. Nov-20 $470C 44,689 → 89,424 and Nov-20 $460C 67,622 → 106,666: both OPEN, past the predicted numbers. Sep-18 $400C 68,341 → 50,379 (−17,962) and Sep-18 $425C 58,412 → 40,384 (−18,028): both CLOSE, in lockstep — inverting the "long $400/$425 call spread" read into a partial unwind of an existing spread. The title, quick take, package descriptions, order-type cells, the self-financing analysis, the motive paragraph, the beginner section and honest-limits were updated; the ⏳ callout was replaced with the ✅ RESOLVED box.