🥇 GLD: The $410 Leg Closed, Not Opened — This Was a Call Position Rolled Up to $415, Not a Fresh Bear Call Spread
2026-08-12 | 🤝 Floor Block | Resolved 2026-08-13: $415 leg opened (+69,650), $410 leg CLOSED (−30,507)
🔄 Updated 2026-08-13 pre-market — the next-day OPRA open interest resolved the $410 leg, and it inverted. Open interest at the $410 strike fell 69,848 → 39,341 (−30,507) — 55% of the 55,292 contracts sold — while the $415 strike rose 26,213 → 95,863 (+69,650), well above its own print. We published both branches and said plainly: "If the $410 line falls hard tomorrow, this was at least partly an unwind of existing exposure layered on top of a genuinely new $415 hedge purchase — not a fresh bear call spread as cleanly as it appears today." That is what happened. The provisional STO label on the $410 leg is retired in favour of STC: no new short was opened there. The structure is better described as a call position rolled up from $410 to $415, not a newly-initiated bear call spread. The title and framing have been updated. See the ✅ RESOLVED box.
🎯 The Quick Take
A desk printed the largest trade on today's board: sold 55,292 GLD September 18 $410 calls and bought 55,292 September 18 $415 calls, both as a single floor block — a negotiated, off-book combination trade, not a lit sweep. That collects ≈$10.78 million in net credit and caps the downside at ≈$16.86 million in maximum risk, a ≈1.6-to-1 risk-reward against the seller. In gold terms, this is a bet that bullion — today testing a 10-week high near $4,450/oz after a +10.46% rally in a month — stalls out roughly where it's trading right now, and doesn't punch through ≈$4,510–4,515/oz by September 18.
🏢 What GLD Actually Is
SPDR Gold Shares is not a company. It has no earnings, no management team, no analyst ratings — it's a passive grantor trust that holds allocated physical gold bullion in London vaults, and its share price is a near-mechanical function of one number: the spot price of gold.
| Attribute | Detail |
|---|---|
| Structure | Physically-backed grantor trust |
| Sponsor | World Gold Trust Services, LLC |
| Trustee | The Bank of New York |
| Custodians | JPMorgan Chase Bank, N.A. and HSBC Bank plc |
| NAV per share | $402.09 (Aug 11 close) |
| Total net assets (AUM) | ≈$144.1B |
| Gross expense ratio | 0.40% |
| 52-week range | $305.19 – $509.70 |
Translating strikes into gold — the part that actually matters here
A $410 strike means nothing on its own. What matters is what it means in the metal. GLD's NAV ÷ gold's spot price implies ≈0.0920 ounces per share (derived from $402.09 NAV against gold's Aug 11 close, not a sponsor-published figure — flagged as such below). Using that ratio:
| GLD level | Implied spot gold | Move from spot |
|---|---|---|
| $406.25 (spot at the print) | ≈$4,420/oz | — |
| $410 — short strike | ≈$4,455–4,460/oz | +0.9% |
| $411.95 — breakeven | ≈$4,477–4,482/oz | +1.4% |
| $415 — long strike / max loss | ≈$4,510–4,515/oz | +2.2% |
That's the headline of this whole article: gold is challenging a 10-week high near $4,450/oz today — roughly one session's range below where this spread starts losing money. "0.9% out of the money" undersells how close that actually is.
💰 The Trade, Plain English
At 10:33:46 ET, a desk sold 55,292 September calls at the $410 strike and simultaneously bought the same size at the $415 strike — a classic bear call spread (also called a call credit spread), printed as one combined 🤝 floor block. Floor blocks are negotiated on the exchange floor between a broker and a known counterparty ahead of time — there's no aggressive order slamming into the lit book here, and no urgency to read into the print.
| Time (ET) | Buy/Sell | Call/Put | Expiration | Strike | Size | Prior OI | Spot | Option Price | Premium | Option Symbol |
|---|---|---|---|---|---|---|---|---|---|---|
| 10:33:46 | SELL | CALL | 2026-09-18 | $410 | 55,292 | 69,848 | $406.25 | $11.63 | $64,304,596 | GLD20260918C410 |
| 10:33:46 | BUY | CALL | 2026-09-18 | $415 | 55,292 | 26,213 | $406.25 | $9.68 | $53,522,656 | GLD20260918C415 |
Net credit collected: ≈$10,781,940 ($1.95/share × 100 × 55,292) | Maximum risk: ≈$16,864,060 ($3.05/share × 100 × 55,292) | Breakeven: $411.95 | Spread width: $5.00
One caveat worth stating up front: this printed as a negotiated block at the mid, meaning it took no liquidity from the open book. The BUY/SELL labels above are what the flow reported, not something proven by an aggressor reading — there's no bid/ask "lift" or "hit" to point to on a pre-arranged trade. What IS proven is the mechanism, the sizes, the prices, and the strike geometry.
✅ RESOLVED — The $410 Leg Closed; the Structure Is a Roll Up, Not a New Spread
Updated 2026-08-13 pre-market. Resolving OPRA snapshot timestamped August 13 (reflects the August 12 close, after this print); baseline is the August 12 snapshot (reflects the August 11 close, before this print).
| Leg | Baseline (Aug-12) | Resolving (Aug-13) | Δ | Print size | What we published | Verdict |
|---|---|---|---|---|---|---|
| Sep-18 $410 call (sold) | 69,848 | 39,341 | −30,507 | 55,292 | "if it was a close continuing the week's decline: the $410 line's OI should fall, potentially sharply" | 🔄 CLOSE (STC) — was STO ⏳; 55% of the print retired |
| Sep-18 $415 call (bought) | 26,213 | 95,863 | +69,650 | 55,292 | "at least ≈29,079 contracts must be brand-new" | ✅ OPEN (BTO) — 126% of size |
This is the largest inversion on the August 12 board. Open interest at $410 did not rise toward the ≈125,000 a fresh short would have produced — it fell by 30,507, extending the multi-session decline the article already flagged (74,503 → 69,848 → 39,341). At the same time $415 open interest rose by 69,650 against a 55,292-lot print, meaning the new strike absorbed the block plus ≈14,358 contracts of additional buying.
What the structure actually is. Selling out an existing $410 call line while opening a larger $415 call line, same expiration, is a strike roll up. The desk did not initiate a fresh short-call obligation and did not collect a net credit for taking on new upside risk at $410. Retire the "bets gold stalls at its 200-day" framing built on a newly-opened short: the short side was an existing position being retired, and the genuinely new money went into long $415 calls.
Magnitude is decisive on direction, partial on size. 55% of the $410 print extinguished open interest; the remaining ≈24,785 transferred between holders. So we can say with confidence that no net new short was created at $410 — we cannot say every one of the 55,292 contracts was a close.
Control check. The move is strike-specific, not a chain-wide gold event: September $400C 49,477 → 48,843 (−634), $405C 5,089 → 5,187 (+98), $420C 129,760 → 134,232 (+4,472), $425C 41,327 → 40,591 (−736). Nothing in the neighbouring strikes resembles the −30,507 at $410.
🔄 Retraction notice (2026-08-13): the bear-call-spread walkthrough below was written while the $410 leg was unresolved. Next-day open interest proved that leg closed (69,848 → 39,341), so no new short was opened and no net credit was collected for taking on fresh upside risk. Read the mechanics below as general background; the operative read is a call position rolled up from $410 to $415. See the ✅ RESOLVED box above.
🤓 What This Actually Means — Plain English
A bear call spread is a way to collect cash today in exchange for capping how much gold GLD can rally before it costs you money. Here's the mechanics from first principles:
- You sell the $410 call (collect $11.63/share) and you buy the $415 call (pay $9.68/share) — same expiration, same underlying, five dollars apart. Net: you pocket the $1.95/share difference up front, in this case $10.78 million.
- If GLD closes at or below $410 on September 18, both calls expire worthless. The seller keeps the entire $10.78M credit — that's the best case.
- If GLD closes between $410 and $411.95, the short call starts costing money, but the credit collected still cushions the loss.
- If GLD closes at or above $415, both calls are deep in the money and the spread's width ($5.00) is the maximum possible loss per share — offset by the credit already collected, netting out to the ≈$16.86 million maximum risk. That number can't get any worse than that no matter how high gold goes, because the long $415 call caps it — that's the entire point of buying the higher strike rather than selling the $410 call naked.
- Why the max risk (≈$16.86M) is ≈1.6× the credit (≈$10.78M): the $5.00-wide spread minus the $1.95 credit leaves $3.05 of risk per share against $1.95 of reward per share. That ratio (≈1.56:1) means the position needs to be right roughly 61% of the time just to break even over repeated occurrences of this structure — a real, quantifiable hurdle, not a coin flip.
This is a short-volatility, defined-risk position — the seller is being paid to bet that gold's rally has largely run its course between now and September 18, not that it collapses.
📈 Technical Setup
YTD Chart
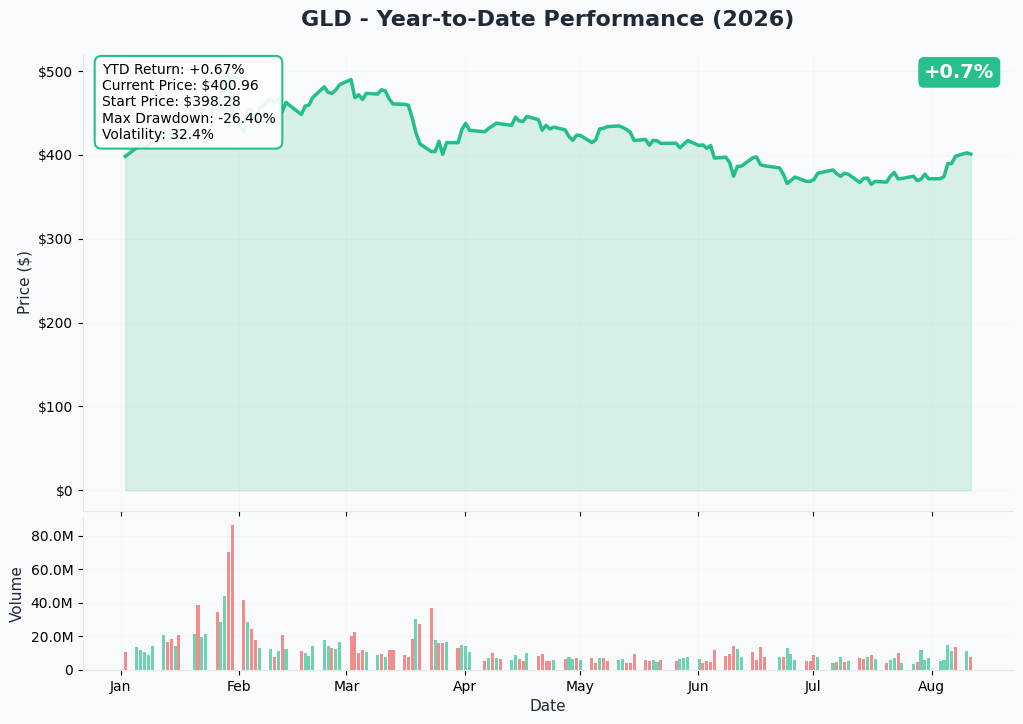
GLD set an all-time-high-adjacent peak earlier in the year before a sharp correction, and has spent the past month clawing much of it back — a +10.46% one-month move in the underlying metal that has NAV still −6.75% year-to-date even after the bounce. That's the shape behind today's trade: a fund rallying hard off a multi-month low, not drifting sideways.
Gamma-Based Support & Resistance
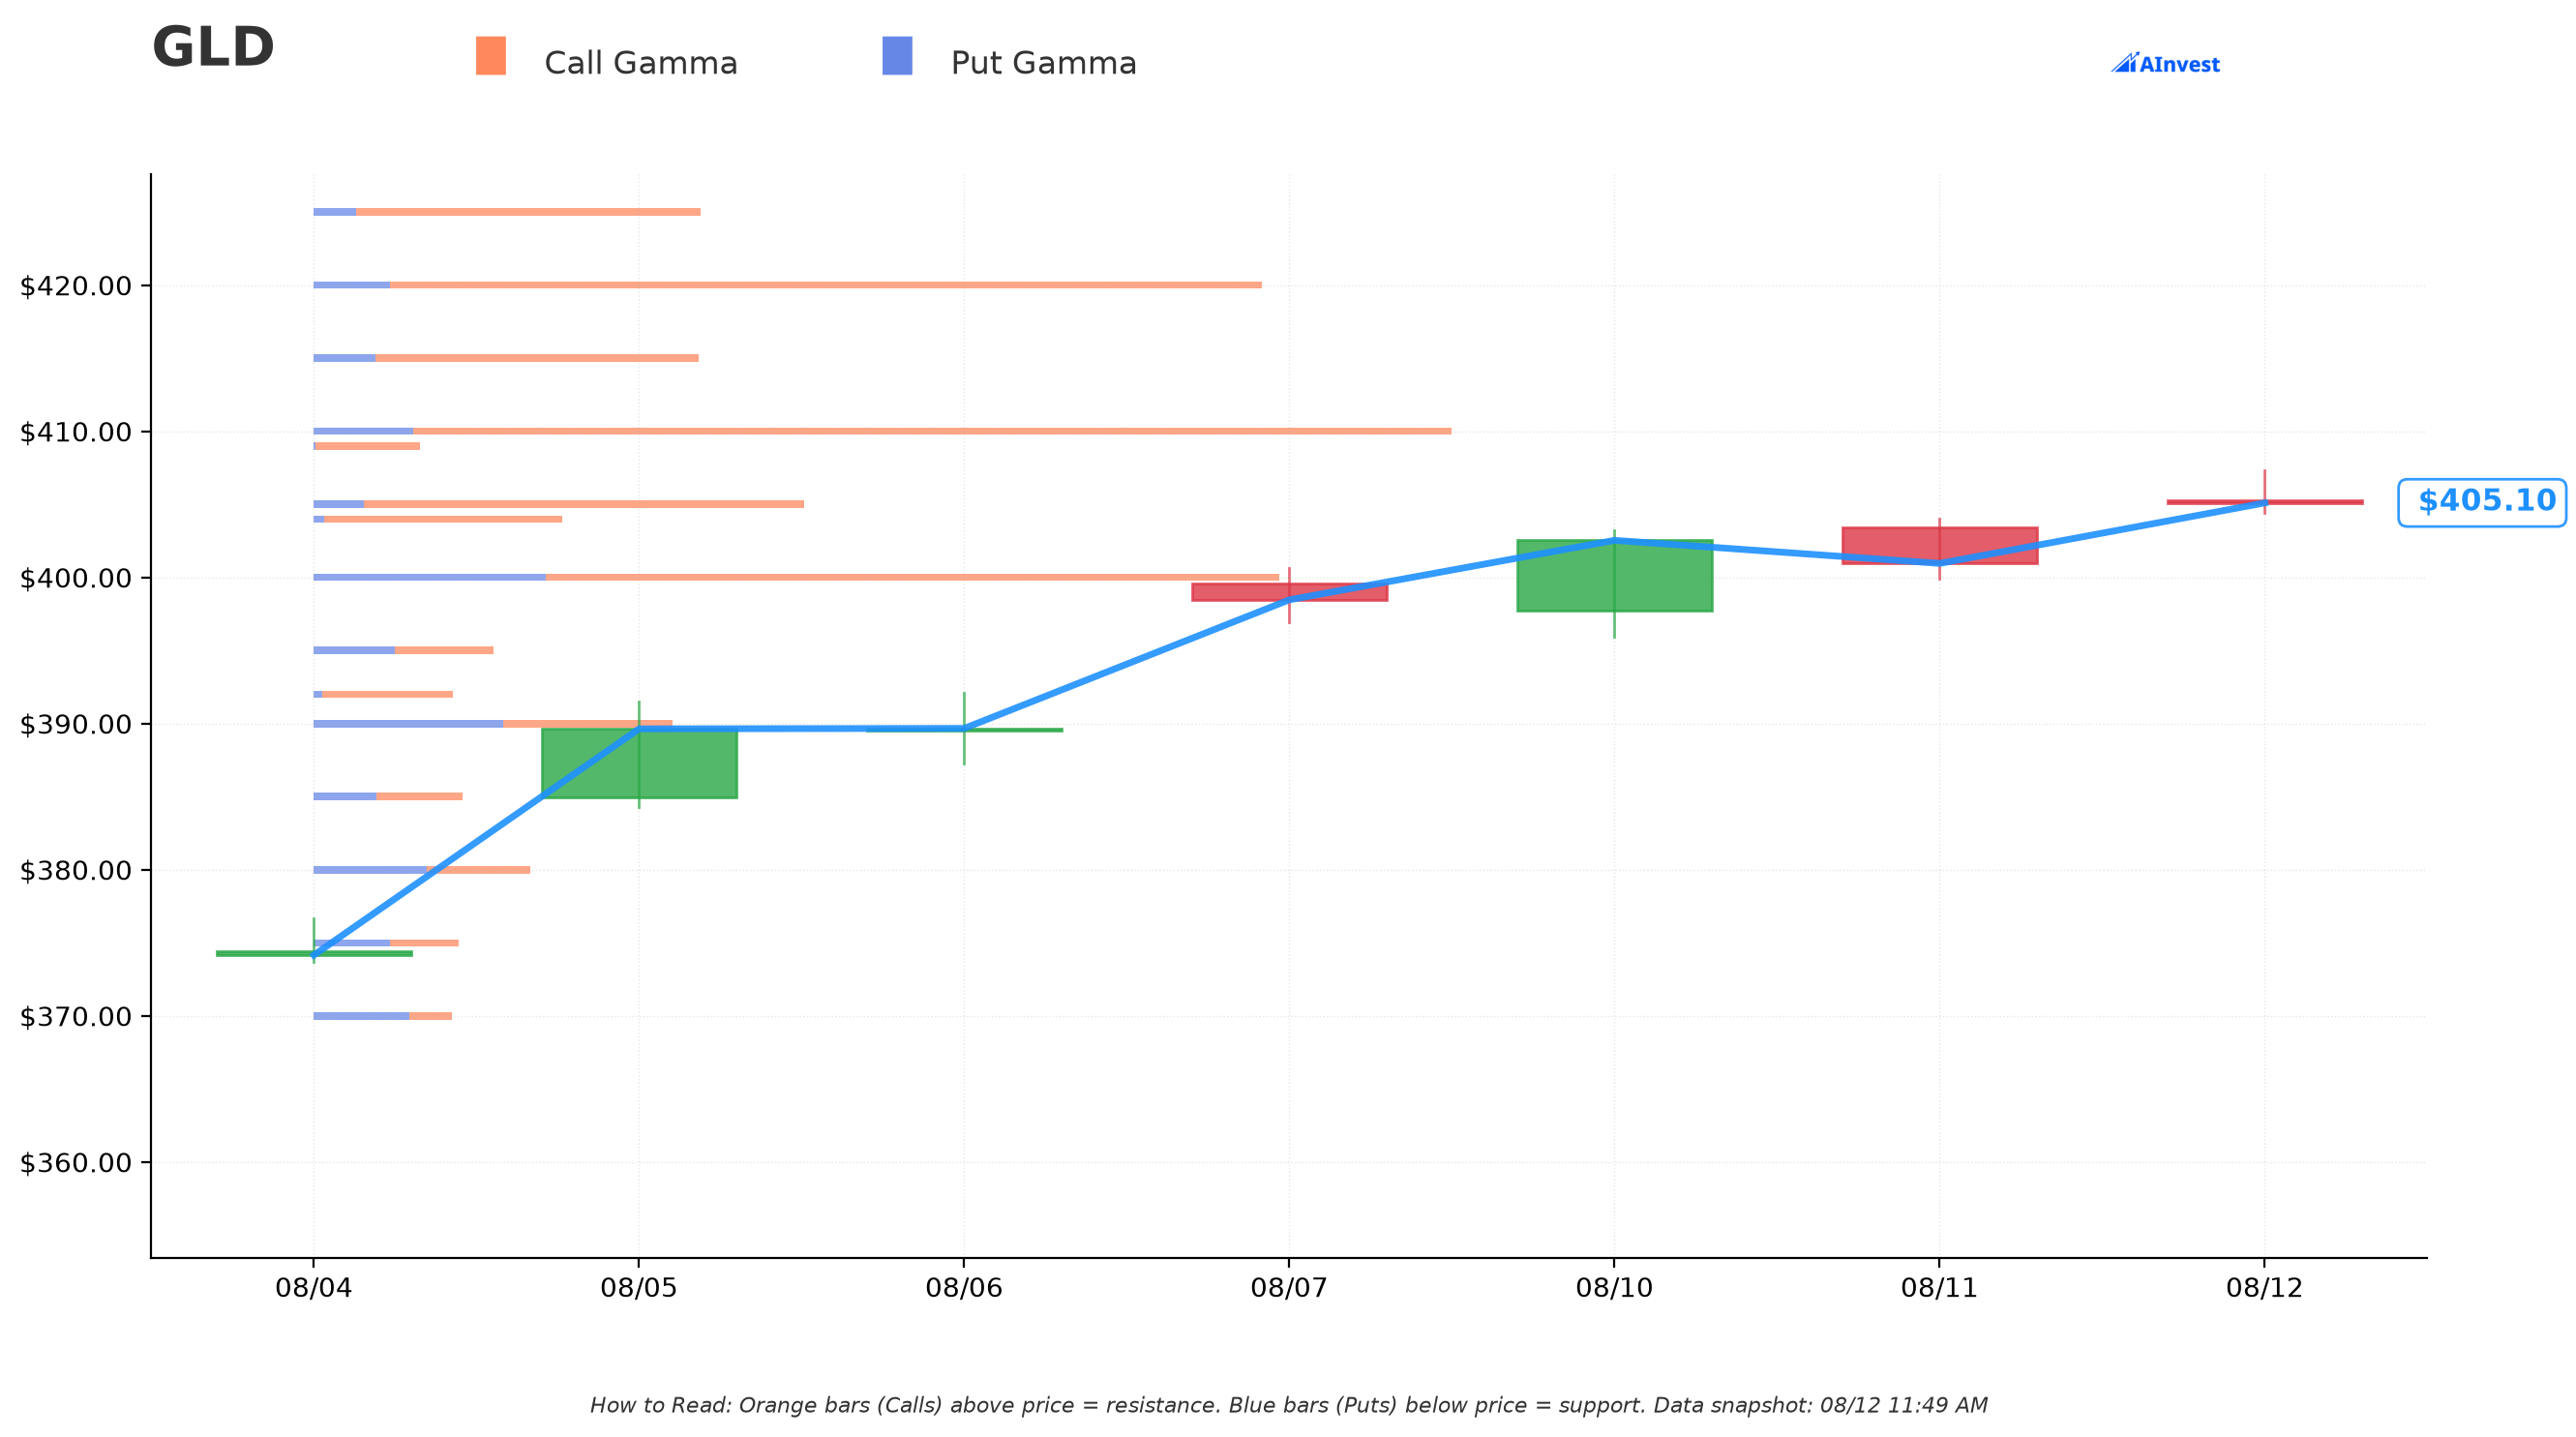
With spot at $405.02, the current gamma map shows:
- Resistance: $410 (Very Strong) — and this is the single most useful chart-level fact in this whole trade. The desk sold its short call at exactly the strike where dealer gamma resistance is strongest. That's not a coincidence a retail trader can casually replicate; it means the level being sold is also the level the options market itself has already flagged as the hardest ceiling to punch through on a straight run higher. The $415 long strike sits on its own (smaller) resistance wall roughly 2.5% above spot.
- Support: $400 (Very Strong) — the nearest major floor below spot, reinforcing that dealer positioning currently expects GLD to oscillate in the $400–$410 band before any bigger move.
Implied Move
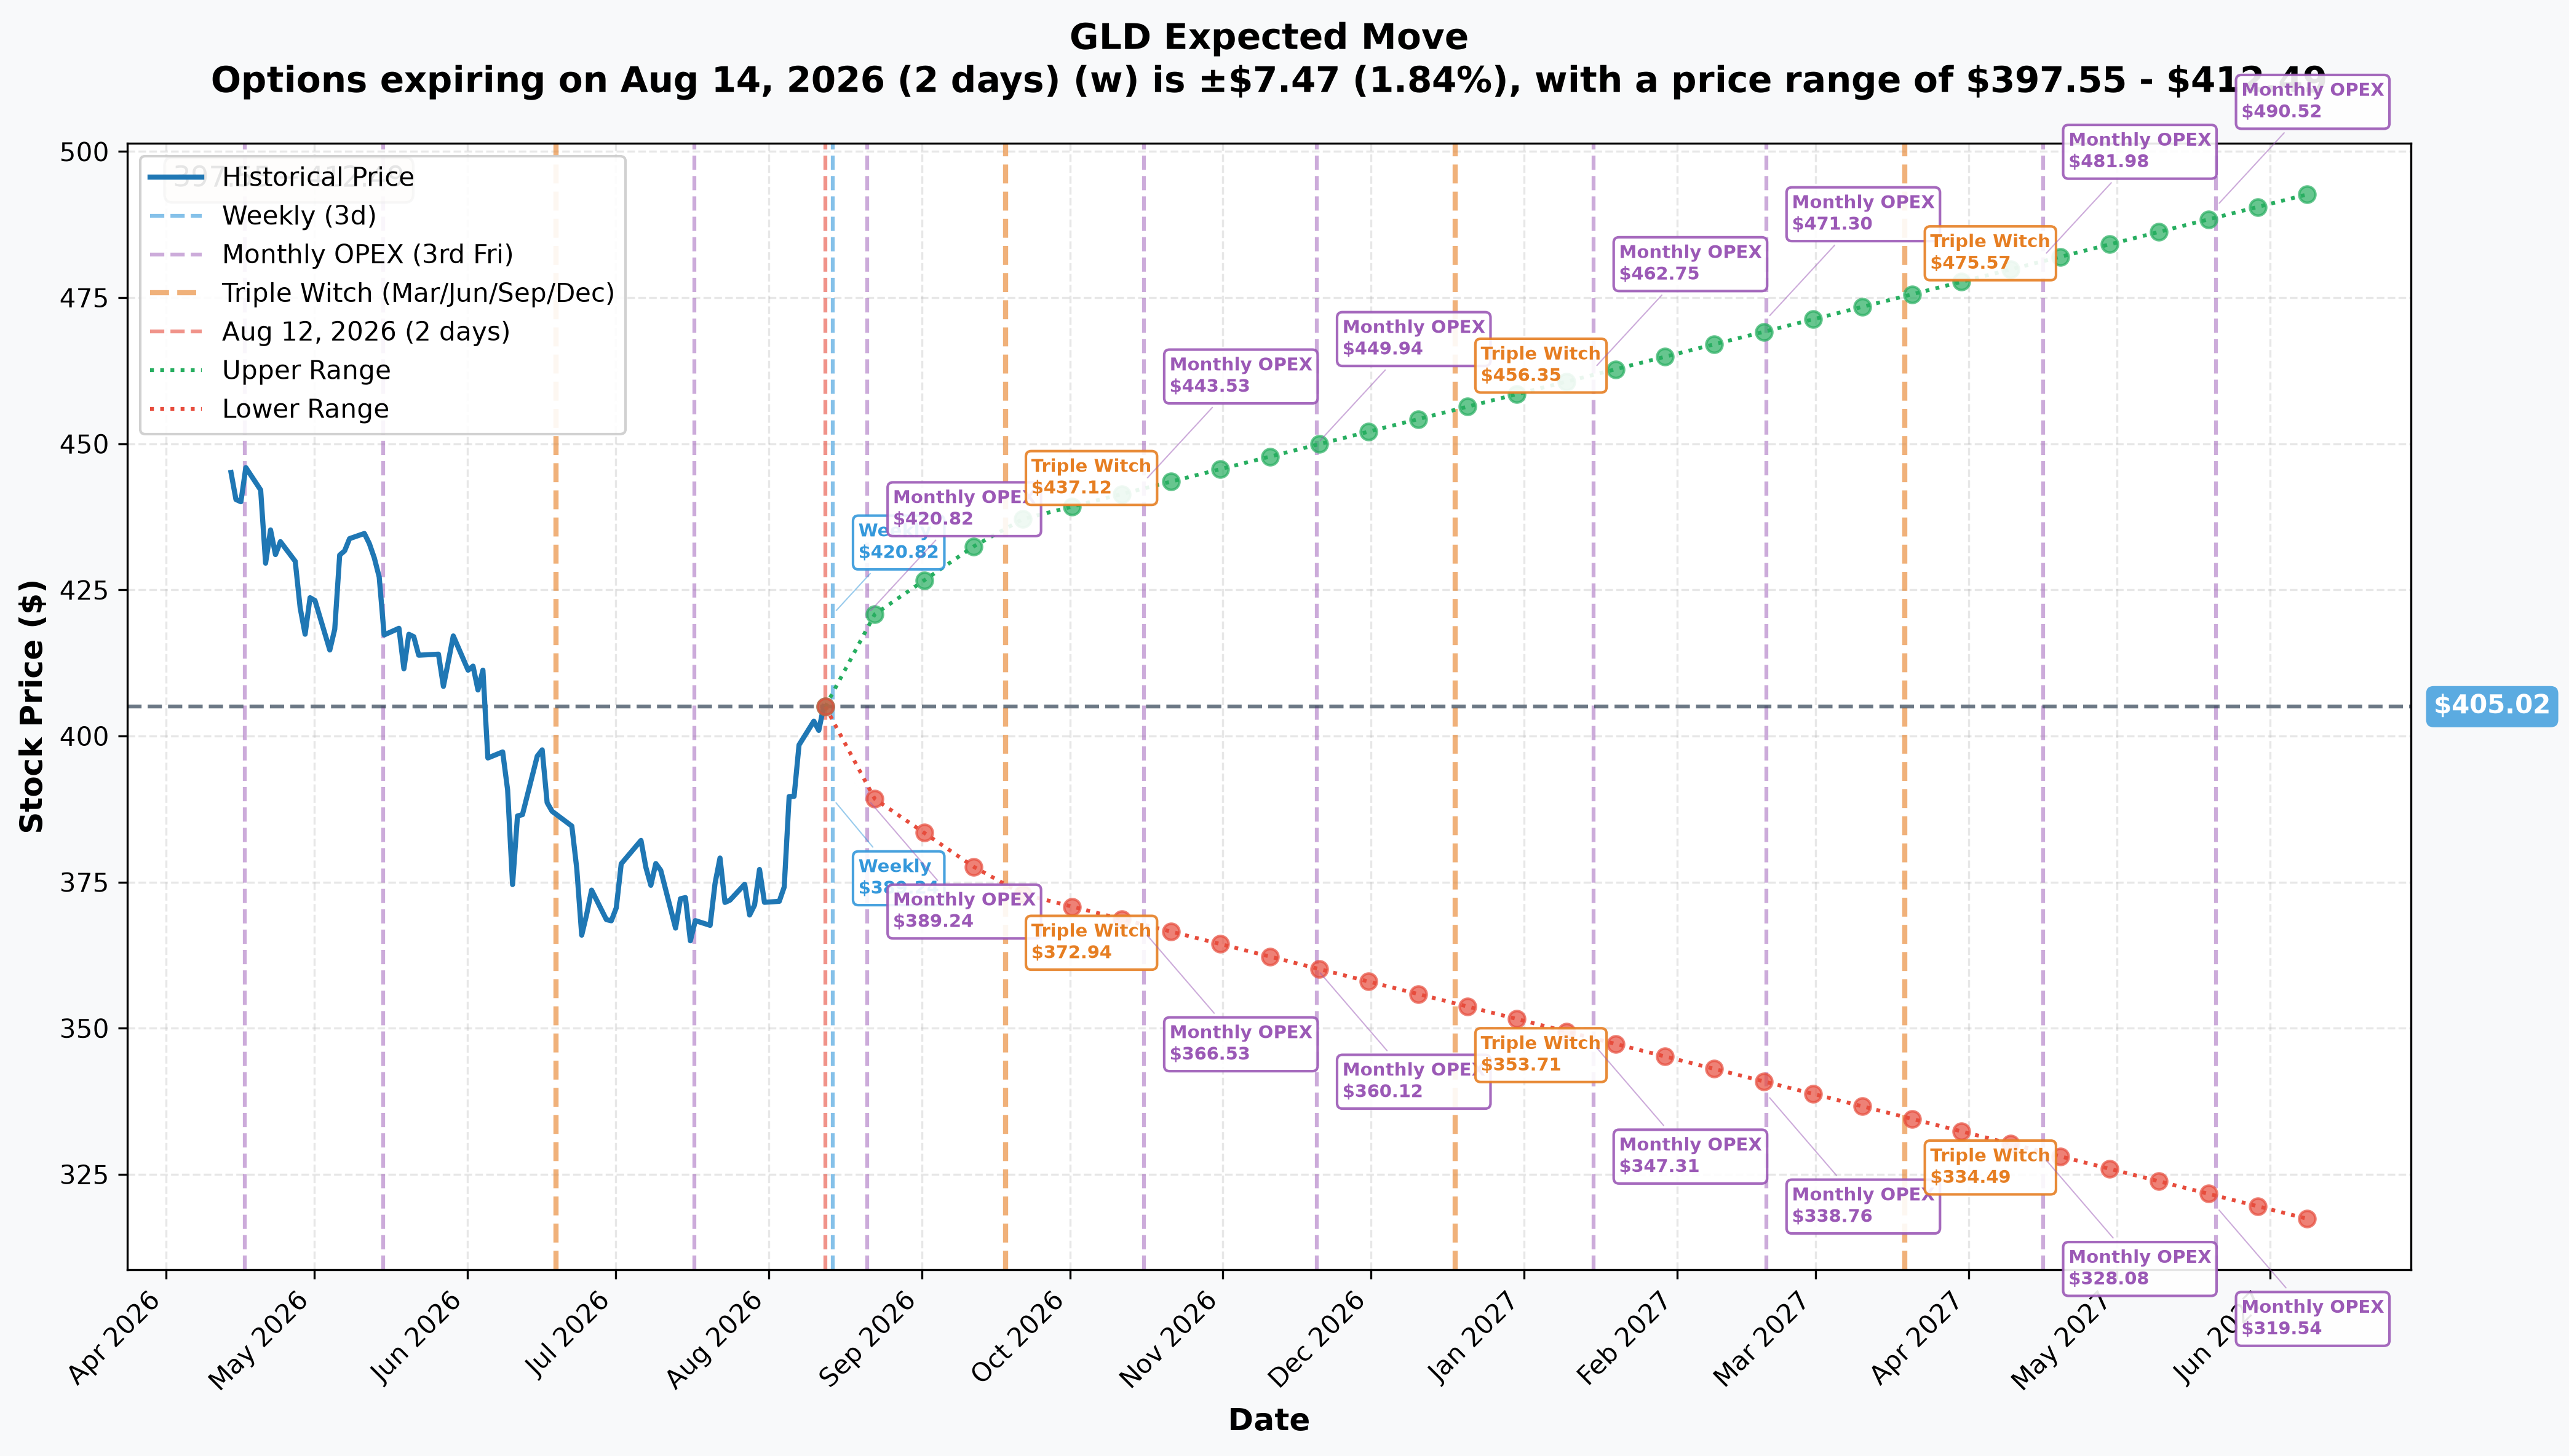
Straight from the options market's own pricing:
| Window | Expiry | Implied move | Range |
|---|---|---|---|
| Weekly | 2026-08-14 | ±1.84% | $397.55 – $412.49 |
| Monthly OPEX | 2026-08-21 | ±3.76% | $389.82 – $420.24 |
| Quarterly / triple witch (this trade's expiry) | 2026-09-18 | ±7.76% | $373.58 – $436.48 |
That September range is the tell: the options market's own pricing extends well above $415 on the upside ($436.48 vs. the $415 max-loss strike). The market is not treating a move past $415 as a fantasy scenario — it's pricing real probability mass above the point where this spread starts taking its full loss. That doesn't make the trade wrong, but it does mean the seller is fading a real portion of the market's own distribution, not a tail event.
🎪 Catalysts
Catalyst dates below are separate from the trade's expiration, which is September 18, 2026.
The macro backdrop — read this carefully, it will surprise you
This is not an easing cycle. The Fed funds target sits at 3.50%–3.75%, held at the July 28–29 meeting — but three FOMC members dissented in favor of a hike, a 9-3 vote read by commentators as Chair Warsh's de facto forward guidance toward tightening, not easing. Markets had been pricing ≈77% odds of a September rate increase — treat that specific number as an upper bound, since today's softer CPI print explicitly lowered September hike expectations, and the exact current probability could not be independently confirmed at a single timestamp.
A rate hike is this desk's winning path. Higher real yields are historically gold-negative, and a September 16 hike would likely hand the seller the full $10.78M credit.
Inside the 37-day window (August 12 → September 18)
The calendar mapping IS the analysis for a trade this length. Only three tier-one events fall inside the window, and they are not evenly spread:
| Date | Event | Note |
|---|---|---|
| Aug 13 | PPI (July) | Second-order |
| Aug 14 | Retail Sales (July) | Second-order |
| Aug 19 | FOMC Minutes (Jul 28-29) | Detail on the three hike dissents |
| Aug 26 | PCE Price Index (July) | Fed's preferred gauge, July reading only |
| Aug 27–28 | Jackson Hole Symposium | Historic venue for policy pivots |
| Sep 4 | Nonfarm Payrolls (August) | Only payrolls print in the window |
| Sep 11 | CPI (August) | Only CPI print in the window |
| Sep 15–16 | FOMC decision + dot plot | Two days before expiry |
| Sep 18 | OPTION EXPIRATION | Quarterly triple-witching |
The first ≈3.5 weeks are nearly empty of scheduled event risk. Then all three tier-one events — payrolls, CPI, and the FOMC decision — compress into the final two weeks, with the Fed landing 48 hours before expiration and effectively zero time to recover from a gap. Theta decays cheaply for most of the trade's life and then the position absorbs the entire event calendar at once, right when gamma risk is highest. Notably, August PCE (≈Sep 25) and the October FOMC land just outside the window — the trade is exposed to exactly one Fed decision.
The main threat to the trade
July payrolls printed −23,000, against forecasts of +80K, with 103,000 of downward revisions to prior months — a genuinely weak labor market. A second negative print on September 4 would kill the rate-hike thesis outright and is the cleanest, fastest route to the ≈$16.86M loss, landing 12 days before expiry with time for the move to compound into the CPI and FOMC that follow.
The sharpest read in this trade — the 200-day moving average
Gold's 200-day simple moving average sits at ≈$4,500/oz — and that level lands between the breakeven (≈$4,480/oz) and the max-loss strike (≈$4,510–4,515/oz). That's a genuinely elegant piece of strike selection: the position's "disaster zone" begins almost exactly where the market's most-watched long-term resistance line sits. Read charitably, this desk isn't betting gold falls — it's betting gold stalls right at its 200-day average, arguably the single most defensible short-term technical thesis available for a structure like this. The uncomfortable counterpoint: momentum indicators currently read "Strong Buy" across intraday timeframes with 9 buy / 0 sell signals and an ADX near 37, meaning the up-move testing that ceiling has real trend behind it, not noise.
Why gold has moved at all
Cooling July CPI (3.4% YoY, core 2.5%, the smallest annual increase since February) took some edge off rate-hike fear, alongside a softer dollar (DXY 99.869, -1.35% over the month) and 21 consecutive months of Chinese central-bank gold buying. Notably, the 10-year TIPS real yield sits at 2.39% — textbook models say that level should be crushing a non-yielding asset like gold, yet gold is +31.70% year over year anyway. That decoupling is precisely why selling gold calls has been a dangerous trade for the past year: anyone short gold volatility is implicitly betting the old rate-sensitivity model reasserts itself in the next five weeks.
👥 How Different Readers Should Think About This
🎲 The YOLO trader
There's nothing here for you directly — this is a defined-risk, credit-collecting institutional structure, not a lottery ticket. If you want convex exposure to the same thesis (gold stalling at $4,500), the more YOLO-shaped version would be buying a single $415 or $420 call outright for a small, capped-loss bet on gold not stalling — the mirror image of what this desk did. Trying to replicate a 55,292-lot spread with retail-sized capital just means eating the same 1.6-to-1 risk skew without the scale to make the credit meaningful.
📈 The swing trader
The structural level to watch on your chart is the $410–$415 GLD band (≈$4,455–4,515/oz gold) — it's now both a heavy gamma resistance zone and the boundary of a large institutional credit spread. If gold grinds sideways into September, that's this trade working as designed; if gold breaks and holds above ≈$4,460/oz with September 4 payrolls still ahead, that's your signal the thesis is under real pressure, well before expiration confirms it either way.
💰 The premium collector
This is the trade for you to study, not necessarily copy at this size. The mechanics are exactly what a retail premium collector would recognize — sell the near strike, buy the far strike, collect the difference, cap the risk. What's instructive is the risk-reward: ≈$16.86M at risk to make ≈$10.78M is a ≈1.56:1 ratio requiring roughly 61% win-rate just to break even, on an asset that just moved 10.5% in a single month. If you're running smaller-scale gold credit spreads, the lesson is sizing discipline: a magnitude mismatch this severe (max loss on a mere +2.2% move, against a metal capable of +10% monthly swings) means position size has to assume the loss branch is a live outcome, not a tail case you can ignore. The thin-then-thick catalyst calendar (quiet for 3.5 weeks, then payrolls/CPI/FOMC crammed into the final two weeks) is also a pattern worth internalizing for your own credit-spread timing — theta collects cheaply early and gets tested hard late.
🌱 The beginner
Think of this like a landlord who sells you the right to buy their house at $410,000 anytime before September 18, while simultaneously buying insurance that caps their own downside if the house's value keeps climbing past $415,000. They collect $1.95 per "share" of that deal today — real cash, no strings attached, as long as the house (gold, through GLD) doesn't rise past $410. If it rises further, they still lose money, but never more than the $5 gap between the two prices they locked in, minus what they already collected. That's the entire trick of a "credit spread": collect money now, define exactly how bad the worst case can be, and let time decide the rest. It is a bet that things stay roughly where they are — not a bet that gold crashes.
⚠️ Honest Limits — What the Tape Cannot Prove
- We cannot prove the $410 leg opened or closed. Size (55,292) sits below prior open interest (69,848), which had already been declining. Only tomorrow's ≈06:30 ET OPRA open-interest snapshot resolves this — see the ⏳ callout above.
- We cannot prove the BUY/SELL direction from the tape's geometry. This printed as a negotiated floor block that took no liquidity — there's no bid/ask aggression to read, so the labels reflect the reported flow, not a tape-proven aggressor side.
- We cannot see the counterparty, the broker, or the true intent. A floor block means a known counterparty took the other side by prior arrangement; the tape shows the print, not the motive behind it.
- GLD-specific dollar fund flows were not retrievable for this research and are a genuine data gap — only AUM and fee levels could be sourced.
- The sponsor's own ounces-per-share and tonnage figures were unavailable ("AWAITING" on the sponsor's live tables) — the ≈0.0920 oz/share ratio used to translate strikes into gold prices throughout this article is derived from NAV and spot gold, cross-checked but not sponsor-confirmed.
- AUM disagreement across sources: the sponsor's $144.1B reconciles arithmetically against shares outstanding and NAV and is used here, but third-party aggregators show materially lower figures (≈$130–132B).
- The ≈77% September hike-odds figure likely predates today's CPI release and should be treated as an upper bound that has since come down — the exact current probability could not be confirmed at a single consistent timestamp.
- Jackson Hole's August 27–28 dates come from a secondary source, as does the CPI/payrolls economic calendar; only the FOMC dates are confirmed directly from the Federal Reserve.
- Strike-to-gold translations use spot gold (≈$4,420), not futures (≈$4,477) — applying futures pricing instead would shift every implied level in this article by roughly 1.3%.
Options trading involves substantial risk of loss and may not be suitable for all investors. Nothing in this article is investment advice — verify all figures independently and size any position, hedge or speculation, to what you can afford to lose.
Last updated: 2026-08-13 (pre-market) — the next-day OPRA open-interest snapshot resolved the $410 leg and it inverted. Sep-18 $410C 69,848 → 39,341 (−30,507 against 55,292 sold, 55% of the print retired): CLOSE (STC), was STO ⏳; $415C 26,213 → 95,863 (+69,650 against 55,292, 126% of size): OPEN (BTO). The title, the header line, the order-type and strategy cells and the bear-call-spread framing were updated to a call roll up from $410 to $415; the ⏳ callout was replaced with the ✅ RESOLVED box.