🔬 GLW $48M in Two Trades — But Neither One Is a Bet on Direction
📅 2026-07-29 | 🔥 Unusual Activity Detected
✅ Updated July 30, 2026 — both reads confirmed, and the closing call was right to the contract. The Sep-2026 $115 call opened cleanly (219 → 15,286, +15,067). The Jan-2028 $310 put's open interest collapsed to 80 (1,000 → 80, −920) — we predicted "should fall toward ≈76-100," so the buy-to-close read is confirmed almost exactly. Neither trade was directional, and now neither is provisional. Detail in the ✅ RESOLVED box below.
🎯 The Quick Take
Corning (GLW) printed two chunky option trades today, one day after its stock crashed ≈16-18% on Q2 earnings — its worst single day since 2002. The headline numbers are big (≈$31M and ≈$17M) but neither trade is a straightforward directional bet. The first is a delta-hedged long-convexity structure — a call bought against a matching short-stock block, engineered to be direction-neutral. The second looks like a prior position being closed/unwound, not a fresh bearish stake. Translation: this is positioning and financing activity, not smart money picking a side. 🧐
📊 Company Overview
Corning Incorporated (GLW) is a specialty-glass, ceramics and optical-physics materials company built around three segments:
- Optical Communications — fiber, cable and high-density connectivity for telecom carriers and, increasingly, AI hyperscale data centers. This is the growth engine.
- Glass Innovations — display glass for TVs/monitors/laptops, merged with Specialty Materials, home of Gorilla Glass used on Apple and Samsung phones.
- Solar — Hemlock Semiconductor's ultra-pure polysilicon plus U.S. solar-wafer/module capacity.
Market Cap: ≈$107B at ≈$124/share (down from ≈$126B before the earnings drop). 52-Week Range: $54.89 – $271.78 — GLW is still up well over 100% over the trailing year even after this week's plunge.
💰 The Option Flow Breakdown
📊 What Just Happened — The Tape
| Time | Symbol | Buy/Sell | Type | Expiration | Premium | Strike | Volume | OI | Size | Spot | Option Price | Option Symbol |
|---|---|---|---|---|---|---|---|---|---|---|---|---|
| 12:15:37 | GLW | BUY | CALL | 2026-09-18 | $31M | $115 | 15,000 | 219 | 15,000 | $124.40 | $20.80 | GLW20260918C115 |
| 10:18:54 | GLW | BUY | PUT | 2028-01-21 | $17M | $310 | 924 | 1,000 | 924 | $127.87 | $189.10 | GLW20280121P310 |
Trade 1 — 🤝 Block Cross, delta-hedged. The 15,000-lot Sep-18 $115 calls printed as a single-leg block cross — a broker matched a known buyer and seller off the lit book, not a chase-the-offer sweep. At the same time, a ≈1,000,000-share Corning stock block printed at $124.58. Do the math: 15,000 contracts × 100 shares × ≈0.67 delta (this call is moderately in-the-money) ≈ 1.005 million shares — a ≈100% match to the equity block. That means this is long calls hedged with short stock, engineered to be flat on direction from minute one.
Trade 2 — stock+option combo, closing. The 924-lot Jan-2028 $310 puts printed together with an equity leg (a pre-hedged, "stock+option combo" package) — a financing-style structure, not a standalone directional put buy. The put is deep in the money (strike $310 vs. spot $127.87 ⇒ ≈$182 of intrinsic value baked into the $189.10 price — ≈96% of the premium is pure intrinsic, a classic sign of a financing trade rather than a speculative bet). Our archive shows a prior sale (STO) of 1,000 of these exact $310 puts — today's buy looks like it's closing/unwinding that earlier position.
✅ RESOLVED — Both Legs Settled, One of Them to the Contract (July 30, 2026, ≈06:30 ET)
The OPRA snapshot timestamped 2026-07-30 (reflecting the EOD July 29 close) resolves both trades — and confirms both published reads:
| Leg | Baseline OI (Jul 29 snap) | Resolving OI (Jul 30 snap) | Δ | Print size | Strike day-vol | Predicted | Verdict |
|---|---|---|---|---|---|---|---|
| Sep-18-2026 $115 C | 219 | 15,286 | +15,067 | 15,000 | 15,152 | ≈15,000 new | ✅ OPEN (BTO) — confirmed |
| Jan-21-2028 $310 P | 1,000 | 80 | −920 | 924 | 1,000 | fall to ≈76-100 | ✅ CLOSE (BTC) — confirmed, bullseye |
The $115 call — a clean, complete fresh open.
- ΔOI is ≈100.4% of the 15,000-lot block cross, and ≈99% of the strike's entire session volume (15,152). The strike went from 219 contracts to 15,286 — a ≈70-fold build with essentially no transfer component.
- Combined with the matching stock hedge, the delta-hedged convexity structure is confirmed as brand-new. It was never a directional bet, and it is now proven not to be a transfer or an unwind either.
The $310 put — the archive override beat the classifier, exactly as we said it would.
- Open interest collapsed 1,000 → 80, retiring ≈99.6% of the strike. Our published prediction was "should fall toward ≈76-100 contracts (1,000 − 924)." It landed on 80.
- Why this is decisive: open interest falls only when contracts are retired. A buy that destroys open interest is a buy to close, which means the buyer was short these puts. The classifier's default BTO label was wrong; the archive record of a prior 1,000-lot sale at this exact strike (HIGH confidence) was right.
- The strike is now effectively taken to zero — a deep-ITM short-put obligation ≈18 months out has been extinguished, not established. This is an unwind, not a bet, and the ≈$17M paid was the cost of exiting an obligation rather than capital placed at risk on a view.
- The print was a stock-plus-options auction (cond 135, 2 prints totalling 1,000 contracts), i.e. pre-hedged and packaged with an equity leg — consistent with a whole structure coming off rather than a naked option trade.
Tape re-verified: no cancellation codes (the 40-44 family) on either strike. Attribution is clean on both.
Bottom line: neither trade was directional, and both provisional flags are now retired. One position was created (hedged call convexity); one was extinguished (a short put).
🤓 What This Actually Means — Plain English
Trade 1 is not "someone is buying the dip." A trader who wants to bet GLW bounces just buys calls. This trader bought calls and sold roughly a million shares of stock at the same time — the stock leg cancels out almost all of the call's directional exposure. What's left is a bet on movement itself (a "long-convexity" or volatility structure): if GLW whips around hard in either direction over the next ≈7 weeks, this position can profit from the swing and the ongoing re-hedging, regardless of which way the stock ultimately goes. It's the options-trading equivalent of buying a lottery ticket on chaos, not a ticket on "up." Given GLW's actual convexity (options move a lot for a given stock move on a name that just dropped 16-18% in a day), that's a reasonable structure to run right now — but it tells you nothing about whether the desk thinks Corning goes up or down.
Trade 2 looks like someone closing out an old trade, not opening a new bearish one. Deep in-the-money puts priced almost entirely at intrinsic value, paired with a stock leg, are the fingerprint of a conversion/reversal financing package being unwound — think of it as someone paying off part of a complicated, multi-piece position they set up a while ago, rather than placing a fresh wager that GLW crashes further. Our records show this same investor (or at least this same strike) sold these exact puts earlier; buying them back today reads as closing that chapter, not opening a new bearish one. A big premium number here ($17M) is not a vote of no confidence in Corning — it's mostly just the deep intrinsic value changing hands as the position gets unwound.
Bottom line on both: big dollar figures, low directional signal. Institutional order flow isn't always a crystal ball — sometimes it's plumbing.
📈 Technical Setup / Chart Check-Up
YTD Performance Chart
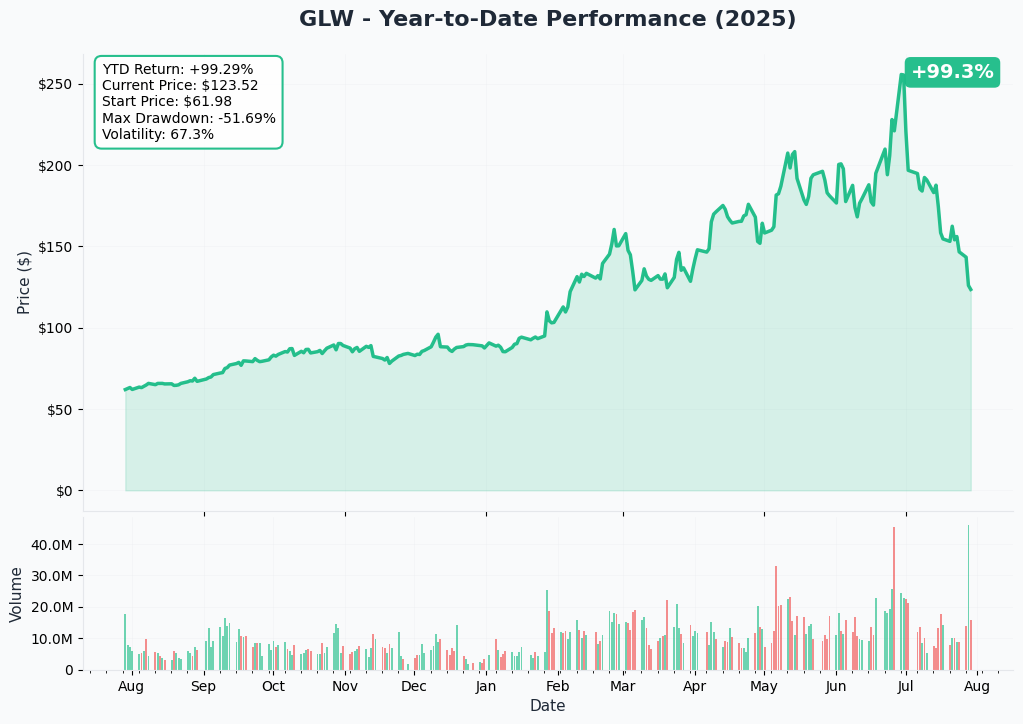
GLW spent most of 2026 grinding higher on the AI-optical story before Tuesday's earnings-day cliff dive knocked it from ≈$146.65 (7/24 close) to ≈$122.92 (7/28 close) — a ≈16-18% single-day drop, the worst since 2002. Today's spot (≈$124.40) is trying to stabilize just above those post-earnings lows.
🎯 Gamma-Based Support & Resistance Analysis
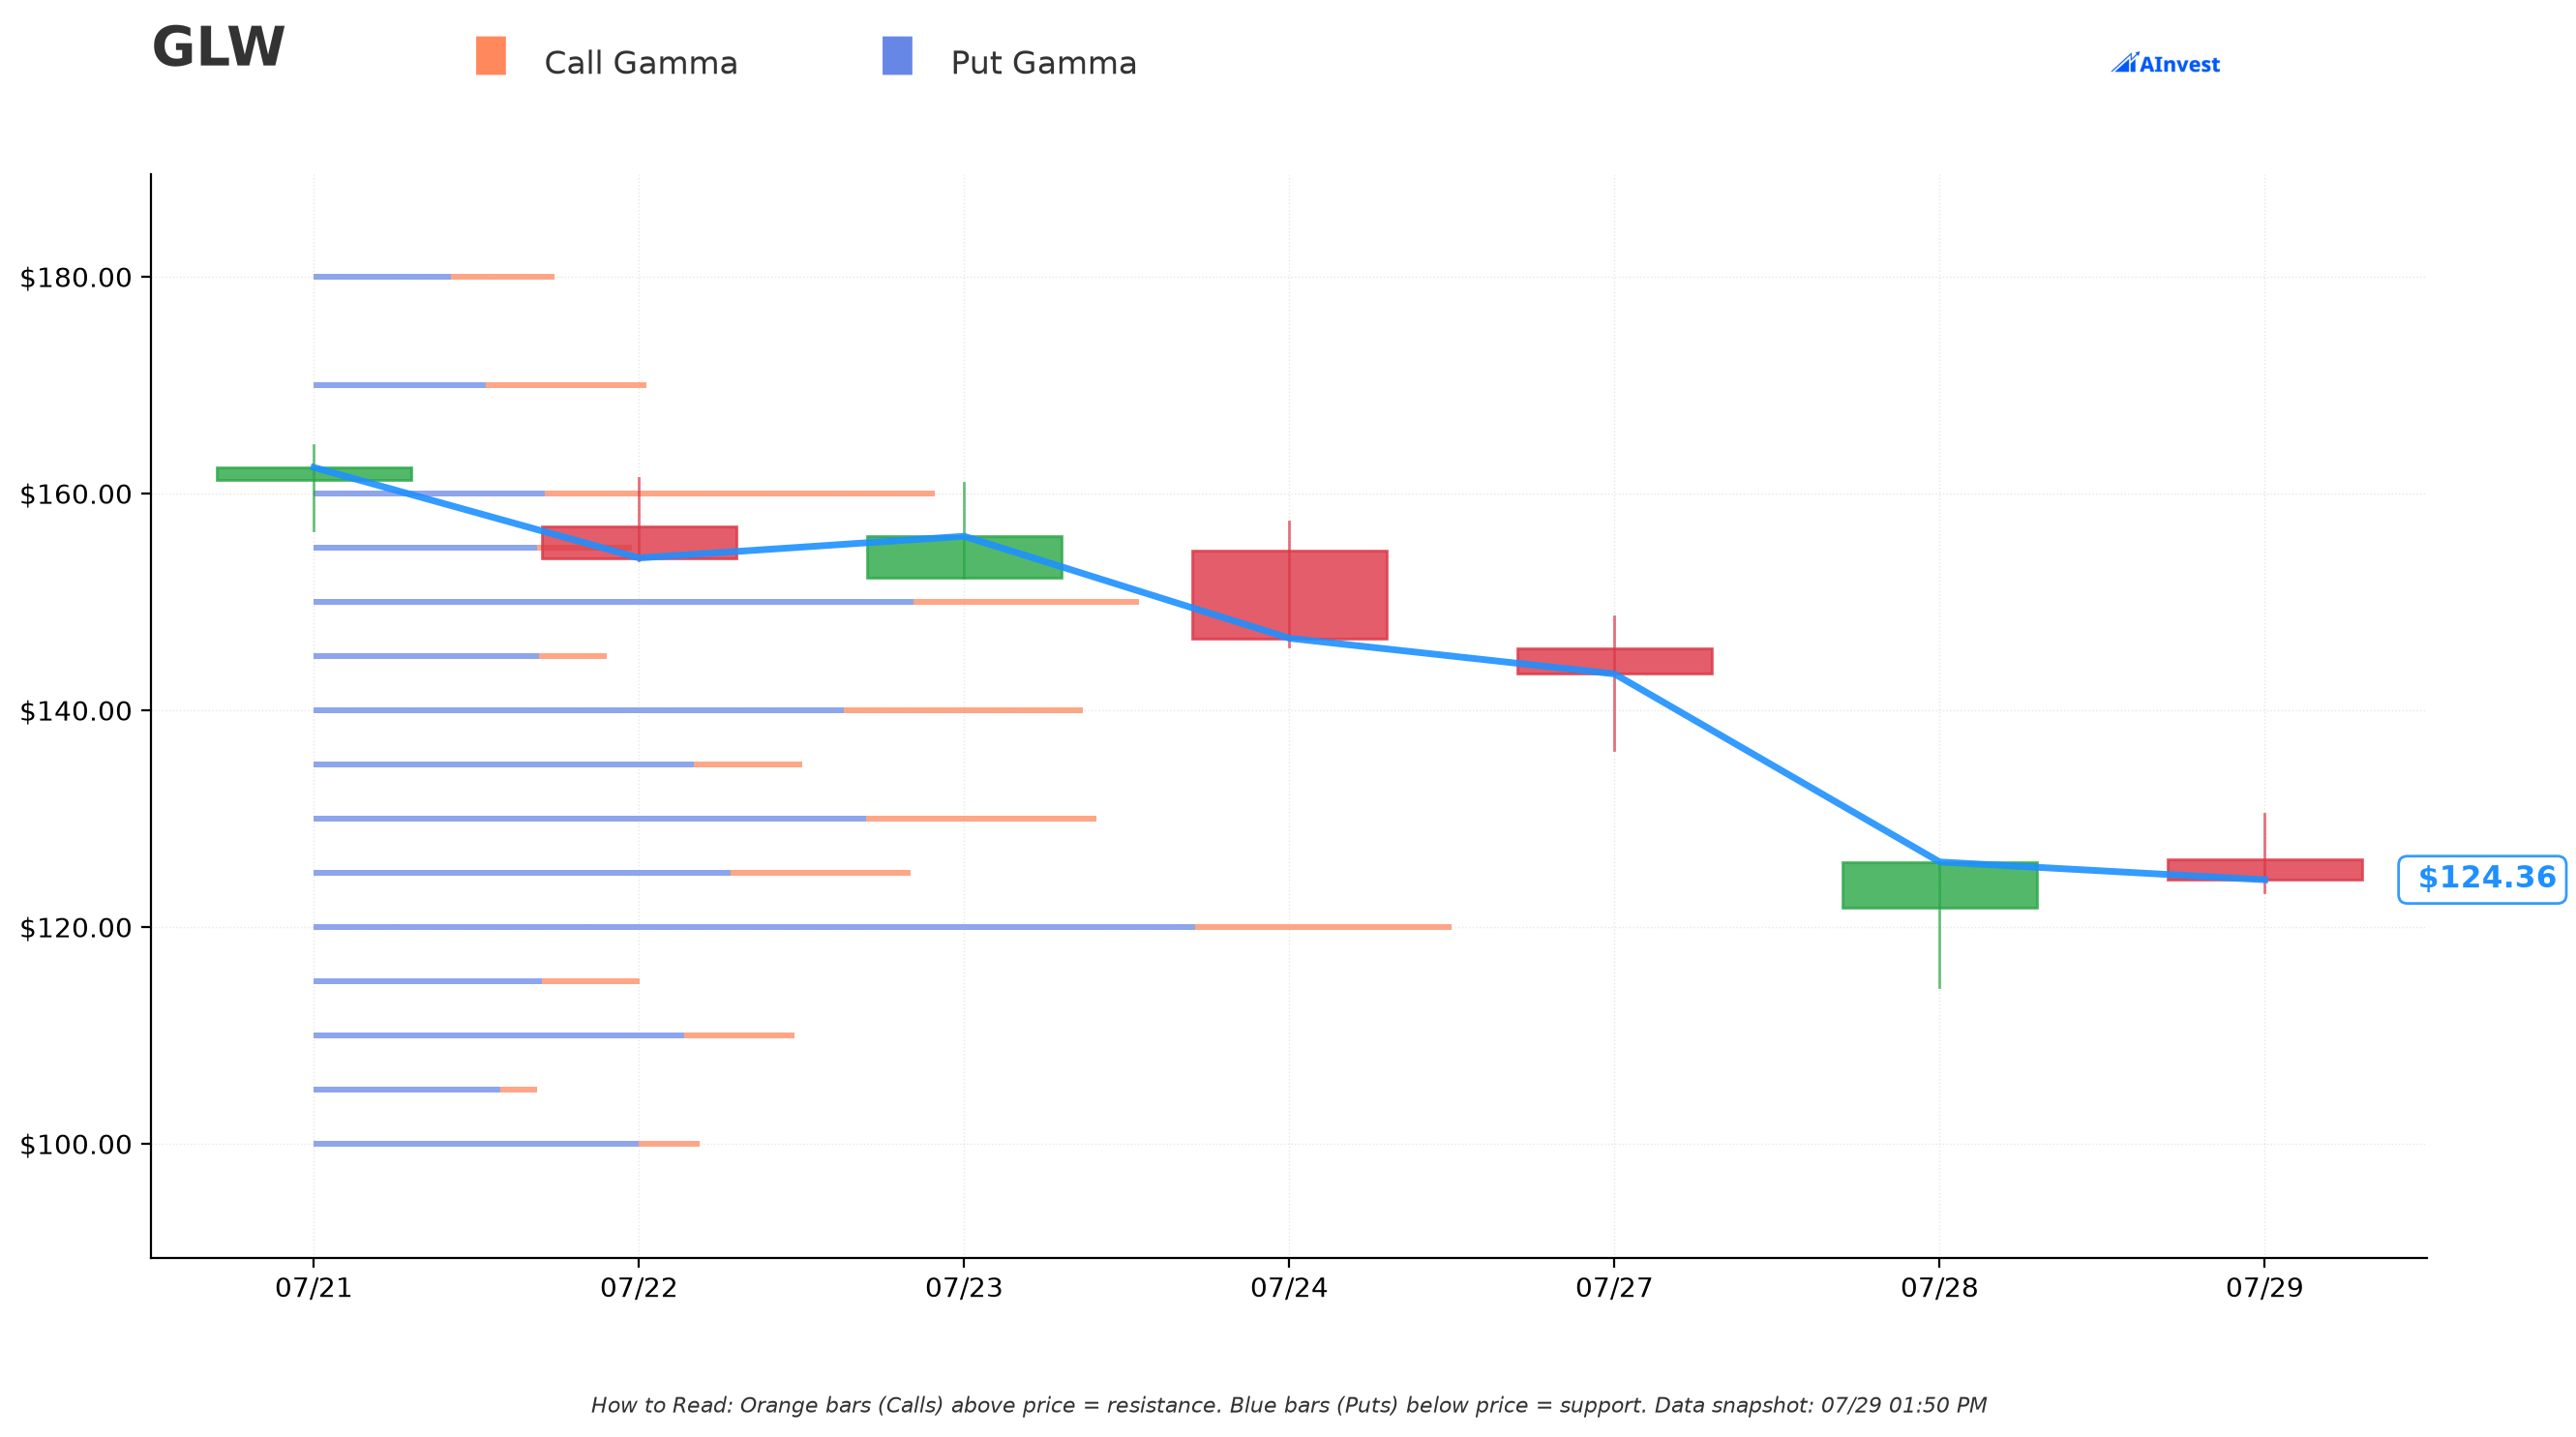
Current Price: ≈$123.84
- 🔵 Support: $120 (moderate strength, ≈4.5B total gamma, ≈3.1% below spot) — dealers have meaningful put gamma stacked here; this is the nearest real floor.
- 🟠 Resistance: $130 (moderate strength, ≈3.1B total gamma, ≈5.0% above spot) — the nearest ceiling where dealer hedging flows would likely cap rallies.
What this means for traders: GLW is sitting in a fairly tight $120-$130 gamma box right now. A clean break below $120 opens the door to more downside pressure (thin gamma below there until the $110-$115 zone); a break above $130 doesn't hit serious resistance again until closer to $135-$140. Both today's option trades sit outside this near-term box — the $115 calls are already in the money below $120 support, and the $310 puts are so deep out in 2028 that gamma at that strike is irrelevant to the next few weeks of price action.
🎲 Implied Move Analysis
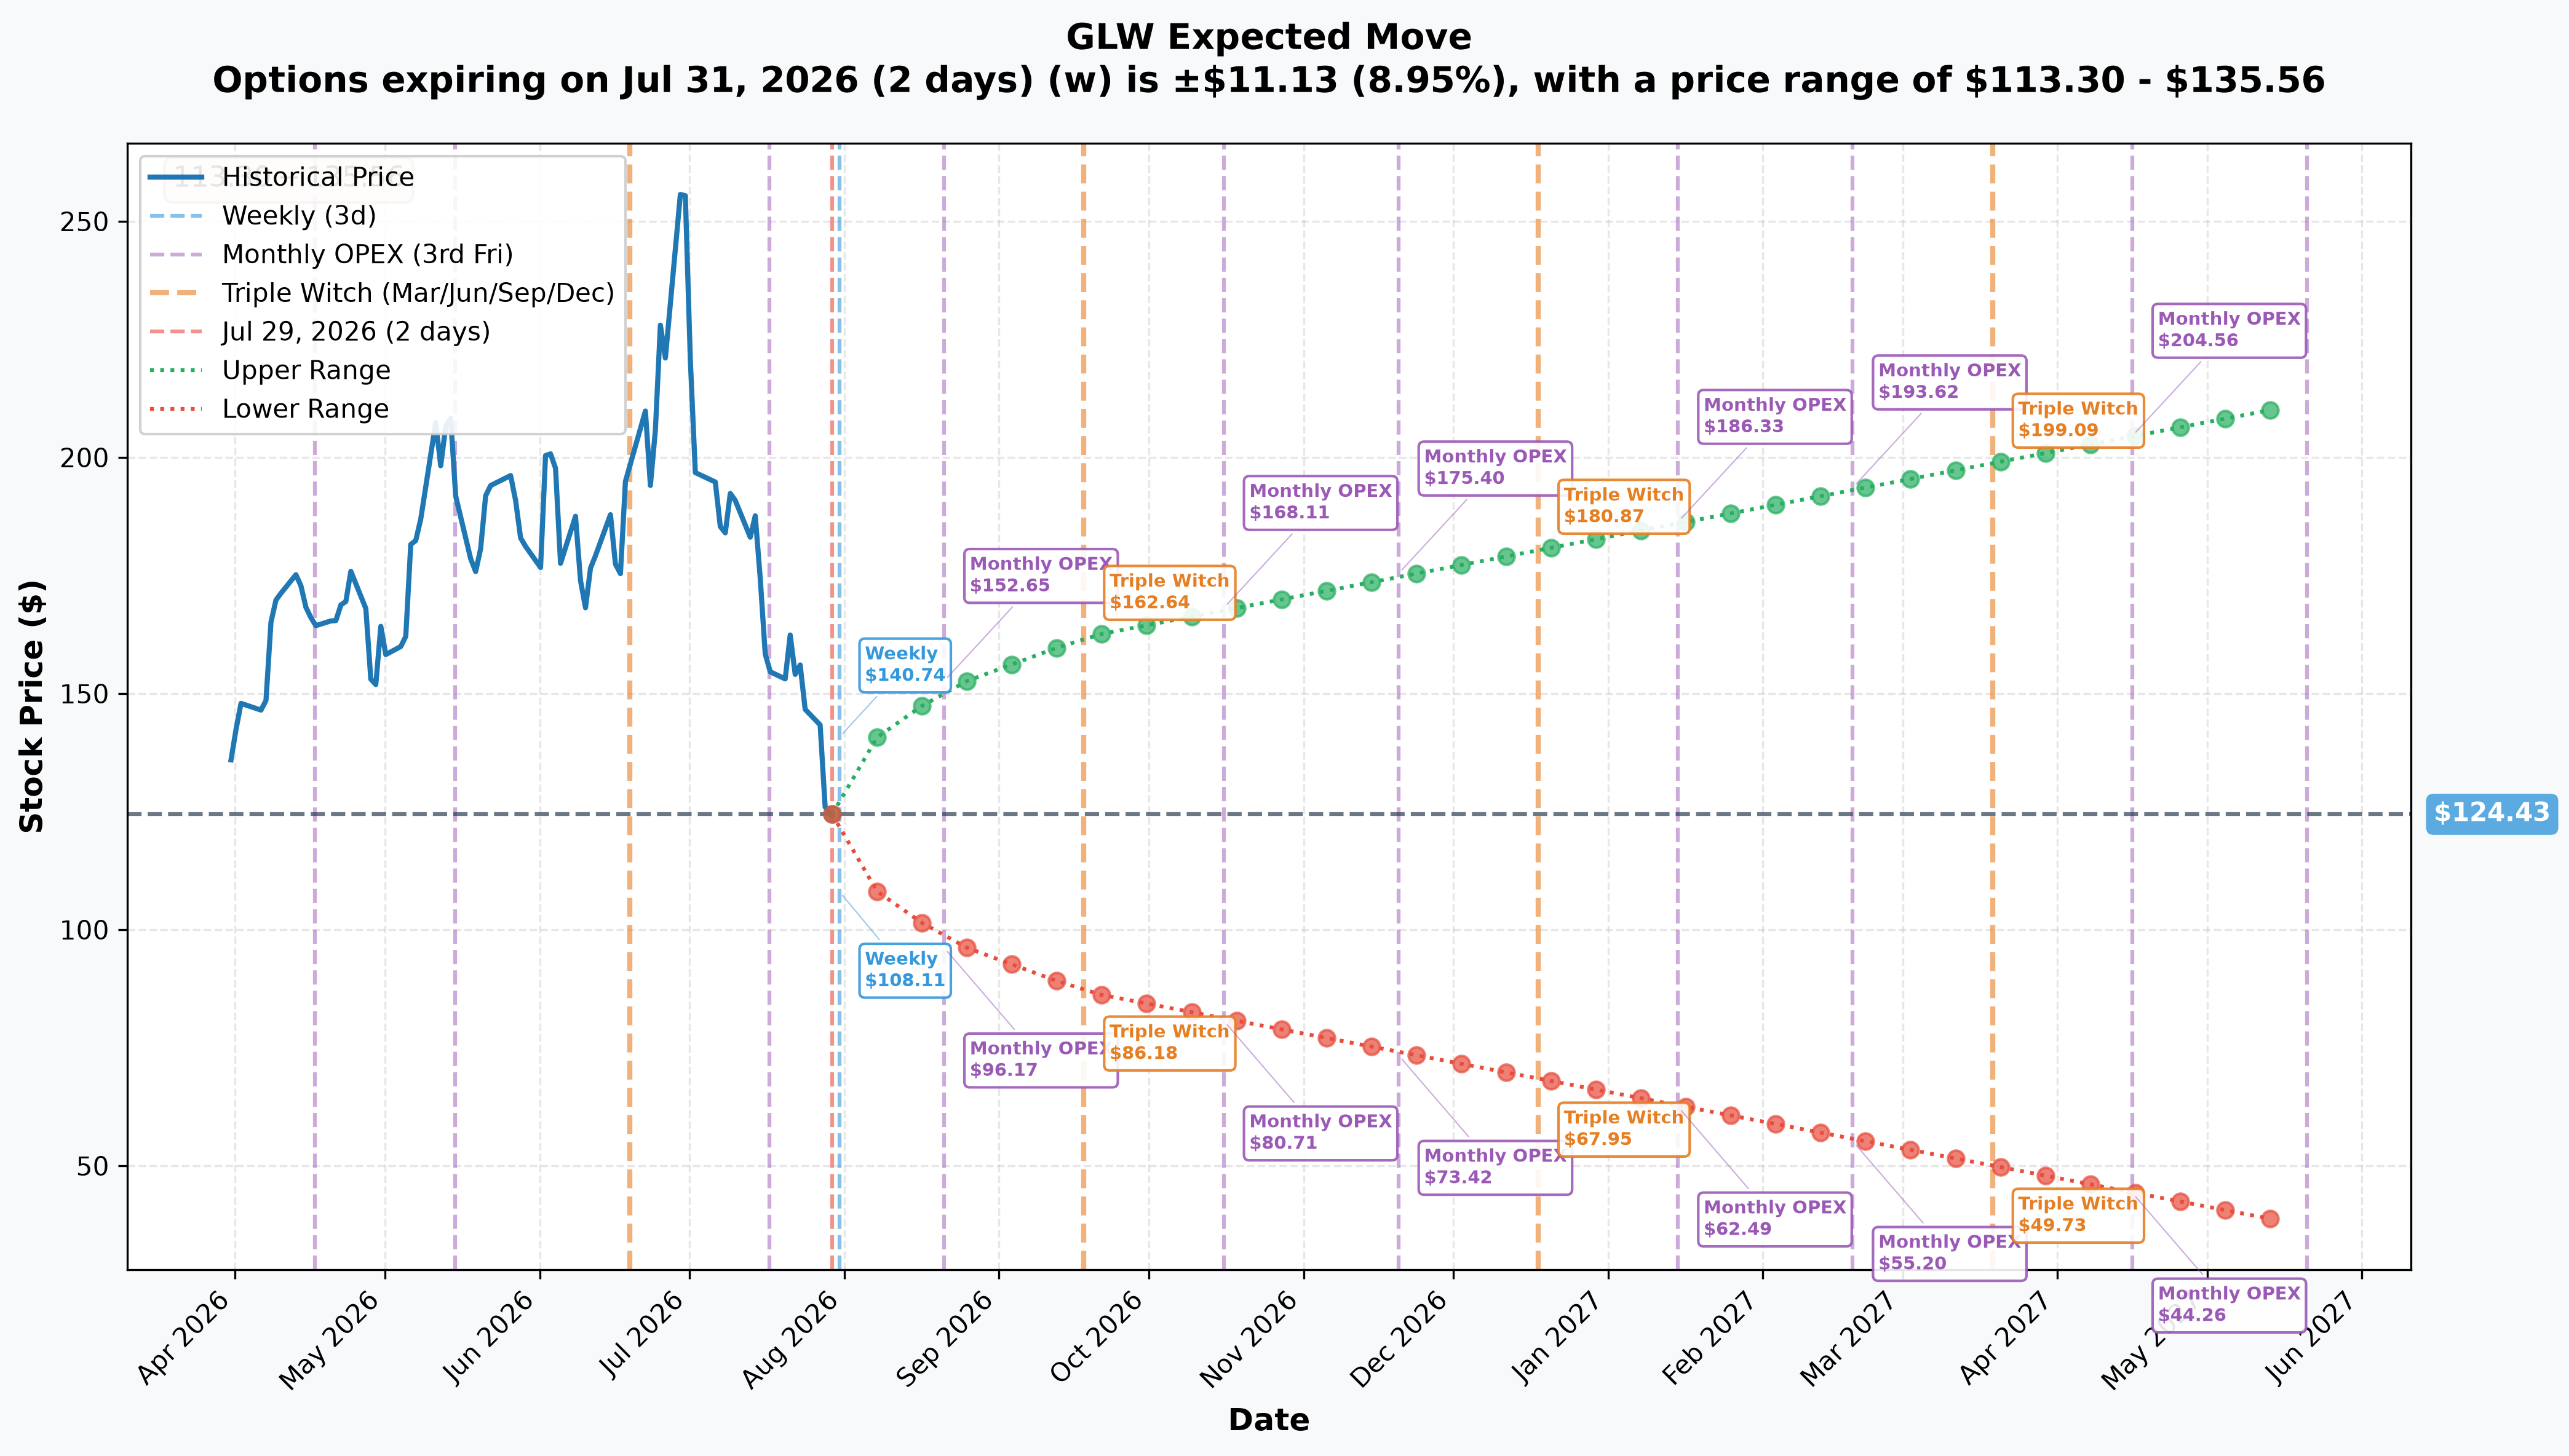
- 📅 Weekly (Jul 31, 2 days): ±$11.13 (±8.95%) → Range: $113.30 – $135.56
- 📅 Monthly OPEX (Aug 21, 23 days): ±$26.68 (±21.44%) → Range: $97.73 – $151.09
- 📅 Quarterly Triple Witch (Sep 18, 51 days — the call's expiration): ±$37.62 (±30.24%) → Range: $86.79 – $162.03
- 📅 LEAPS (May 2027, 296 days): ±$87.24 (±70.12%) → Range: $37.17 – $211.65
Translation for regular folks: options are still pricing GLW as a genuinely wild stock even two days after the crash — a ≈9% move is priced for just the next 48 hours, and by the Sep 18 expiration on today's call trade, the market is pricing a possible swing of nearly a third of the stock's value in either direction. That's exactly the kind of environment where a delta-hedged, volatility-focused structure (like Trade 1) makes more sense than a simple directional bet.
🎪 Catalysts
✅ Already Happened
Q2 2026 Earnings — July 28, 2026: Beat, but the stock cratered anyway. Corning posted core sales of $4.74B (+17% YoY) and core EPS of $0.78 (+30% YoY), beating the $0.76 EPS / $4.63B consensus, per Yahoo Finance/Zacks. Optical Communications sales jumped 32% YoY to $2.07B with AI-datacenter-related sales nearly doubling, per Converge Digest. The stock still fell ≈16-18% — the biggest one-day drop since July 30, 2002 — because Q3 guidance came in merely in-line ($4.9B-$5.0B revenue) with management flagging that high-density optical demand remains above production capacity, plus softer smartphone demand, per The Motley Fool and TheStreet. The selloff dragged the whole optical complex lower — Marvell, Lumentum, Coherent and AXT all fell more than 10%, per CNBC.
The AI-optical growth story is real and intact. Corning has a long-term partnership with NVIDIA (10x U.S. optical-connectivity capacity expansion, NVIDIA investing $500M plus warrants for 15M shares at $180, up to $3.2B total), and management cited long-term agreements with Meta, NVIDIA and Amazon de-risking the Optical Communications ramp, per Yahoo Finance earnings-call highlights. Corning also upgraded its "Springboard" plan to a 20-30-40 framework ($20B annualized sales by end-2026, $30B by end-2028, $40B by end-2030), per Seeking Alpha.
📅 Upcoming
- Q3 2026 earnings (late October 2026): guidance is core EPS $0.85-$0.89, revenue $4.9B-$5.0B — the key test of whether capacity additions can lift the top line above the guided range, per Ticker Report.
- $20B annualized run-rate milestone (end-2026): the near-term Springboard checkpoint investors will track, per Seeking Alpha.
- Optical-capacity ramp (H2 2026 → 2027): with demand above capacity, each new-plant qualification (the NVIDIA-linked North Carolina/Texas facilities) is a potential upside catalyst that could relieve the constraint that capped Q3 guidance, per Fierce Network.
- Gorilla Glass / smartphone cycle (fall 2026): new Apple and Samsung flagship launches could help Glass Innovations, though management flagged softer near-term phone demand as a Q3 headwind, per TheStreet.
🎲 Price Targets & Probabilities
Using the gamma map, the implied-move cone, and the earnings backdrop through the Sep 18 expiration on today's call trade:
📈 Bull Case (30% probability)
Target: $150-$162 (top of the Sep-18 implied-move range, above $130 gamma resistance) Post-earnings dip-buyers step in, the market re-rates the AI-optical story as intact, and Corning grinds back toward its pre-earnings levels as Q3 approaches without a repeat guidance disappointment.
🎯 Base Case (45% probability)
Target: $115-$135 (inside the $120-$130 gamma box, with room to test either edge) GLW spends the next several weeks digesting the earnings shock, trading a wide but rangebound path as the market waits for more concrete evidence the capacity constraint is easing. This is roughly where the delta-hedged call structure (Trade 1) is positioned to earn its keep from movement rather than direction.
📉 Bear Case (25% probability)
Target: $87-$110 (toward the bottom of the Sep-18 implied-move range, below $120 support) Valuation concerns (still ≈46x forward P/E even after the drop, per Simply Wall St) plus continued smartphone softness pressure the stock further before Q3 earnings arrive to reset the narrative.
💡 Trading Ideas
🛡️ Conservative: Wait for the OI Confirmation, Then Watch the Range
Play: Don't chase either leg of today's flow — it's hedged/closing activity, not a directional signal. Instead, watch whether GLW holds the $120 gamma support over the next few sessions.
Why this works: Both trades here are explicitly engineered or inferred to be non-directional. Following them as a "buy signal" or "sell signal" would be reading tea leaves the tape doesn't actually support. Next-day open interest has now confirmed both reads (see the ✅ RESOLVED box above) — the call opened as hedged convexity, the put was closed out — so there is still no directional signal here to follow.
Risk level: Minimal | Skill level: Beginner-friendly
⚖️ Balanced: Defined-Risk Range Play Into the $120-$130 Box
Play: Consider a small $120/$130 call spread or put spread targeting the Sep 18 expiration (same date as today's call trade) if you have a view on which edge of the gamma box breaks first.
Why this works: Defined risk, targets the two concrete gamma levels ($120 support / $130 resistance) rather than guessing a magnitude, and doesn't require betting on today's hedged flow meaning anything.
Risk level: Moderate | Skill level: Intermediate
🚀 Aggressive: Volatility-Only Play, Mirroring the Spirit of Trade 1 (ADVANCED ONLY)
Play: A small $120 straddle around current spot, targeting continued outsized realized volatility through Sep 18 — essentially the same instinct behind today's delta-hedged call trade, scaled to retail size.
Why this could work: GLW just proved it can move 16-18% in a single session, and the options market is pricing ±30% by Sep 18 — if realized volatility keeps running hot, a long-vol structure profits from the swings themselves.
Why this could blow up: Straddles are expensive, time decay is real, and if GLW settles into the calm base-case range, you lose most or all of the premium. This mirrors institutional positioning but without the equity hedge that made Trade 1 direction-neutral — retail traders typically can't replicate the stock-hedge leg efficiently.
Risk level: Extreme (can lose 100% of premium) | Skill level: Advanced only
⚠️ Risk Factors
What we genuinely don't know:
- 👤 We cannot see who's on the other side of either trade, or their full book. The delta-hedge match on Trade 1 (≈100%) is strong statistical evidence of intent, but options data alone can never prove why someone put on a position — it could be a market maker's inventory management, a fund's volatility overlay, or something else entirely.
- 🔁 Trade 2's "closing" read is an inference, not a certainty. Our archive found a prior sale of the exact same $310 strike, which is a strong tell — but size (924) sitting close to prior open interest (1,000) means the tape alone cannot rule out a partial fresh open. Tomorrow's OI print is the real test.
- 📊 Valuation risk remains real regardless of the flow. GLW still trades at ≈46x forward earnings even after the crash, per GuruFocus — any further capacity or demand disappointment could compress the multiple further.
- 🌐 AI-capex concentration risk: Corning's growth engine leans heavily on NVIDIA/Meta/Amazon buildouts; any deceleration in hyperscaler capex hits the core bull case, per CNBC.
- 🎢 Extreme near-term volatility: with an implied move of ≈21% by the Aug 21 monthly OPEX, GLW can gap hard on very little news right now — position sizing matters more than usual.
🎯 The Bottom Line
Real talk: Two big-dollar option trades hit the tape today on a stock that just had its worst day since 2002 — but resist the urge to read either one as "smart money" calling the bottom or piling into fear. Trade 1 is a delta-hedged, direction-neutral bet on volatility, not a bullish buy-the-dip. Trade 2 looks like a prior position being unwound, not fresh bearish conviction. Both are plumbing, not prophecy.
What we're actually watching:
- ✅ July 30, ≈06:30 ET — in, and both confirmed. The call opened cleanly (219 → 15,286, +15,067). The put's open interest fell to 80 (−920), confirming the closing read almost exactly against our predicted ≈76-100.
- 🛡️ The $120 gamma support — a clean break below opens the door toward the bear-case implied-move zone.
- 🟠 The $130 gamma resistance — the level dealers are likely to defend on any bounce.
- 📅 Late October 2026 — Q3 earnings, the next real catalyst that could either validate the "capacity, not demand" bull thesis or reinforce the valuation-reset bear case.
If you're a GLW shareholder or considering a position: don't treat today's option flow as a signal either way. Focus on the fundamental question — is the ≈16-18% drop a valuation/guidance reset in an otherwise-intact growth story, or the start of something worse? That question gets answered by capacity-ramp updates and Q3 guidance, not by hedged options flow.
Mark your calendar:
- 📅 July 31, 2026 — weekly options expiration, ±8.95% implied move window closes
- 📅 August 21, 2026 — monthly OPEX, ±21.44% implied move window closes
- 📅 September 18, 2026 — Triple Witch expiration, same date as today's call trade, ±30.24% implied move window closes
- 📅 Late October 2026 — Q3 2026 earnings, the next fundamental catalyst
Disclaimer: Options trading involves substantial risk of loss and is not suitable for all investors. This analysis is for educational purposes only and not financial advice. The delta-hedge and closing-trade interpretations above were inferred from the options tape, the paired equity block, and archived prior trades — next-day open interest has since confirmed both (call opened +15,067; put retired −920), but open interest still cannot prove intent, identity, or motive. Always consult a licensed financial advisor before trading.
About Corning Incorporated: Corning is a specialty-glass, ceramics and optical-physics materials company serving telecom, AI-datacenter, mobile-consumer-electronics and solar markets, with a market cap of ≈$107 billion.
Last updated: July 30, 2026 — next-day OPRA open interest resolved both trades and confirmed both published reads. Sep-2026 $115 call: 219 → 15,286 (+15,067), fresh open (BTO). Jan-2028 $310 put: 1,000 → 80 (−920), buy-to-close, landing inside our predicted ≈76-100 range. No narrative change; both provisional flags retired. Original publication: July 29, 2026.