🔄 GLW Desk Rolls $140 Calls Up & Out for Just ≈$1.65M Net — Not a New $50M Bet
📅 August 10, 2026 | 🔥 Unusual Activity Detected
🎯 The Quick Take
At 10:37:51 ET, a desk rolled its Corning (GLW) call position up and out: bought 13,000 November 20 $140 calls (≈$49.66M) while selling 10,000 September 18 $115 calls (≈$48.01M). Both legs printed at 10:37:51 as a negotiated floor block — a manually worked trade with a known counterparty, not an aggressive sweep. Line them up and the desk spent roughly $98M of gross premium to move ≈$1.65M net — repositioning further from spot and two months later in time for almost nothing out of pocket. That's the real story here, not the headline dollar figure.
📊 Company Overview
Corning Incorporated (GLW) is a 175-year-old materials-science company that makes specialty glass, ceramics and optical physics products. Since Q1 2026 it reports across five segments: Optical Communications (fiber, cable and connectivity for AI data centers — the growth engine), Glass Innovations (display glass plus Gorilla Glass cover glass), Automotive, Solar (Hemlock Semiconductor polysilicon plus wafers/modules), and Life Sciences and Emerging Growth.
- Market cap: ≈$139–143 billion (sources sampled at different times of the session)
- Sector / industry: Technology — Electronic Components (Information Technology → Electronic Equipment, Instruments & Components under GICS)
- Spot at trade time: $163.01
- Year-to-date: up ≈78% (as high as +82.7% earlier this week), but the stock is also ≈40% below its June 30 record close of $271.38 — both are true at once. The 2026 move has been almost entirely a re-rating as an AI-infrastructure optical supplier (Meta, two more hyperscalers, NVIDIA's $500M warrant partnership, Amazon), followed by a brutal ≈46% July drawdown on soft Q3 guidance, and a recent bounce on the August 6 Section 232 polysilicon tariff decision that protects Corning's Hemlock business.
💰 The Option Flow Breakdown
📊 What Just Happened — the Full Tape
| Time | Buy/Sell | Call/Put | Expiration | Premium | Strike | Volume | OI | Size | Spot | Option Price | Option Symbol | Order Type | Strategy |
|---|---|---|---|---|---|---|---|---|---|---|---|---|---|
| 10:37:51 | BUY | CALL | 2026-11-20 | $49.66M | $140 | 13,000 | 376 | 13,000 | $163.01 | $38.20 | GLW20261120C140 | BTO | Long Call Roll |
| 10:37:51 | SELL | CALL | 2026-09-18 | $48.01M | $115 | 10,000 | 10,000 | 10,000 | $163.01 | $48.01 | GLW20260918C115 | ✅ STC (resolved; ≈41% retired) | Long Call Roll |
Mechanism: 🤝 both legs printed as a floor block — manually negotiated on an exchange floor between a broker and a known counterparty. This was not urgent, book-taking buying; it's a worked, pre-arranged repositioning. No sweep, no panic.
Net premium: ≈$49.66M paid − ≈$48.01M collected = ≈$1.65M net debit for the whole roll.
✅ RESOLVED — The Roll Is Confirmed, But Only ≈41% of the September Leg Actually Retired
Updated 2026-08-11 pre-market. Resolving OPRA snapshot timestamped August 11 (reflects the August 10 close); baseline is the August 10 snapshot (reflects August 7 — before these prints).
| Leg | Baseline (Aug-10) | Resolving (Aug-11) | Δ | Print size | Δ as % | Day vol | Our published prediction | Verdict |
|---|---|---|---|---|---|---|---|---|
| Nov-20 $140 call (bought) | 376 | 13,187 | +12,811 | 13,000 | +98.5% | 13,177 | "376 → roughly 13,000+" | ✅ OPEN (BTO) |
| Sep-18 $115 call (sold) | 10,254 | 6,183 | −4,071 | 10,000 | −40.7% | 10,022 | ≈250 or lower if STC | ✅ CLOSE (STC) — direction confirmed |
The November leg landed on the prediction: 13,187 against "roughly 13,000+". Open interest rose 12,811 on a 13,000-lot purchase — a proven, essentially complete new long call position.
The September leg confirmed the closing direction, and decisively ruled out the alternative. We wrote that open interest holding near 10,000–20,000 would mean this sale opened a fresh short call — "a materially different, more aggressive read." That did not happen. Open interest fell to 6,183, so the STC label in the order-type column stands and the roll framing holds.
But the magnitude fell well short of our prediction, and that deserves stating plainly. We predicted OI would drop to ≈250 or lower if this was a clean close. It dropped to 6,183 — a decline of 4,071, or ≈41% of the 10,000 contracts sold. The other ≈59% transferred to opening buyers rather than retiring. So: a long holder did sell, the build-then-unwind pattern at the $115 strike did continue (219 → 15,286 → 10,253 → 6,183), but 6,183 contracts remain outstanding at that strike, now in someone else's hands. The direction of this read was right; the completeness of the exit was overstated.
🤓 What This Actually Means — Plain English
This is a call roll, not two separate bets and not a credit spread. One trader (or desk) already owned a large position in the September $115 calls. Today they sold those calls and simultaneously bought new November $140 calls — swapping a near-dated, deep-in-the-money position for one that's farther out in time and farther out of the money.
Why the $115 call is basically just stock in disguise. Look at the numbers: the September $115 call sold for exactly $48.01 — and its intrinsic value (spot $163.01 minus strike $115) is also exactly $48.01. That means the option carried $0.00 of time value. Every penny of that $48.01 price was money the call would be worth even if the stock never moved another cent before expiration. A call that deep in the money, with zero extrinsic value, behaves almost exactly like owning 100 shares of stock per contract — it isn't really "betting on Corning" anymore, it's a stock substitute that happens to be held in options form (often for capital-efficiency or leverage reasons). Selling a call like that is not a bearish signal. You're not betting against the stock; you're cashing in a position that has already worked and converting it into a fresh, more leveraged one.
Why this reads as bullish, not neutral. The desk didn't just close the position and walk away — it immediately redeployed nearly all the proceeds into a brand-new $140 call, a strike that's ≈14% above today's $163.01 spot, expiring two months later (November 20 versus September 18). Rolling a strike up and an expiration out while spending only ≈$1.65M net to do it is a classic "letting the position ride" move. If Corning had simply stalled or rolled over, the cheapest path would have been to take profits and walk away — not to pay to re-lever into a farther-out, farther-OTM strike.
Order type breakdown, plain English:
- BTO on the $140 call = paid premium to open a brand-new long position (proven — size 13,000 vs. prior OI of just 376).
- STC (✅ resolved 2026-08-11) on the $115 call = closing an existing long. On the trade day this was a strong inference from the build-then-unwind open-interest pattern, not proof, since size (10,000) sat right at prior OI (10,254). The next-day snapshot settled it: open interest fell to 6,183, ruling out the STO branch that would have flipped this into an income/hedge trade. Note the magnitude — only ≈41% of the sale actually retired contracts; the rest transferred.
The bottom line on cost. Nearly $98M of gross option premium changed hands today, and the actual net cost of repositioning was ≈$1.65M — about 1.7% of the gross dollar figure. Headlines that only quote the $49.66M "BUY" side would badly overstate what's really a modest, largely self-funding adjustment.
📈 Technical Setup / Chart Check-Up
YTD Chart
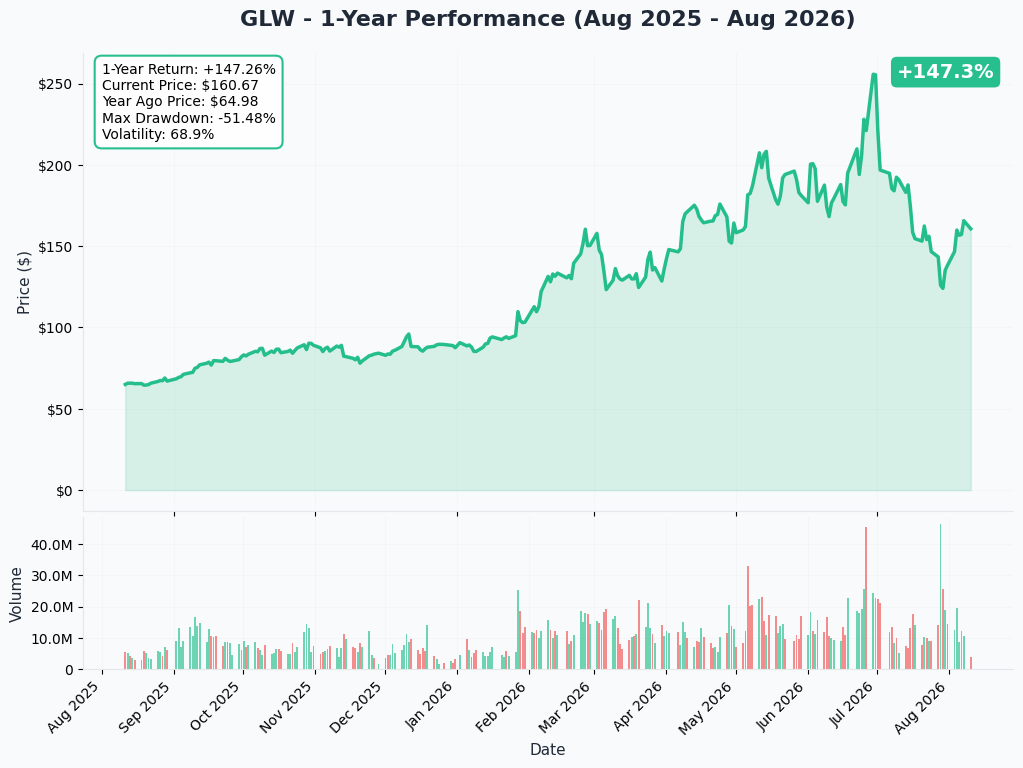
Corning is up ≈78% year-to-date at today's ≈$161–163 print, but that YTD gain sits on top of a violent round trip: a rally to an all-time closing high of $271.38 on June 30, followed by a ≈46% July collapse (its worst month in 24 years) that culminated in an ≈18–19% single-day drop on July 28 after Q3 guidance came in below the top of consensus. The roll being put on today happens well below that peak, in the middle of a recovery attempt.
Gamma-Based Support & Resistance Analysis
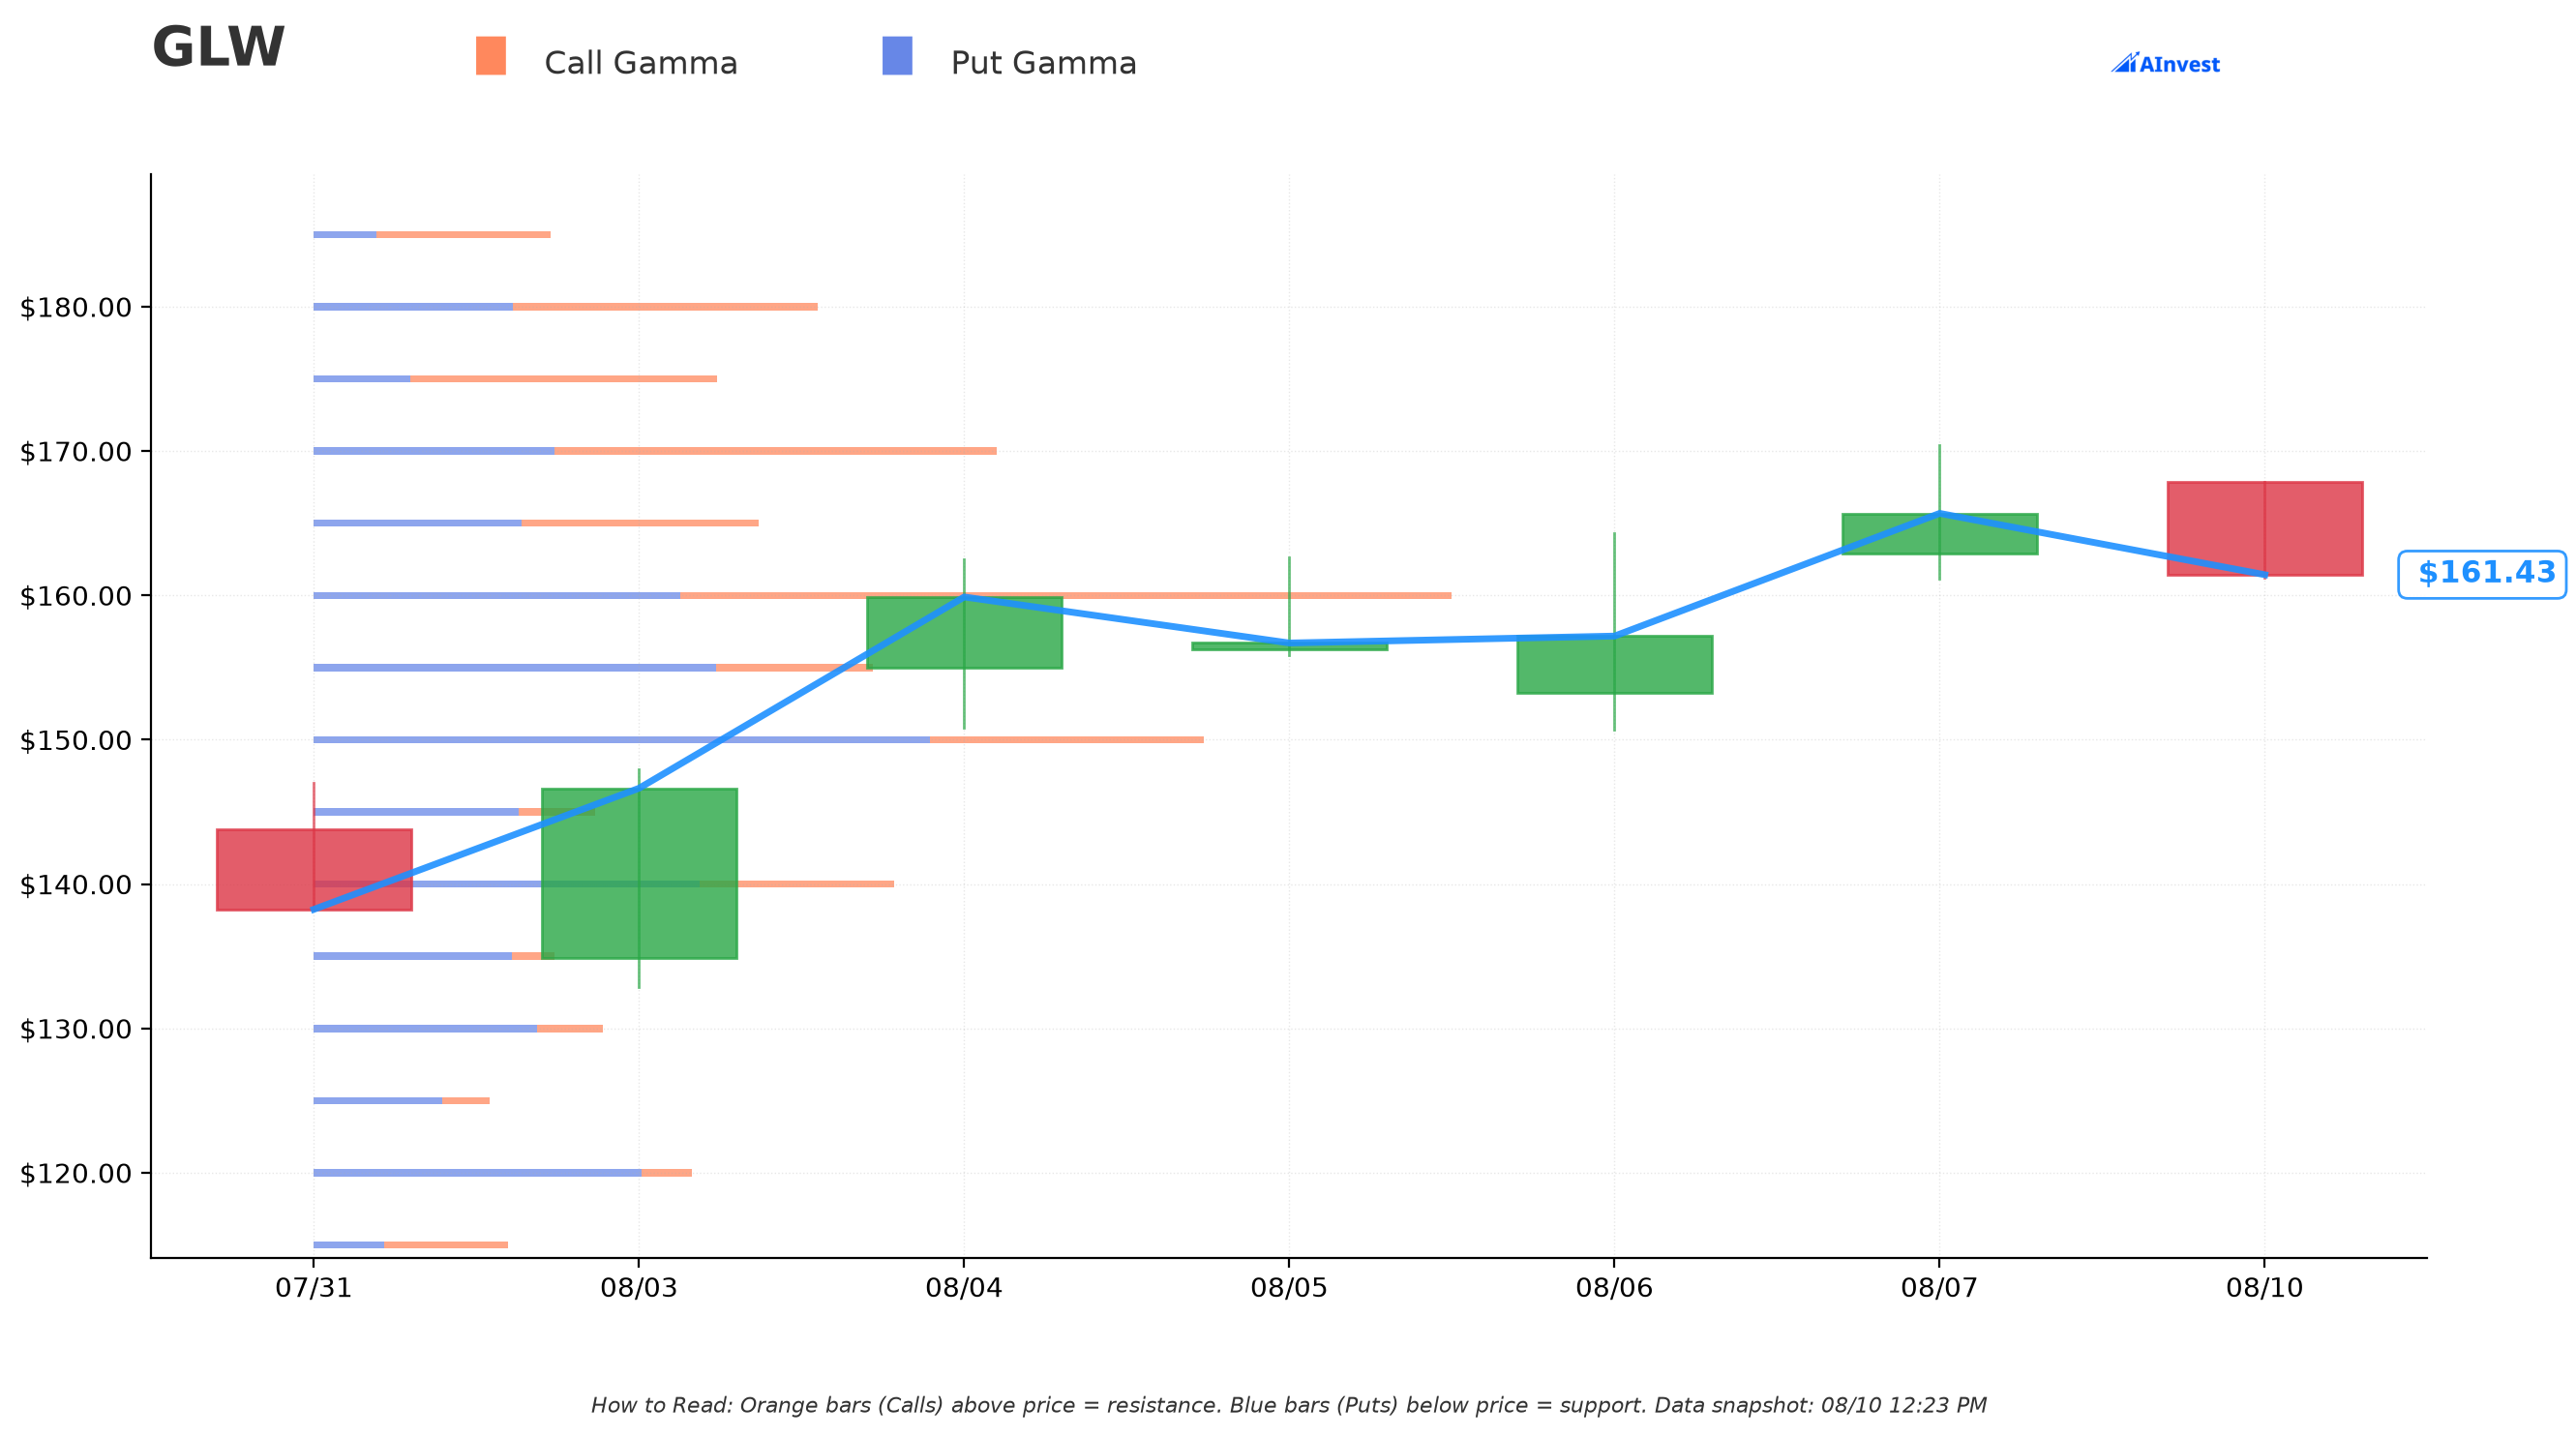
Using the current gamma exposure map (spot ≈$161.42–163.01 depending on snapshot time):
🔵 Support:
- $160 — the single strongest level on the board, total gamma exposure of ≈5.88 (call gex ≈3.99 / put gex ≈1.89), sitting just ≈0.9–1.4% below spot — a real magnet in the very near term.
- $155 — moderate support, total gex ≈2.89, ≈4% below spot.
- $150 — moderate support, total gex ≈4.60, ≈7% below spot.
🟠 Resistance:
- $170 — the one clearly flagged resistance level, total gex ≈3.53 (call gex ≈2.29 / put gex ≈1.24), ≈5.3% above spot.
- Beyond that, gamma thins out materially into the $175–$200 zone before building back up around $195–$200.
What this means for the trade: the sold $115 strike sits far below both spot and every meaningful gamma level shown here — it's deep in dealer put-wall territory that no longer matters to this position. The new $140 long call, by contrast, sits inside a zone with real gamma (total gex ≈3.00 at the $140 strike itself) — meaning dealer hedging flows around that strike could add some chop as November approaches, but it is not an extreme outlier level.
Implied Move Analysis
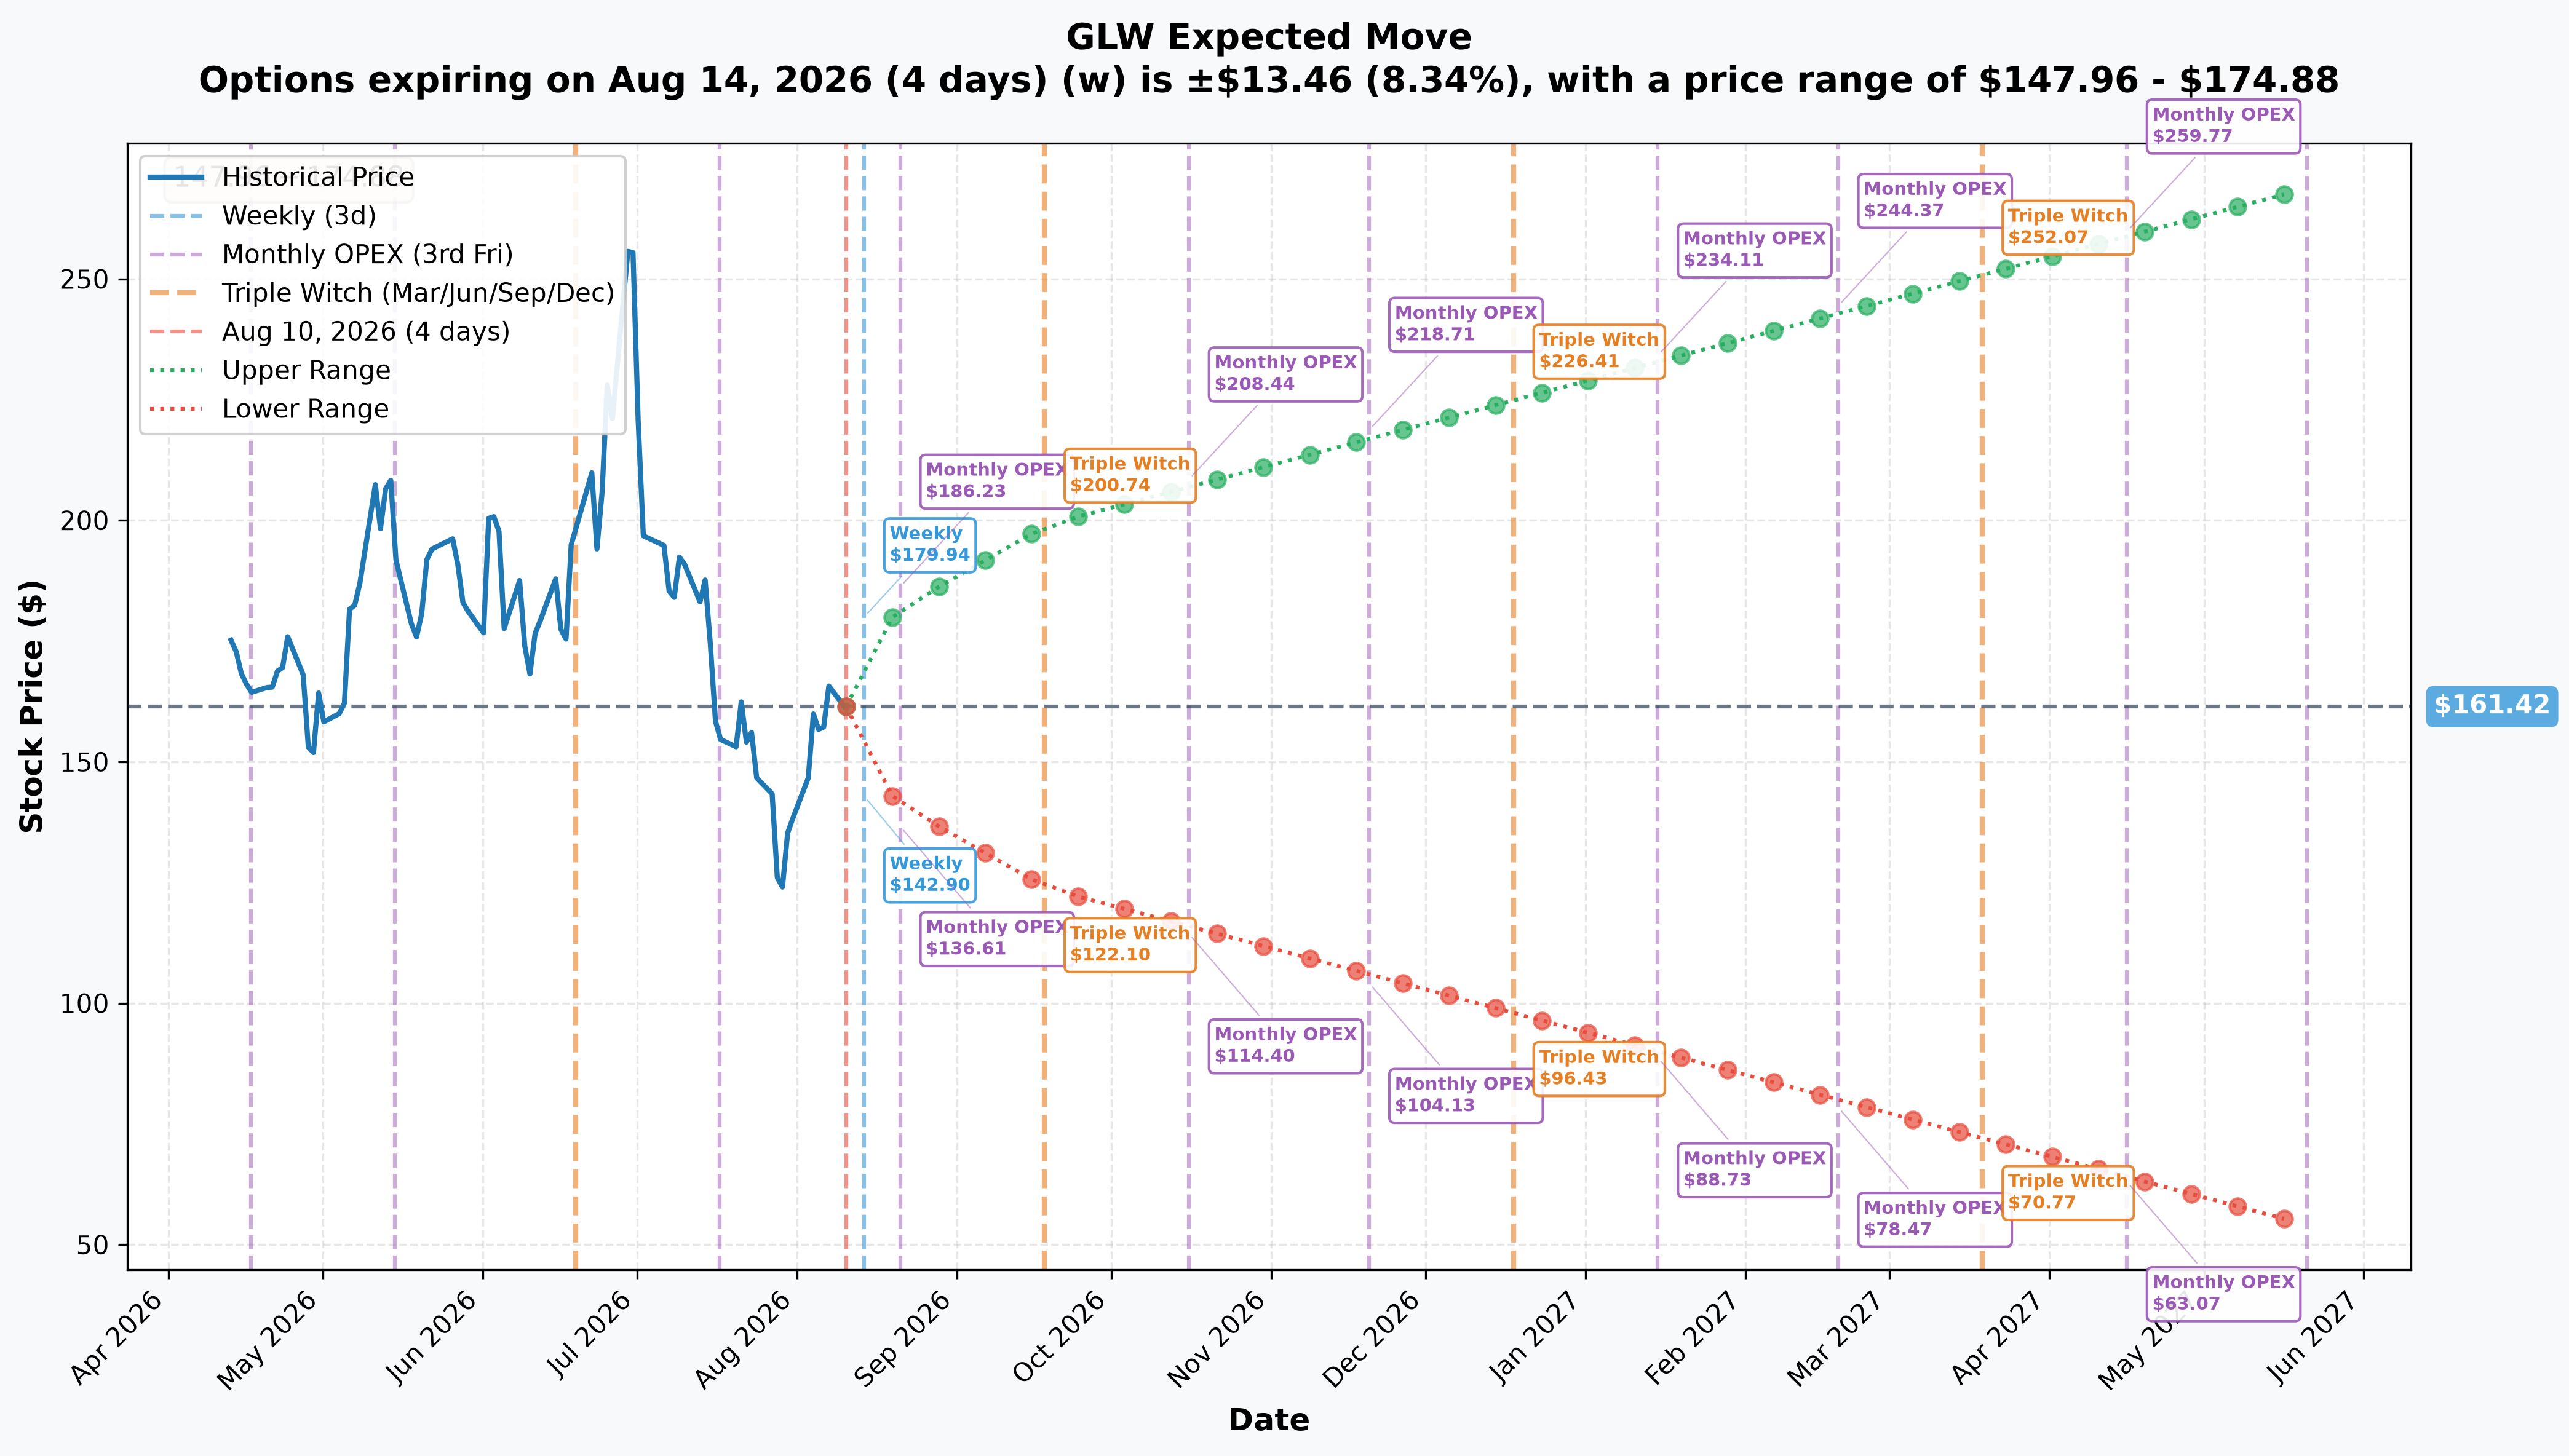
Concrete ranges from the options market, spot ≈$161.42:
- Weekly (Aug 14, 4 days): ±8.34% (±$13.46) → range $147.96 – $174.88
- Monthly OPEX (Aug 21, 11 days): ±12.72% (±$20.54) → range $140.88 – $181.96
- Quarterly Triple Witch (Sep 18, 39 days — the SOLD call's expiration): ±23.3% (±$37.61) → range $123.81 – $199.03
- LEAPS (May 21, 2027, 284 days): ±66.58% (±$107.48) → range $53.94 – $268.90
The sold $115 strike sits well below even the wide September lower bound of $123.81 — the market is not pricing meaningful odds of GLW revisiting $115 by September 18, reinforcing why that call had zero time value left. The new $140 strike, meanwhile, sits comfortably inside the September implied-move range and only modestly above it by the time November arrives — a reasonable, not extreme, out-of-the-money target for a bullish repositioning.
🎪 Catalysts
⚠️ Important: separate the option expiration dates from Corning's actual company events. September 18, 2026 and November 20, 2026 are simply the days these contracts stop existing — Corning has nothing scheduled on either date itself.
Already happened (context for why this roll exists)
- Jan 27, 2026: Meta multiyear agreement worth up to $6B for AI-data-center optical fiber — set the hyperscaler-prebuy template.
- May 6, 2026: NVIDIA partnership — 10x U.S. optical connectivity capacity, $500M in equity warrants; GLW closed +12.01% at an all-time high of $181.57 per BigGo Finance.
- Jun 30, 2026: All-time closing high of $271.38 per Schaeffer's.
- Jul 28, 2026: Q2 core EPS $0.78 beat the $0.75 consensus, but Q3 guide of $4.9–5.0B / $0.85–0.89 sat at the low end of expectations — stock fell ≈18–19% in one session per GuruFocus.
- Aug 6, 2026: Section 232 polysilicon tariffs announced — 15% duty plus minimum import prices, protecting Corning's Hemlock Semiconductor business (one of only two U.S. polysilicon plants).
- Aug 7, 2026: GLW +≈5% to ≈$166 on the tariff news, per TIKR — "a polysilicon tariff, not AI, did it."
Falling INSIDE the September 18 sold call's life
- Aug 31, 2026: Ex-dividend date, per StockAnalysis.
- Sep 9, 2026: Citi 2026 Global TMT Conference — the only company-confirmed event before this expiration. Q3 earnings do NOT fall before September 18 — this contract expires without seeing that print.
Falling INSIDE the November 20 bought call's life (the earnings-bearing window)
- Everything above, plus:
- ≈Oct 27, 2026 (estimated, not company-confirmed): Q3 2026 earnings + initial Q4 guidance, per Public.com — the print that matters most, since it was July's guidance, not the Q2 results themselves, that triggered the ≈18% single-day drop.
- During Q3: Management's stated expectation of hitting the $20B annualized Springboard run rate a quarter early, confirmed only at that Q3 print, per the Q2 call transcript.
- During Q3: Solar segment expected to inflect back to profit post-shutdown.
Falling AFTER November 20 (outside both contracts)
- Dec 4, 2026: Section 232 polysilicon tariffs and minimum import prices take legal effect — 14 days after the November call expires.
- ≈late Jan 2027: Q4/FY2026 results and FY2027 guidance.
Why this matters for the roll: by moving from September 18 to November 20, the desk moved its call position from a window with essentially zero scheduled Corning catalysts into the window that actually captures Q3 earnings and the Q4 guide — the single event that has moved this stock ≈18% in a day this year.
🎲 Price Targets & Probabilities
Using the gamma map and implied-move data above through the November 20 expiration:
📈 Bull Case (≈25–30% probability)
Target: $190–$200+ Q3 earnings and Q4 guidance both beat expectations (unlike July), Solar inflects to profit as promised, and the market re-rates optical growth as merely decelerating-but-still-strong rather than slowing structurally. This would put spot near the top of the November implied-move-adjacent zone; the $140 call would be deep in the money.
🎯 Base Case (≈45–50% probability)
Target: $150–$180 range GLW chops within its recent post-drawdown recovery band, digesting the polysilicon-tariff bounce while the market waits for Q3 numbers. Gamma support at $160 and resistance at $170 likely define near-term trading, with the wider September/November implied-move ranges ($123.81–$199.03 and beyond) capturing the realistic full-window outcome.
📉 Bear Case (≈20–25% probability)
Target: $130–$145 A repeat of the July pattern — decent Q3 results but guidance that reads as soft relative to elevated expectations — triggers another sharp single-day drawdown, similar in magnitude to the July 28 move. The $140 call would then be at risk of expiring worthless or deep out of the money.
💡 Trading Ideas
🛡️ Conservative: Watch, Don't Chase
Wait for tomorrow's OPRA open-interest print to resolve whether the $115 call was truly closed (STC) or opened fresh (STO) before drawing any conclusion about this desk's conviction. If it confirms STC, that supports a "patient bull rolling a winner" read; if it resolves STO, the picture changes to more of an income/hedge structure and should be treated with less directional confidence.
⚖️ Balanced: Track the $140 Level Into November
Rather than copying a 13,000-lot institutional position, a retail-sized version might watch for pullbacks toward the $155–$160 gamma-support zone ahead of the ≈Oct 27 earnings date, using small defined-risk call spreads (e.g., $155/$170) that expire after earnings to participate in a possible post-guidance move without the binary risk of an outright naked call into the print.
🚀 Aggressive: Speculative OTM Call Into Earnings (Advanced Only)
A trader who wants direct exposure to the same November earnings window this desk is now positioned for could look at GLW November $170 or $175 calls — well out of the money, cheap in premium relative to the $140 strike, but entirely dependent on a strong Q3 beat-and-raise. Size this as a small, fully-at-risk position only — options this far out of the money frequently expire worthless.
👥 Four Ways to Read This Trade
🎰 YOLO Trader
Be blunt with yourself here: GLW is up ≈78% year-to-date, but it also fell ≈46% in a single month in July — its worst month in 24 years. A stock that can do both of those things in the same year is not a one-way ride, and chasing the same $140 strike this desk just bought carries real two-way risk, not free upside. If you want in, this is not a "load up naked calls and hope" setup — the ≈Oct 27 earnings guide (the exact thing that triggered the July drop) sits inside this contract's life. Do not treat a $98M gross headline as a green light to YOLO a big premium outlay into that print; the desk itself only risked ≈$1.65M net to make this move, which tells you something about position sizing discipline you should copy, not ignore.
📈 Swing Trader
This roll is a useful read on institutional positioning, not a signal to enter today. The desk moved its call exposure from a window with essentially no Corning catalysts (September 18) into the window that captures Q3 earnings and Q4 guidance (November 20) — a deliberate bet that the next print goes better than July's. A swing trader could use the $160 gamma-support / $170 gamma-resistance zone from the chart above to time entries around that same earnings window, but should size for the possibility that guidance disappoints again, since that's precisely the risk this desk is now carrying into November. Do not assume the roll itself is a timing signal for this week — the trade tells you about the next ten weeks, not the next few days.
💰 Premium Collector
Important correction if you're scanning this board for premium-selling ideas: this desk is not collecting premium on net. They sold ≈$48.01M of premium on the $115 call but immediately spent ≈$49.66M buying the $140 call — a net debit of ≈$1.65M, not a credit. This is the opposite of an income trade; it's a directional repositioning that happens to be nearly self-funding. If you're a premium collector looking to replicate something here, there isn't a credit structure to copy — you'd have to build your own (e.g., a covered call or a credit spread against your own thesis), because what's on the tape today is a long-call roll, not a short-premium strategy. Do not mistake the size of the sold leg for "someone collected $48M" — it was recycled straight into a new long position.
🌱 Beginner
This is genuinely the clearest teaching example on the board today, so slow down and follow it. The September $115 call sold for exactly $48.01 — and its intrinsic value (spot $163.01 minus strike $115) was also exactly $48.01. That means the option had zero time value left. A call that deep in the money, with no extrinsic value, is economically almost identical to just owning the shares outright — it moves dollar-for-dollar with the stock and carries no extra "lottery ticket" premium. That's why selling a call like that is not a bearish signal — the seller isn't betting against the stock, they're simply converting a position that already worked into cash (or, as happened here, redeploying that cash into a new, higher-strike, later-dated call). If you take one thing from this trade: "in the money" and "bullish bet" are not the same axis — how deep in the money and how much time value remain is what tells you whether an option is still really a bet, or just a leveraged way of holding stock. Do not conclude "someone sold a call, therefore they're bearish" — check the intrinsic value first, every time.
⚠️ Risk Factors
- The $115 leg is genuinely unresolved. We are inferring a close from open-interest history, not proving it. If tomorrow's OI print instead shows the $115 call OI holding near 10,000+, this was a fresh short-call open (STO), not a close — a meaningfully different, less purely-bullish structure.
- The tape cannot tell us the trader's full portfolio. OPRA data shows only these two option legs. We cannot see whether this desk also holds GLW shares, other option strikes, or an offsetting hedge elsewhere — the true net exposure could be very different from what these two legs alone suggest.
- A floor block means a known counterparty, not urgency. This was a negotiated trade, not aggressive book-taking. It reflects one desk's view, not a broad market consensus, and it says nothing about what other market participants are doing today.
- Corning's own guidance has proven the fragile point twice this year — a Q2 beat still produced an ≈18–19% single-day drop in July because guidance missed elevated expectations. The same asymmetry applies directly to the ≈Oct 27 Q4 guide, which falls inside the new $140 call's window.
- Valuation is rich. Trailing P/E of 76.43 and forward P/E of 44.75, per StockAnalysis, leaves little room for a soft print.
- We do not know this trader's cost basis, account size, or motive — only the mechanics of the trade itself. Nothing here should be read as a signal to replicate this position's size or risk.
Disclaimer: Options trading involves substantial risk of loss and may not be suitable for all investors. This analysis is for educational purposes only and is not financial advice. The open/close status of the September $115 call leg is unresolved as of this writing — check back for the next-day open-interest update before drawing conclusions about this trade's full structure. Always do your own research and consider consulting a licensed financial advisor before trading.
Last updated: 2026-08-11 (pre-market) — the next-day OPRA open-interest snapshot resolved this session's provisional flags. Nov-20 $140C 376 → 13,187 (+12,811): OPEN (BTO), on the prediction. Sep-18 $115C 10,254 → 6,183 (−4,071): CLOSE (STC) — direction confirmed and the STO alternative ruled out, but only ≈41% of the 10,000-lot sale retired open interest against a predicted fall to ≈250. The roll framing stands with a corrected exit size. The order-type cell, the order-type discussion and the ⏳ callout were updated.