🎯 HOOD $1.52M Long-Shot Call Bet: Someone's Betting a Beaten-Down Robinhood Rallies 31% by November
📅 August 3, 2026 | 🔥 Unusual Activity Detected
✅ UPDATE — August 4, 2026 pre-market: confirmed open. Open interest on the Nov-20 $120 call rose 943 → 3,396 (+2,453) against a 2,600-lot print — ≈94% of the block became new open interest, close to our predicted ≈3,543. See the ✅ RESOLVED box.
🎯 The Quick Take
Someone paid $1.52 million for 2,600 Robinhood (HOOD) call options struck 31% above where the stock is trading right now, expiring November 20, 2026. This is the smallest ticket flagged on today's board — we're covering it not because of size, but because it's unusually clean: a single leg, genuinely opening, on a stock that's down roughly a fifth of its value this year. It's a contrarian, low-odds, high-payoff structure, and every dollar of the $1.52 million is at risk if HOOD doesn't put together a very large move by November. This is not a "smart money knows something" headline — it's a lottery ticket, and we'll treat it that way.
📊 Company Overview
Robinhood Markets (HOOD) trades on the Nasdaq (SIC classification: securities brokers, dealers & flotation companies) with a market cap of ≈$77.8 billion. Robinhood is the retail brokerage that built its name on commission-free trading and now runs a much broader financial platform — stocks, options, futures, crypto, and (increasingly) prediction markets/event contracts, plus retirement accounts, a high-yield cash sweep product, and early advisory services (Robinhood Strategies). As of year-end 2025 the company reported $322 billion in customer assets and 27 million active accounts; by Q2 2026 that had grown further (detail below). Robinhood went public July 29, 2021, and employs roughly 2,900 people.
💰 The Option Flow Breakdown
📊 What Just Happened
At 12:18:41 ET, one trade printed for the entire 2,600-contract package — a 🤝 BLOCK CROSS, meaning a broker matched a known buyer and seller and printed the trade off the open book rather than it being swept in the lit market. We scanned the full November 20 option chain at that exact millisecond and found exactly one print — genuinely a clean single leg, with no hidden second leg tucked into another strike or expiry.
| Time | Symbol | Buy/Sell | Call/Put | Expiration | Premium | Strike | Volume | OI | Size | Spot | Option Price | Option Symbol |
|---|---|---|---|---|---|---|---|---|---|---|---|---|
| 12:18:41 | HOOD | BUY | CALL $120 | 2026-11-20 | $1.52M | $120 | 3,032 | 943 | 2,600 | $91.54 | $5.85 | HOOD20261120C120 |
🤝 BLOCK CROSS — negotiated off-book, known counterparty. NBBO at the print was $5.65 / $6.00, and the trade printed at $5.85, which is 57% of the way across the spread — a mild lean toward the buy side, but on a cross this reading carries less weight than it would on a lit sweep, because the "aggressor" concept barely applies when a broker pre-arranges both sides.
✅ RESOLVED — Next-Day OI Is In (August 4, 2026 pre-market)
The OPRA open-interest snapshot timestamped August 4, 2026 ≈06:30 ET reflects the close of business August 3 — the definitive open-vs-close test we flagged when this published. Here is what it says.
| Leg | Baseline OI (Aug-3 snap) | Resolving OI (Aug-4 snap) | Δ | Print size | Δ as % of print | Verdict |
|---|---|---|---|---|---|---|
| Nov-20-2026 $120 call (bought) | 943 | 3,396 | +2,453 | 2,600 | ≈94.3% | ✅ OPEN (BTO) |
Verdict: a genuine new long call — the lottery-ticket read is confirmed. We predicted OI of ≈3,543 for a clean full open; it printed 3,396, meaning ≈94% of the block created brand-new contracts and roughly 147 contracts' worth changed hands between existing holders. That is a rounding error, not a story. BTO confirmed. Everything the August 3 article said about this trade — small, clean, opening, and a genuinely low-probability bet with all $1.52M at risk — stands unchanged.
🤓 What This Actually Means — Plain English
This reads as a BTO — bought to open — a fresh, standalone long call position, not part of a spread and not closing anything. Here's the translation:
- What they bought: The right (not obligation) to buy 260,000 shares of HOOD at $120 anytime up through November 20, 2026, for a total cost of $1.52 million.
- How far out of the money: The strike sits ≈31% above the $91.54 spot price at the time of the trade. For context, that's a much bigger reach than a typical earnings-play call, which usually sits 5–15% out.
- The math that matters — breakeven: This trade only turns a profit above $125.85 ($120 strike + $5.85 paid) by expiration. Below $120, it's a complete loss of the $1.52 million. Between $120 and $125.85, it's a partial loss.
- Odds: A call struck this far out of the money with roughly 3.5 months to run typically carries a real-world probability of finishing in the money somewhere in the 20–30% range, and a probability of reaching the $125.85 breakeven that's lower still. This is explicitly a low-probability, high-payoff bet, not a base-rate expectation.
- Delta / share-equivalent exposure: The package carries roughly +78,442 shares of directional exposure (2,600 contracts × ≈0.30 delta × 100) — meaningful leverage relative to the $1.52 million paid, but small in absolute share terms next to Robinhood's ≈853 million shares outstanding.
- Because it's a cross, the "buy" label is suggestive, not proof of conviction. A known counterparty sold these calls to this buyer off the open book. We can say someone now owns 2,600 November $120 calls; we cannot independently verify the counterparty's motive was to sell into weakness or that this was purely aggressive buying the way we could on a lit sweep.
- Bottom line on intent: Someone is willing to risk the full $1.52 million premium on a scenario where a stock that's been sliding all year suddenly reverses and rallies more than 30% in a little over three months. That's a speculative, asymmetric bet — think of it less like "buying the dip" and more like buying a call option on a turnaround story.
📈 Technical Setup / Chart Check-Up
YTD Performance Chart
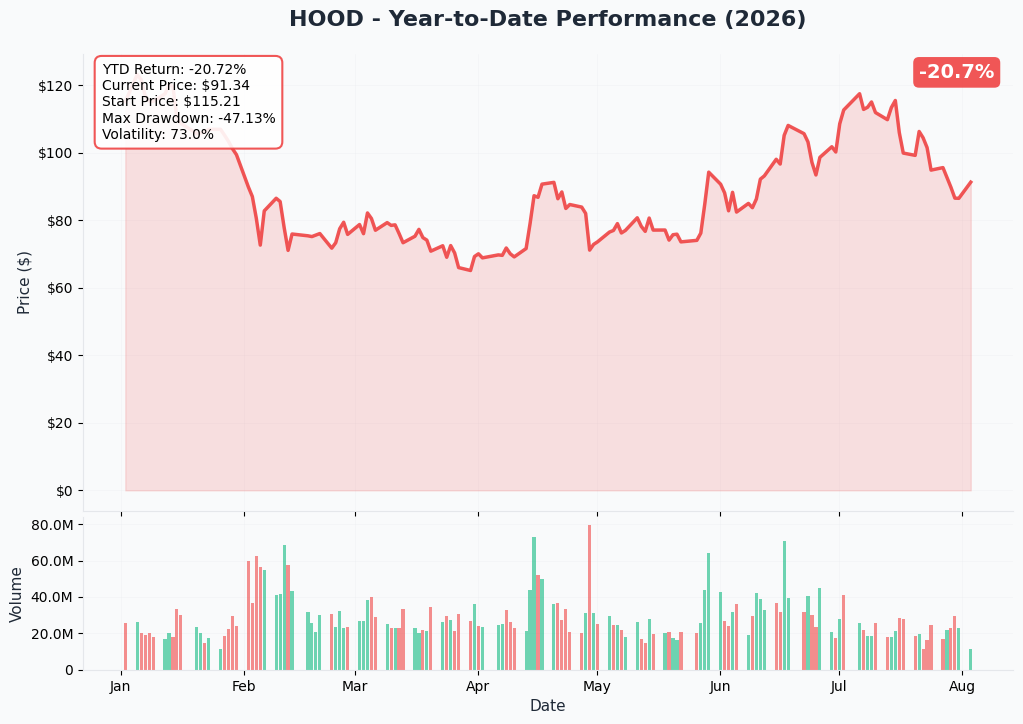
Robinhood is down ≈20.7% year to date — one of the worse performers among names we're tracking today, and the backdrop that makes this trade interesting. The stock has been sliding even as the underlying business kept growing (see catalysts below), which tells us the market has been pricing in something other than pure top-line growth — most likely concerns about slowing crypto activity and multiple compression after a hot run in prior years. Buying calls 31% above spot on a stock in a year-long downtrend is a bet that this slide is close to done, not a continuation trade.
Gamma-Based Support & Resistance Analysis
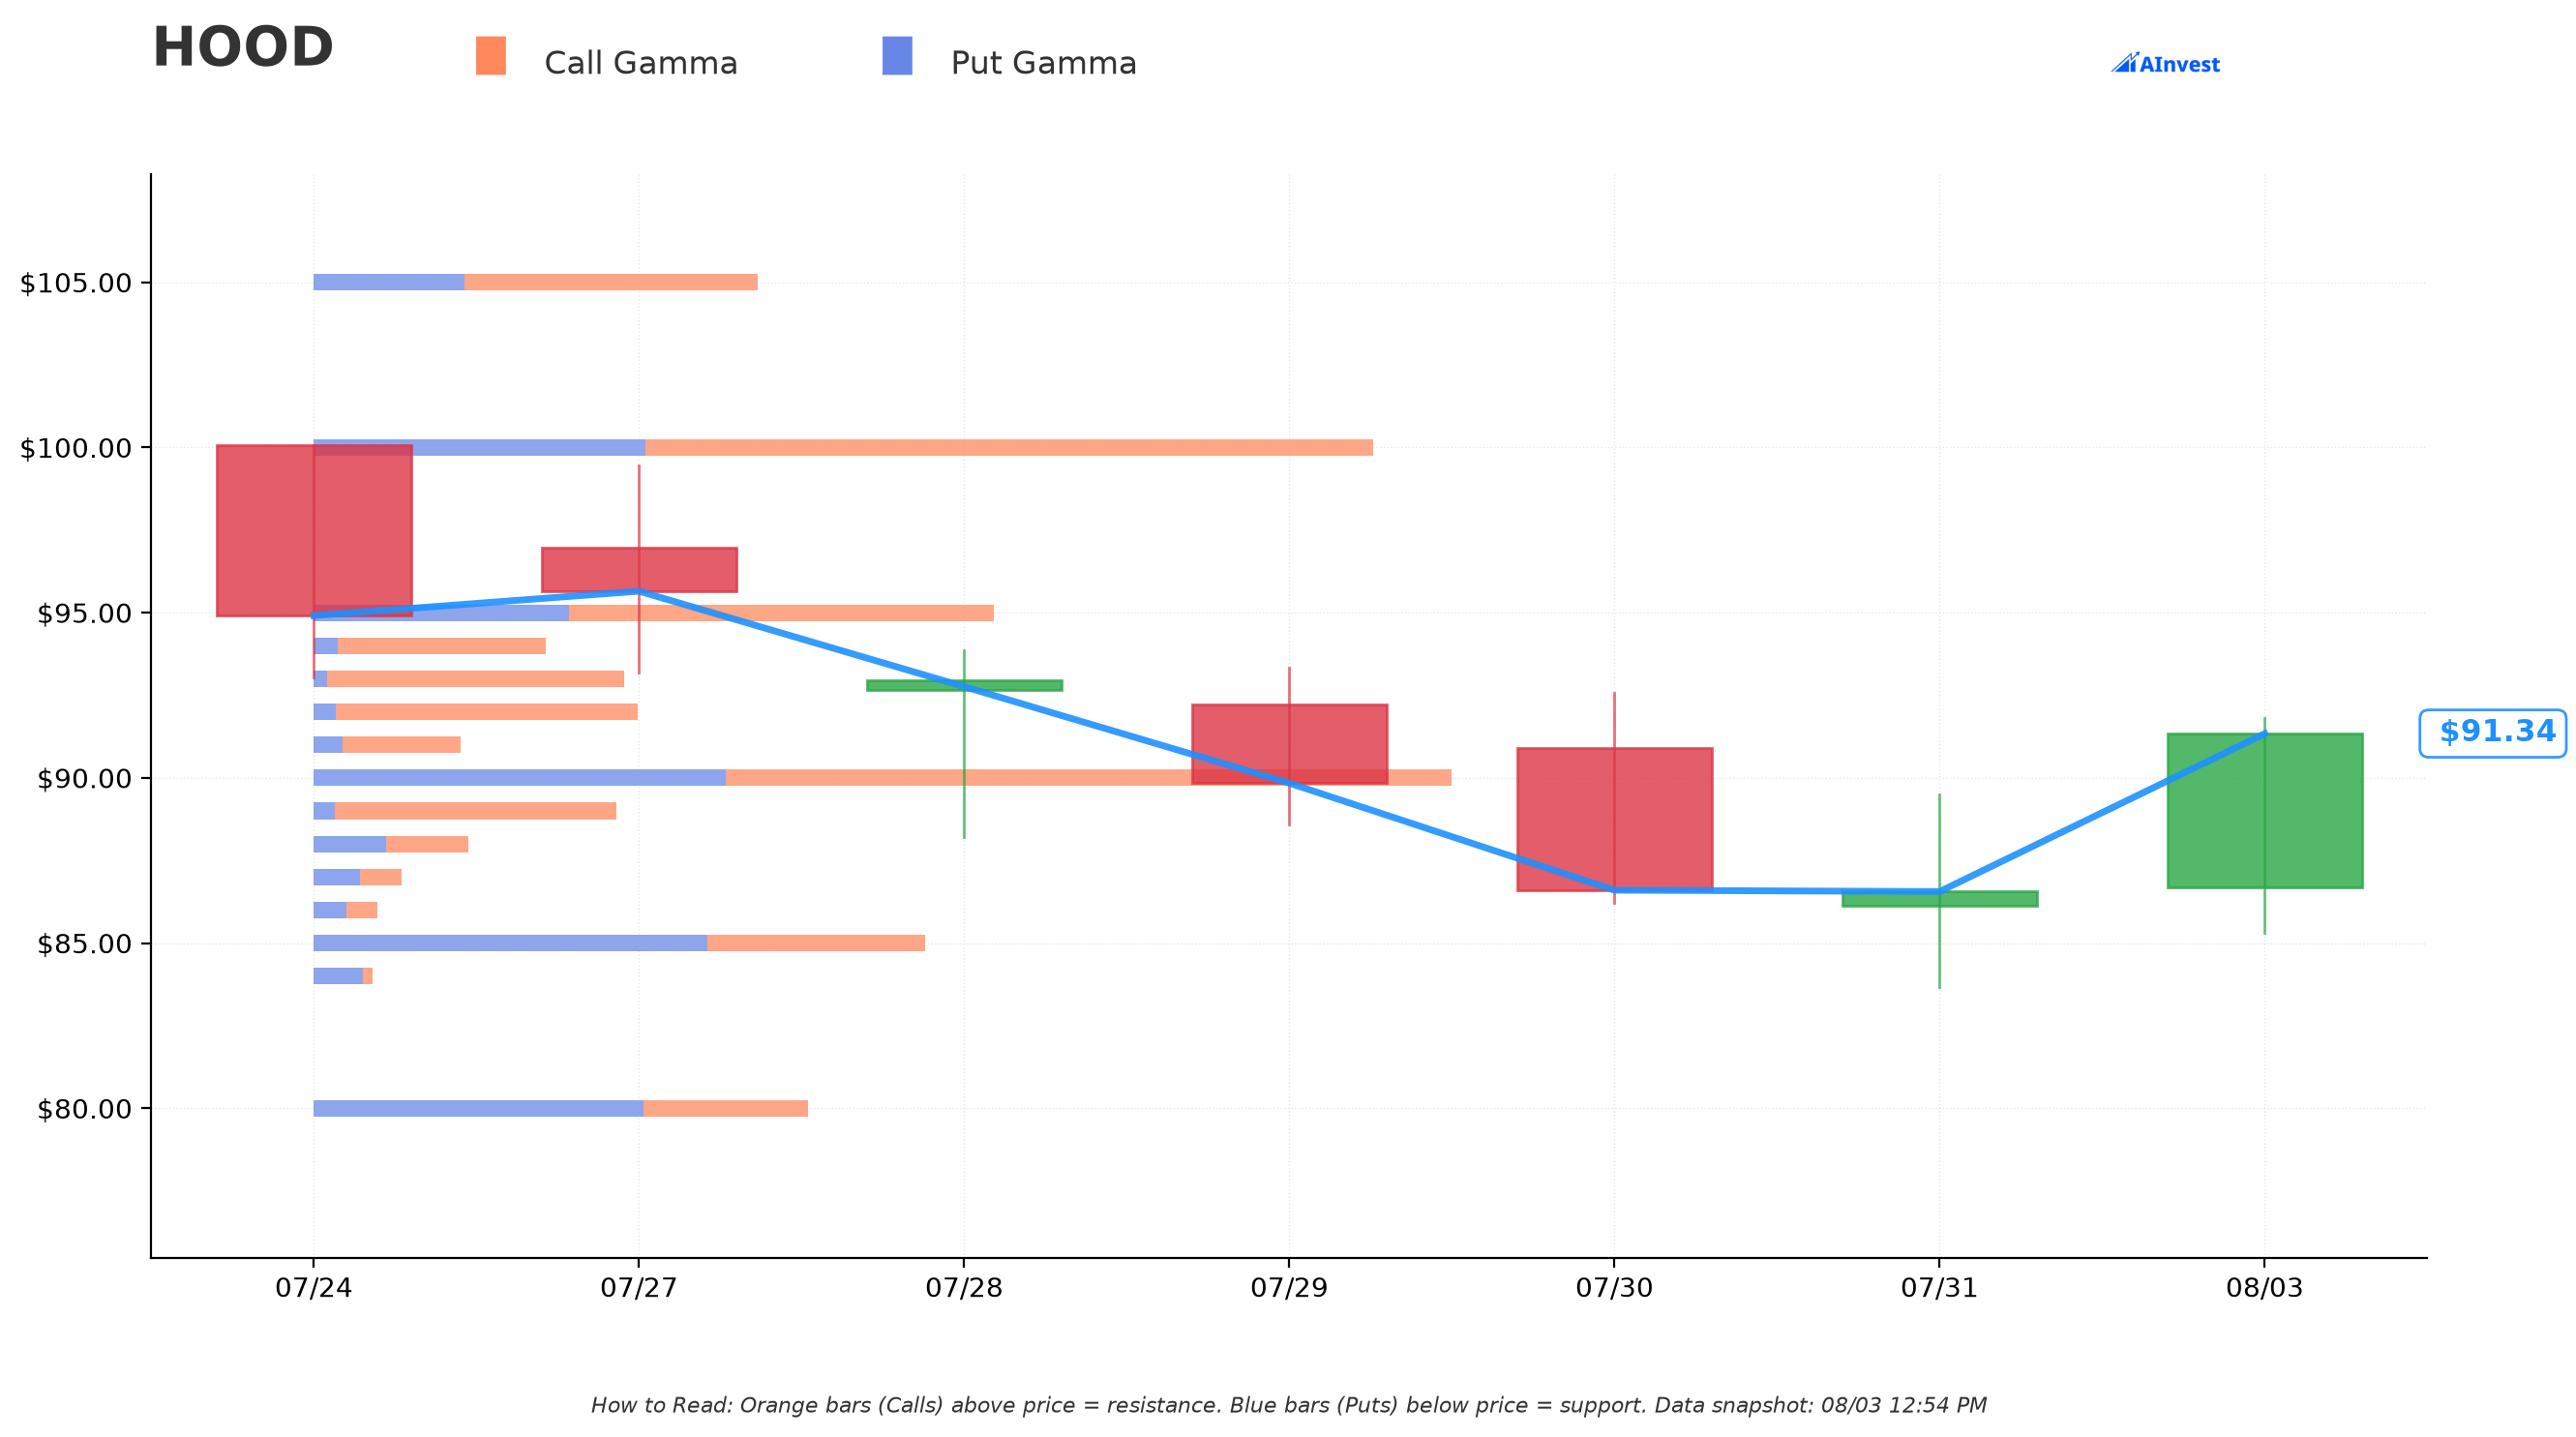
Spot at the print: $91.54 (essentially unchanged since — current levels are around $91.3).
🔵 Support Levels (Put/Net Gamma Below Price):
- $90 — Very Strong, ≈$14.3B total gamma exposure (the single strongest level on the board), just 1.4% below spot. This is the nearest floor dealers will defend.
- $85 — Strong, ≈$7.7B total gamma, 6.9% below spot.
🟠 Resistance Levels (Call Gamma Above Price):
- $95 — Strong, ≈$8.5B total gamma, only 4.1% above spot.
- $100 — ≈$13.3B total gamma, 9.6% above spot.
- $105 — ≈$5.6B total gamma, 15.0% above spot.
- $110 — ≈$5.5B total gamma, 20.5% above spot.
What this means for the trade: HOOD is pinned tightly between $90 support and $95 resistance right now — those two levels will dominate day-to-day chop. The important honest observation is what's missing: the $120 strike itself carries only ≈$4.4B of total gamma exposure ($3.7B of it call gamma) — noticeably thinner than every level between $90 and $110. That means dealers haven't built up much of a defensive wall out at $120 yet. If HOOD does start to run, there's comparatively little gamma-driven resistance between $110 and $120 to slow it down — but there's also no dealer positioning helping to "pin" or attract price up there. It's a gap, not a magnet.
Implied Move Analysis
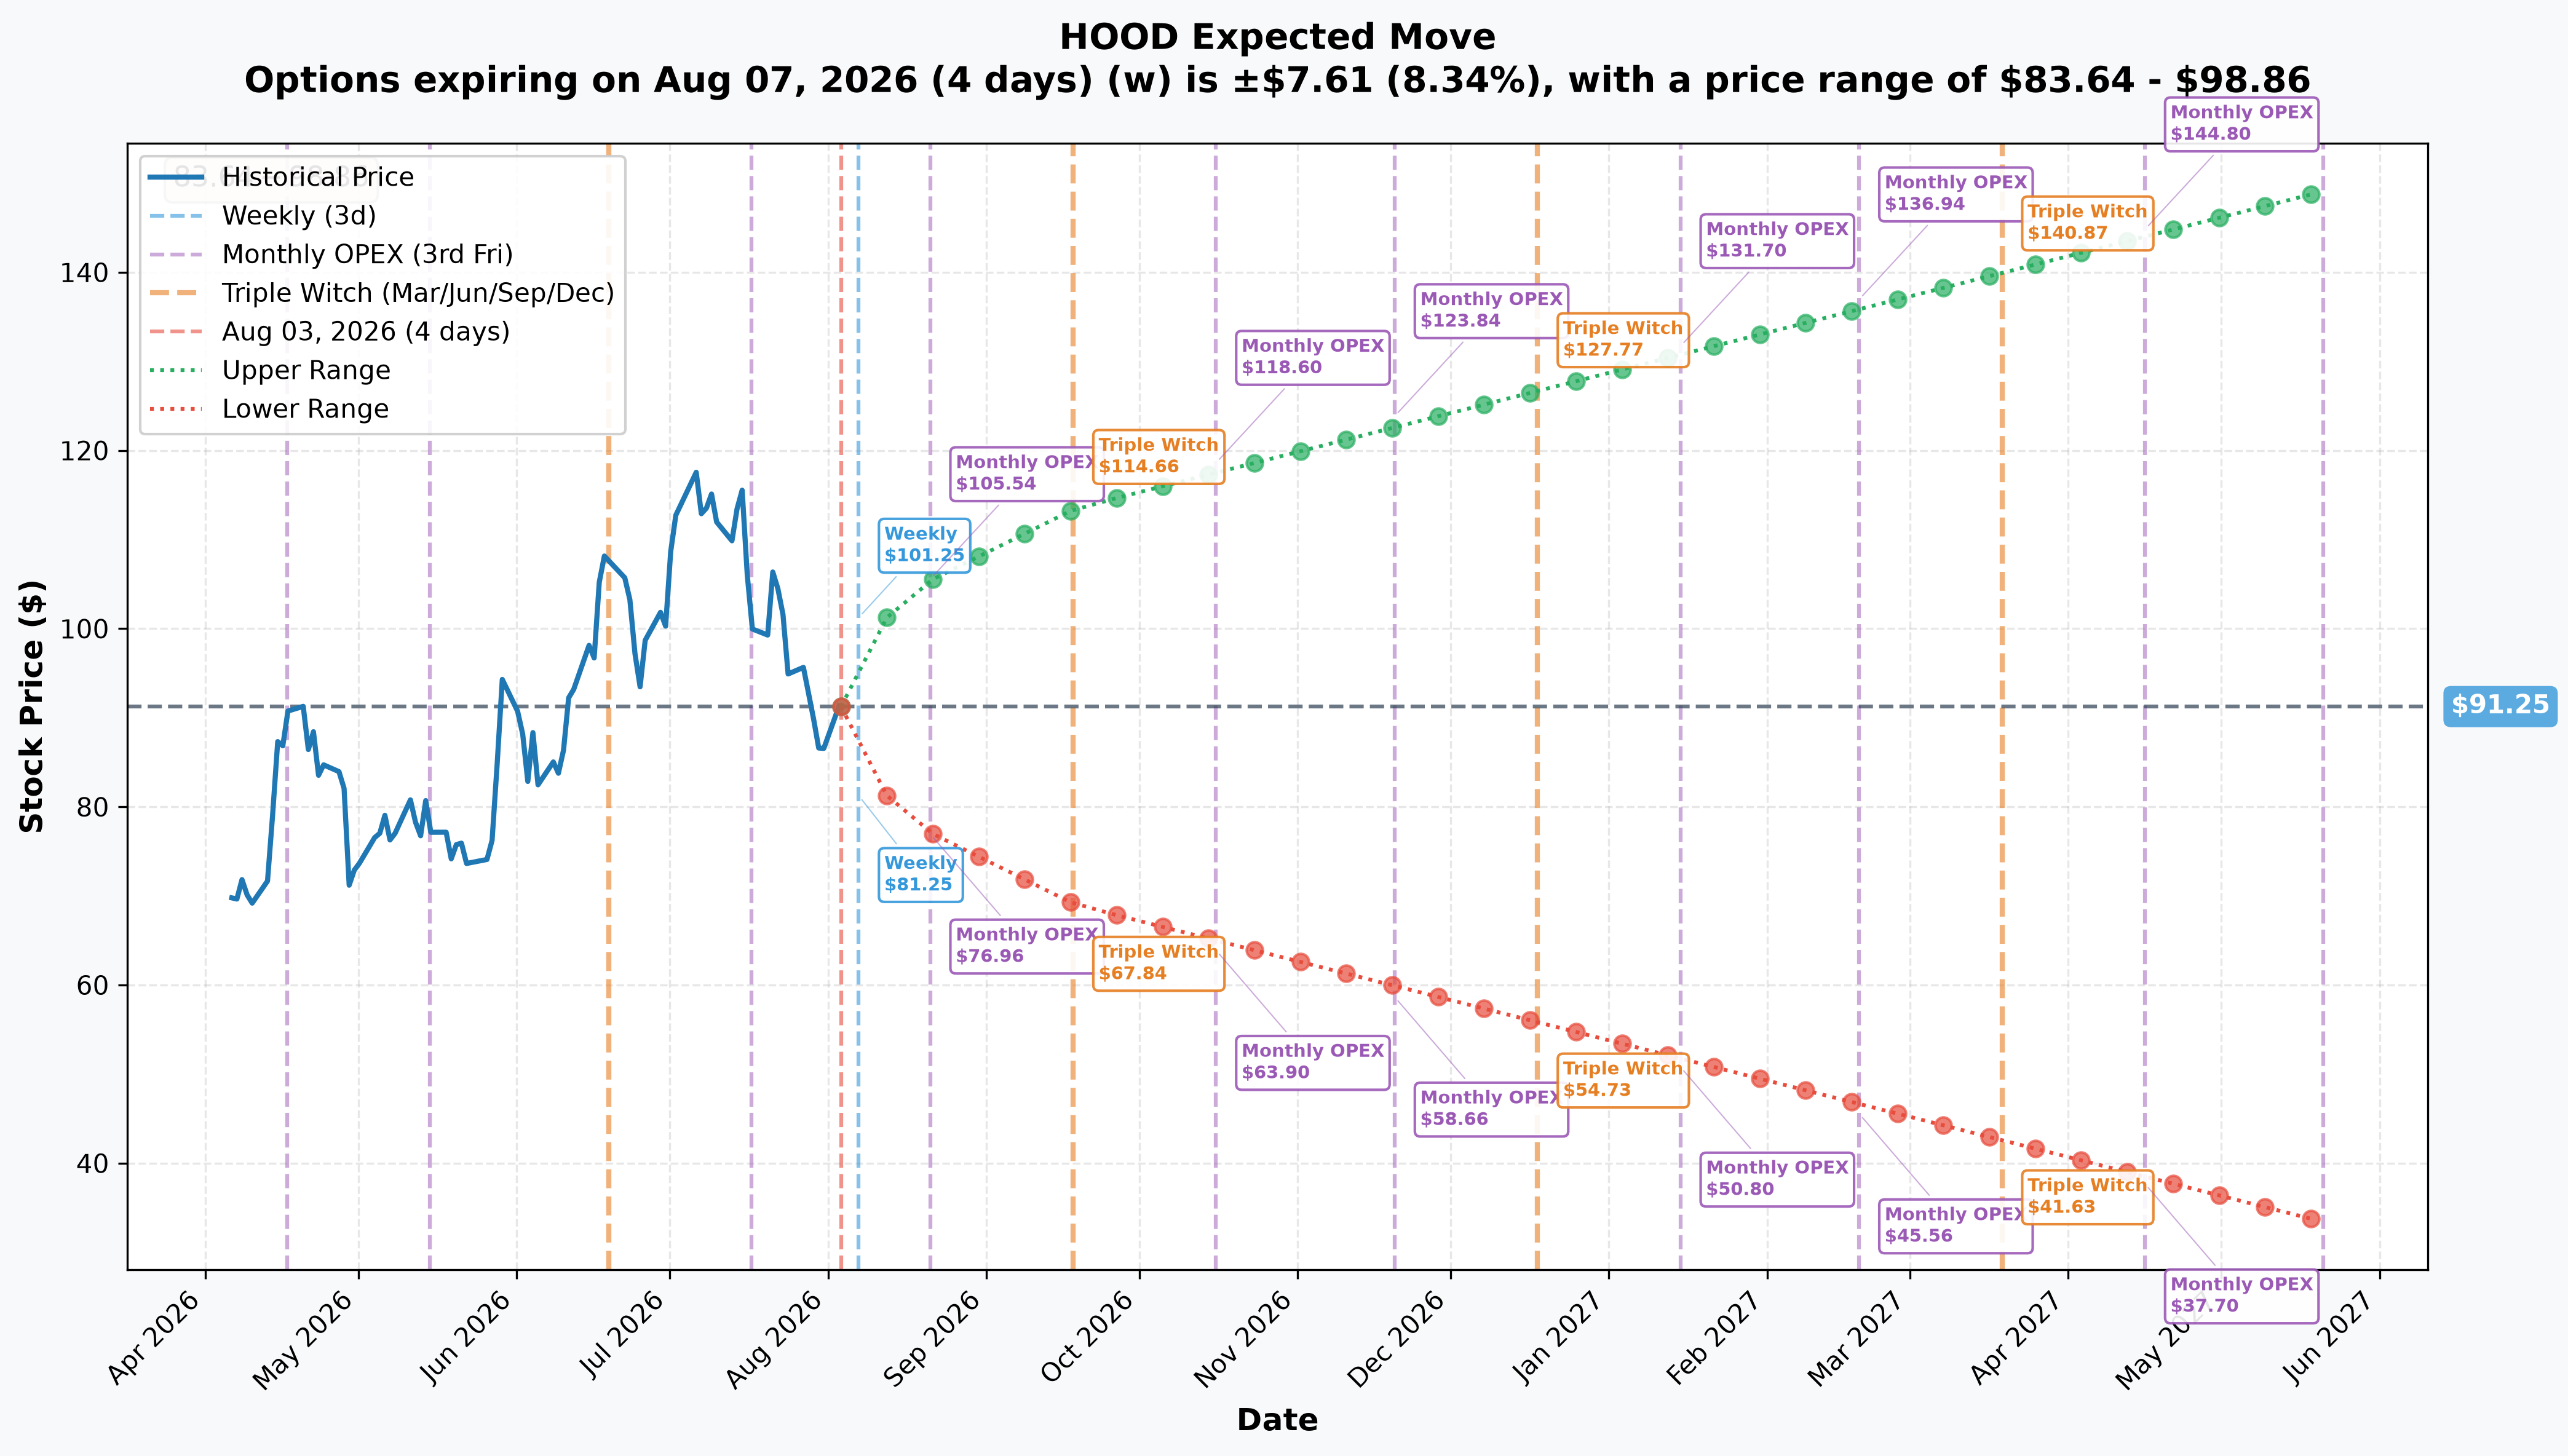
Options market pricing across expirations (from the current $91.28 mark):
- 📅 Weekly (Aug 7 — 4 days): ≈±8.3% (±$7.61) → range $83.64–$98.86
- 📅 Monthly OPEX (Aug 21 — 18 days): ≈±15.7% (±$14.29) → range $76.96–$105.54
- 📅 Quarterly Triple Witch (Sep 18 — 46 days): ≈±24.4% (±$22.25) → range $69.00–$113.50
- 📅 November OPEX (Nov 20 — this trade's expiration, 109 days): the chart's cone marker for this date shows a range of roughly $58.66–$123.84
Does the cone even reach $120? Barely — and that's the key honest point. The upper edge of the market's own implied-move range for November 20 sits at ≈$123.84, which is just above the $120 strike. So the options market is not pricing this move as impossible — a rally into the mid-$120s is within the priced-in range of outcomes. But look closer: this trade's breakeven is $125.85, which sits above even that generous upper bound. In other words, the implied-move cone reaches the strike, but it doesn't comfortably reach the price where this specific trade actually turns a profit. That's a razor's-edge bet by the market's own pricing, not a comfortably-in-range one.
🎪 Catalysts (Mapped to the November 20, 2026 Expiry)
Already happened — Q2 2026 earnings, July 29, 2026 (5 days before this trade, inside the window this position will live through until November):
Robinhood reported Q2 2026 results showing total net revenues of $1.31 billion, up 32% year over year, with net income of $573 million (up 48%) and diluted EPS of $0.62. The composition of that growth is exactly why the stock can be both growing fast and down 20.7% YTD:
- 🎲 Prediction markets are the real growth story. Event-contract revenue surged more than 10x year over year to $156 million, on 13.6 billion contracts traded. Robinhood's own Rothera exchange, a CFTC-licensed exchange and clearinghouse, has now cleared more than 3.5 billion contracts — a structural bet that this business keeps compounding through the Nov-20 expiry and beyond.
- 📉 Crypto is the drag, and it's the piece most tied to price action. Crypto revenue fell 38% year over year to $100 million, and Robinhood App crypto notional volume was down 35% YoY to $18 billion (versus $22 billion on Bitstamp). Robinhood's retail crypto business is directly levered to crypto prices and retail risk appetite — when crypto cools, this line cools with it, and that appears to be a real piece of the YTD decline.
- 💳 Options and equities trading are strong. Options revenue was $342 million (up 29%), and equities revenue nearly doubled to $129 million (up 95%) — both signs retail risk appetite in traditional products is intact even as crypto softened.
- 🏆 Gold subscriptions keep compounding. Robinhood Gold subscribers grew 39% year over year to 4.8 million, with ARPU up 24% to $187. Funded customers reached 28.4 million and total platform assets hit $369 billion.
- 💵 Net interest revenue, the rate-sensitive line, grew a more modest 9% to $389 million. This is the piece most exposed to the Fed's rate path between now and November — a faster-than-expected pace of rate cuts would pressure this revenue stream further, while a pause would help it.
- 🌍 International expansion is real but still early. Robinhood's international funded customers surpassed 1 million, the WonderFi acquisition in Canada closed, the company received a capital markets services license in Singapore, and Stock Tokens are now live in 120+ countries. None of this moves the needle on Q3/Q4 revenue yet, but it's the long-duration bull case a 31%-OTM, 3.5-month call is implicitly leaning on.
Ahead of the November 20 expiry — Q3 2026 earnings: Robinhood has not yet announced an exact Q3 2026 report date; based on its historical cadence (Q2 landed July 29), a late-October or early-November report is the reasonable expectation, which would land before this call expires. That earnings print — and specifically whether crypto revenue stabilizes and event-contract growth continues — is the single most likely catalyst that could make or break this position.
Analyst backdrop: Wall Street's consensus rating on HOOD is Buy, with a consensus price target of $125.08 — notably almost exactly this trade's $125.85 breakeven. Targets range from a high of $170 (JMP Securities) to a low of $65 (Keefe, Bruyette & Woods), and the most recent updates (Cantor Fitzgerald, Goldman Sachs, Citizens, dated July 30–August 3) averaged around $129. The spread between $65 and $170 tells you how unsettled the Street is on where crypto-linked, prediction-market-heavy Robinhood should trade from here — which is itself a reason to treat any single price target, bullish or bearish, with caution.
🎲 Four Ways to Read This Trade
🎰 YOLO Trader
If you want to mirror the structure cheaply: the November 20 $120 calls are the exact contract, priced around $5.85 (verify the live quote before entering). Understand you're buying a coin flip on a coin flip — HOOD needs to not just stabilize but actually rally over 30% in ≈3.5 months, and the analyst consensus target ($125.08) is right at your breakeven, meaning even "the Street being roughly right" barely gets you to even. Size this at money you can lose entirely — most bets like this expire worthless.
📊 Swing Trader
The more interesting read isn't "copy the $120 calls" — it's the gamma map. HOOD is boxed between $90 support and $95 resistance right now. A break and hold above $95–$100 with volume would be the technical signal that a move toward the thinner gamma zone above $110 is plausible; a break below $90 (Very Strong support) would argue the YTD downtrend isn't over. Consider a closer-to-the-money call (or call spread) into the $95–$105 zone rather than reaching all the way to $120, which requires a much bigger move to pay off.
💰 Premium Collector
This entire trade is a reminder of what premium sellers are being paid to take the other side of: someone will pay real money for a coin-flip-squared shot at a 31% rally. If you have a neutral-to-mildly-bullish view on HOOD into November, selling cash-secured puts around the $80–$85 gamma support zone, or writing covered calls above $100–$105 resistance if you're long shares, lets you collect premium against levels the gamma map already tells you dealers are defending — a more probability-favorable way to express a similar market view.
🌱 Beginner
The single most important number in this whole article is $125.85 — that's the breakeven. Everything below that price at expiration means this specific trade loses money, and below $120 it's a total loss of premium. Before you ever buy a call this far out of the money, ask: "What has to be true about the world for this stock to rally 30%+ in three and a half months?" If you can't answer that with a specific, falsifiable reason (not just "it's cheap" or "someone else bought it"), it's a lottery ticket, not an investment thesis. That's not a criticism of the trader who did this — it's a reminder that a single $1.52 million options print, however clean the tape looks, is not a signal you should follow blindly.
⚠️ Honest Risk Factors & What the Tape Cannot Prove
- Most far-OTM calls expire worthless. A call struck 31% out of the money with ≈3.5 months to run statistically fails to reach its strike, let alone its breakeven, more often than not. Treat any "X% probability" framing as an estimate, not a guarantee.
- We cannot prove motive. Because this printed as a negotiated cross, we know a broker matched a known buyer and seller off the lit book — we do not know why. It could be a directional bet, a partial hedge against a short position we cannot see, or a tax/financing trade dressed up as a simple long call. The tape shows us the position, not the reasoning behind it.
- Size is genuinely small. At $1.52 million, this is the smallest flagged trade on today's board. Do not read outsized conviction into it just because it's clean — clean and large are different things, and this is clean but small.
- The next-day OI print could complicate the "opening" read. While size (2,600) clearly exceeded prior OI (943), the exact magnitude of the OI increase (we're forecasting ≈943 → ≈3,543) is not proven until the next session's pre-market snapshot lands. A smaller-than-expected increase would mean some of today's volume was existing holders trading with each other, not entirely fresh money.
- Robinhood's own business is unusually exposed to sentiment. Crypto and event-contract revenue are both tied to retail risk appetite and market volatility, which cuts both ways — a hot market helps this trade, a risk-off shift hurts both the stock and the odds this call pays off.
- What OPRA cannot tell us: the counterparty's identity, whether either side has an offsetting hedge elsewhere (stock, futures, or another options position we can't see), the broker/MMID, or whether this position gets adjusted, rolled, or closed before expiration. We only know what printed.
Disclaimer: Options trading involves substantial risk of loss and may not be suitable for all investors. This analysis is for educational purposes only and is not financial advice. A single $1.52 million options trade — even a clean, tape-proven one — is not evidence of superior information; most far-out-of-the-money calls expire worthless. Always size positions you can afford to lose in full, and consider consulting a licensed financial advisor before trading.
About Robinhood Markets: Robinhood is a diversified retail financial services platform offering equities, options, futures, cryptocurrency, and prediction-market trading alongside retirement accounts, cash sweep products, and advisory services, with a market cap of ≈$77.8 billion in the securities brokers, dealers & flotation companies industry.
Last updated: August 4, 2026 — next-day OPRA open-interest resolution added (✅ RESOLVED box above). Original analysis published August 3, 2026.