🤝 INTC $17.9M Deep-ITM Call Block Cross — RESOLVED: It Was a Trim, Exactly as the OI History Suggested
✅ Updated 2026-08-06 pre-market — the genuinely unresolved question is now answered, and the "trim" read was right. We published the test: OI falling by ≈5,000 means a close/trim, OI rising by ≈5,000 means a genuine new short. Open interest fell 83,141 → 78,127, down 5,014 against a 5,000-lot print — a ≈100.3% match. This was an existing long-call holder selling part of the position built in late July, not someone opening a fresh short. See the ✅ RESOLVED box below.
📅 August 5, 2026 | 🔥 Unusual Activity Detected
🎯 The Quick Take
At 09:48:17 ET, a desk sold 5,000 Intel November-20-2026 $70 calls for $35.75 each, collecting $17,875,000 in one negotiated print — with the stock trading at $101.74 at the moment of the trade. The tape proves this was a block cross, not a lit sweep, and it printed right at the bid, which fits a seller. What the day's tape could not prove was whether this was a fresh short position or a trim of a much larger position built just one week ago. The next-day open interest answered it: a trim. The strike lost 5,014 contracts against the 5,000-lot print, confirming an existing long-call holder selling out rather than a new short being opened.
🏢 About Intel (INTC)
Intel is a leading digital chipmaker focused on designing and manufacturing microprocessors for the global personal computer and data center markets, spanning the Semiconductors & Related Devices industry. Market cap runs ≈$515.7B by StockAnalysis's count (5.04B shares × $102.24), though StockTitan's separate figure of ≈$459.0B at a slightly lower $100.94 print doesn't fully reconcile with that share count — worth flagging rather than picking one silently. Intel is also the name at the center of a confirmed U.S. government equity stake (size and terms not yet public), one of roughly 30 companies now carrying a government position, according to coverage surfaced on MarketBeat's INTC news page.
💰 The Option Flow Breakdown
📊 What Just Happened — Full Trade Table
Spot at print: $101.74
| Time (ET) | Buy/Sell | Call/Put | Expiration | Strike | Size | Option Price | Premium | Volume | Prior OI | Spot | Option Symbol |
|---|---|---|---|---|---|---|---|---|---|---|---|
| 09:48:17 | SELL | CALL | 2026-11-20 | $70 | 5,000 | $35.75 | $17,875,000 collected | 5,000 | 83,141 | $101.74 | INTC20261120C70 |
An earlier reported figure for this print rounded up to ≈$18M; the tape-computed number — 5,000 contracts × $35.75 × 100 — is the precise $17,875,000.
Mechanism — proven from the tape, not inferred: this printed as a single-leg block cross — a broker matched a known buyer and known seller and printed the block off the open order book. It landed at 0% across the bid-ask spread, meaning it filled right at the bid. That's consistent with a seller getting hit, but on a cross there's no live aggressor in the lit-market sense — a counterparty had already agreed to the price before it printed. This is negotiated position management, not a sweep, and it does not get the 🌋 "aggressive" framing.
✅ RESOLVED — the OI Print Confirms the Trim
Updated 2026-08-06 pre-market. The ≈06:30 ET OPRA open-interest snapshot (reflecting the August 5 close) has published.
| Leg | Baseline OI (Aug-5 snap) | Resolving OI (Aug-6 snap) | Δ | Print size | Δ as % of print | Day vol | Verdict |
|---|---|---|---|---|---|---|---|
| Nov-20-2026 $70 C (sold 5,000) | 83,141 | 78,127 | −5,014 | 5,000 | ≈−100.3% | 5,056 | ✅ CLOSE / TRIM (STC) — as inferred |
We published the two branches: OI down ≈5,000 means a close/trim, OI up ≈5,000 means a genuine new short. It fell by 5,014 — within 14 contracts of a perfect one-for-one close, on a day when only 5,056 contracts traded at the strike in total. There is essentially no residual ambiguity: the seller was retiring long calls it already owned.
This vindicates the open-interest history as evidence. The article argued the trim was the stronger read because the position was built in a single burst in late July (8,354 → 73,263 on July 28, then up to ≈83,100) and had sat untouched since. A brand-new short seller arriving at a strike someone else had just built, in exactly the size that then vanished from open interest, was always the less likely story. The data agreed.
What it still does not prove. Open interest confirms contracts were extinguished; it cannot tell us the seller's cost basis, whether this was profit-taking or risk reduction, or whether the remaining ≈78,000 contracts belong to the same holder. A cross has a known counterparty, but not a known identity.
⭐ The Open-Interest History — Why "Trim" Is the Stronger Read (but Still Unproven)
This is the part of the story that matters more than the headline premium. Pulling the open-interest history on the Nov-20 $70 call strike shows a position that didn't exist in size two months ago suddenly getting built in the last week of July:
| Date | Nov-20 $70C Open Interest | Change |
|---|---|---|
| May 15, 2026 | 8,216 | — |
| July 28, 2026 | 73,263 | +64,909 |
| July 29, 2026 | 83,059 | +9,796 |
| August 5, 2026 (today, pre-trade) | 83,141 | — |
Someone built roughly 75,000 contracts at this strike in a two-day window right after Intel's July 23 Q2 earnings report — and today's 5,000-lot sale is only ≈6% of that position. The size is small relative to the pile, which leans toward "partial trim of an existing position" rather than "brand-new conviction short." But that is an inference, not proof. We did not independently verify which side (long or short) built the late-July position, and a 5,000-lot sale that small below OI is also fully consistent with a new short being layered on top by a different desk. Grade this INFERRED, medium confidence — not a settled fact.
🤓 What This Actually Means — Plain English
Selling a deep in-the-money call is a very different animal from selling an at-the-money or out-of-the-money call. The $70 strike is $31.74 below today's $101.74 spot, so $31.74 of the $35.75 premium is pure intrinsic value — money the option is worth just for existing. Only $4.01 per share is actual time value, the part the seller is really being paid for.
Delta on this contract runs 0.8543, which means the position behaves almost like stock. Multiply it out: 5,000 contracts × 100 shares × 0.8543 delta = ≈427,150 shares of directional exposure sold short synthetically. That's the size of a mid-cap equity block, wrapped inside an options trade.
Why the "trim vs. new short" distinction matters so much here: if this is a trim, the seller already had a huge short-call position on (from the late-July build) and is simply taking a small slice of profit or risk off the table — a routine position-management move, not a fresh bearish signal. If it's a new short, someone just put on ≈427,150 shares of downside-leaning exposure on a stock that's already run +510% year-to-date and is showing its first cracks (two analyst downgrades in the last week, price below its 50-day average). Both stories are plausible from a single 5,000-lot print below OI — that's exactly why we can't over-assert here.
One more honest limit: OPRA data never shows us who's on either side of a cross — no broker, no customer identity, no way to see whether there's an offsetting stock or futures hedge sitting off-tape. We're reading size, price, and OI history — nothing more.
🎪 The Catalyst Context
Already happened
Intel's Q2 2026 earnings landed July 23 and were a genuine beat: revenue of $16.13B (+25.2% YoY) against a $14.43B estimate, non-GAAP EPS of $0.42 versus $0.21 expected — a $0.21 beat, according to MarketBeat's earnings page. GAAP gross margin snapped back to 40.4% from 27.5%, and StockTitan's coverage shows Data Center & AI up 59% to $6.3B and Intel Foundry up 31% to $5.8B. That print is almost certainly what triggered the late-July surge in open interest on this exact $70 call strike.
Upcoming
- Q3 2026 earnings — ESTIMATED around October 22, 2026 (after market close), per MarketBeat — this date has not been confirmed by Intel IR. It matters directly to this trade: October 22 sits inside the Nov-20-2026 expiry, so whoever holds this position (long or short) is carrying it through the next earnings print. Guidance already on the books is $15.8–16.8B revenue and $0.38 EPS.
- External foundry customer conversions — MarketBeat frames this as the single largest un-priced catalyst: a named large-logic customer signing on to Intel's foundry would validate the $5.8B/quarter Foundry run-rate as real external growth rather than internal transfer pricing. Status: discussed, not confirmed.
- 18A yield trajectory — analysts cite "potentially improving yields" as a support factor, with more detail likely at the Q3 call, per MarketBeat.
- U.S. government equity stake follow-through — the position is confirmed to exist as of an August 5, 2026 report surfaced on MarketBeat; any disclosed terms, additional tranches, or program expansion is headline risk in both directions.
The setup right now
Intel is +510.2% year-to-date, per StockAnalysis — that context is essential to reading any options flow here. But the run is already fading: spot sits below the 50-day moving average of $111.55 and ≈28% under the 52-week high of $142.35. The two most recent analyst actions are both downgrades — Zacks Research on July 31 and Daiwa Securities on August 4, both moving from Strong-Buy to Hold. Consensus sits at Hold, and MarketBeat's average target of $107.93 is only ≈6% above spot — a modest, unenthusiastic bar for a stock that's more than sextupled this year.
📈 Technical Setup / Chart Check-Up
YTD Chart
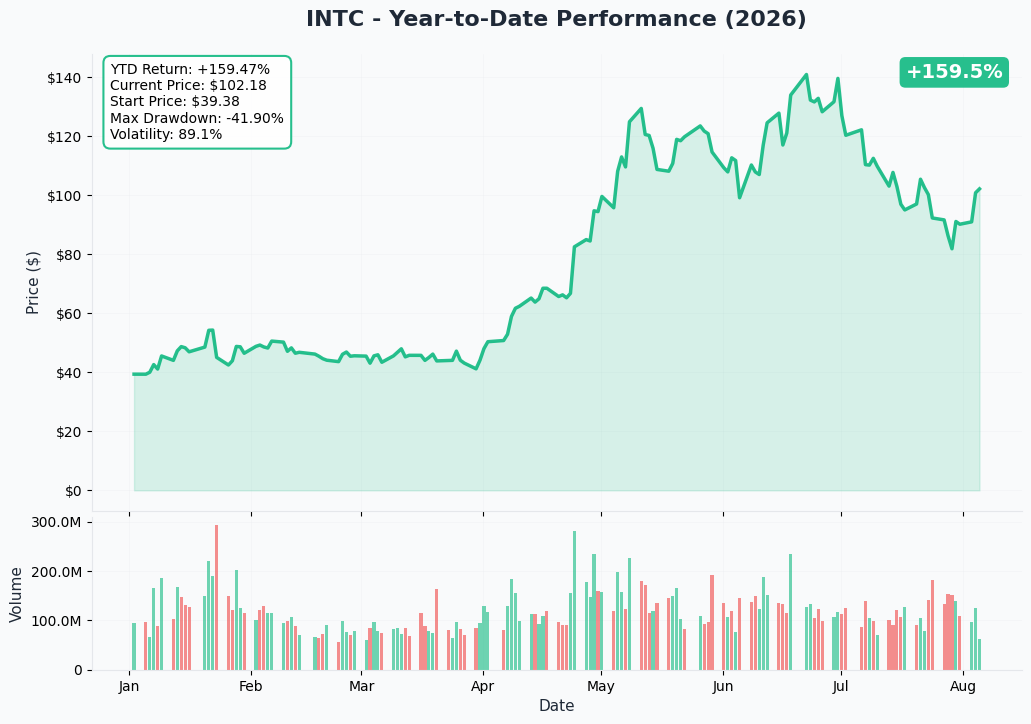
The chart tells the +510% story on its own — an extraordinary run off a depressed base, now digesting well below its 52-week high.
Gamma-Based Support & Resistance
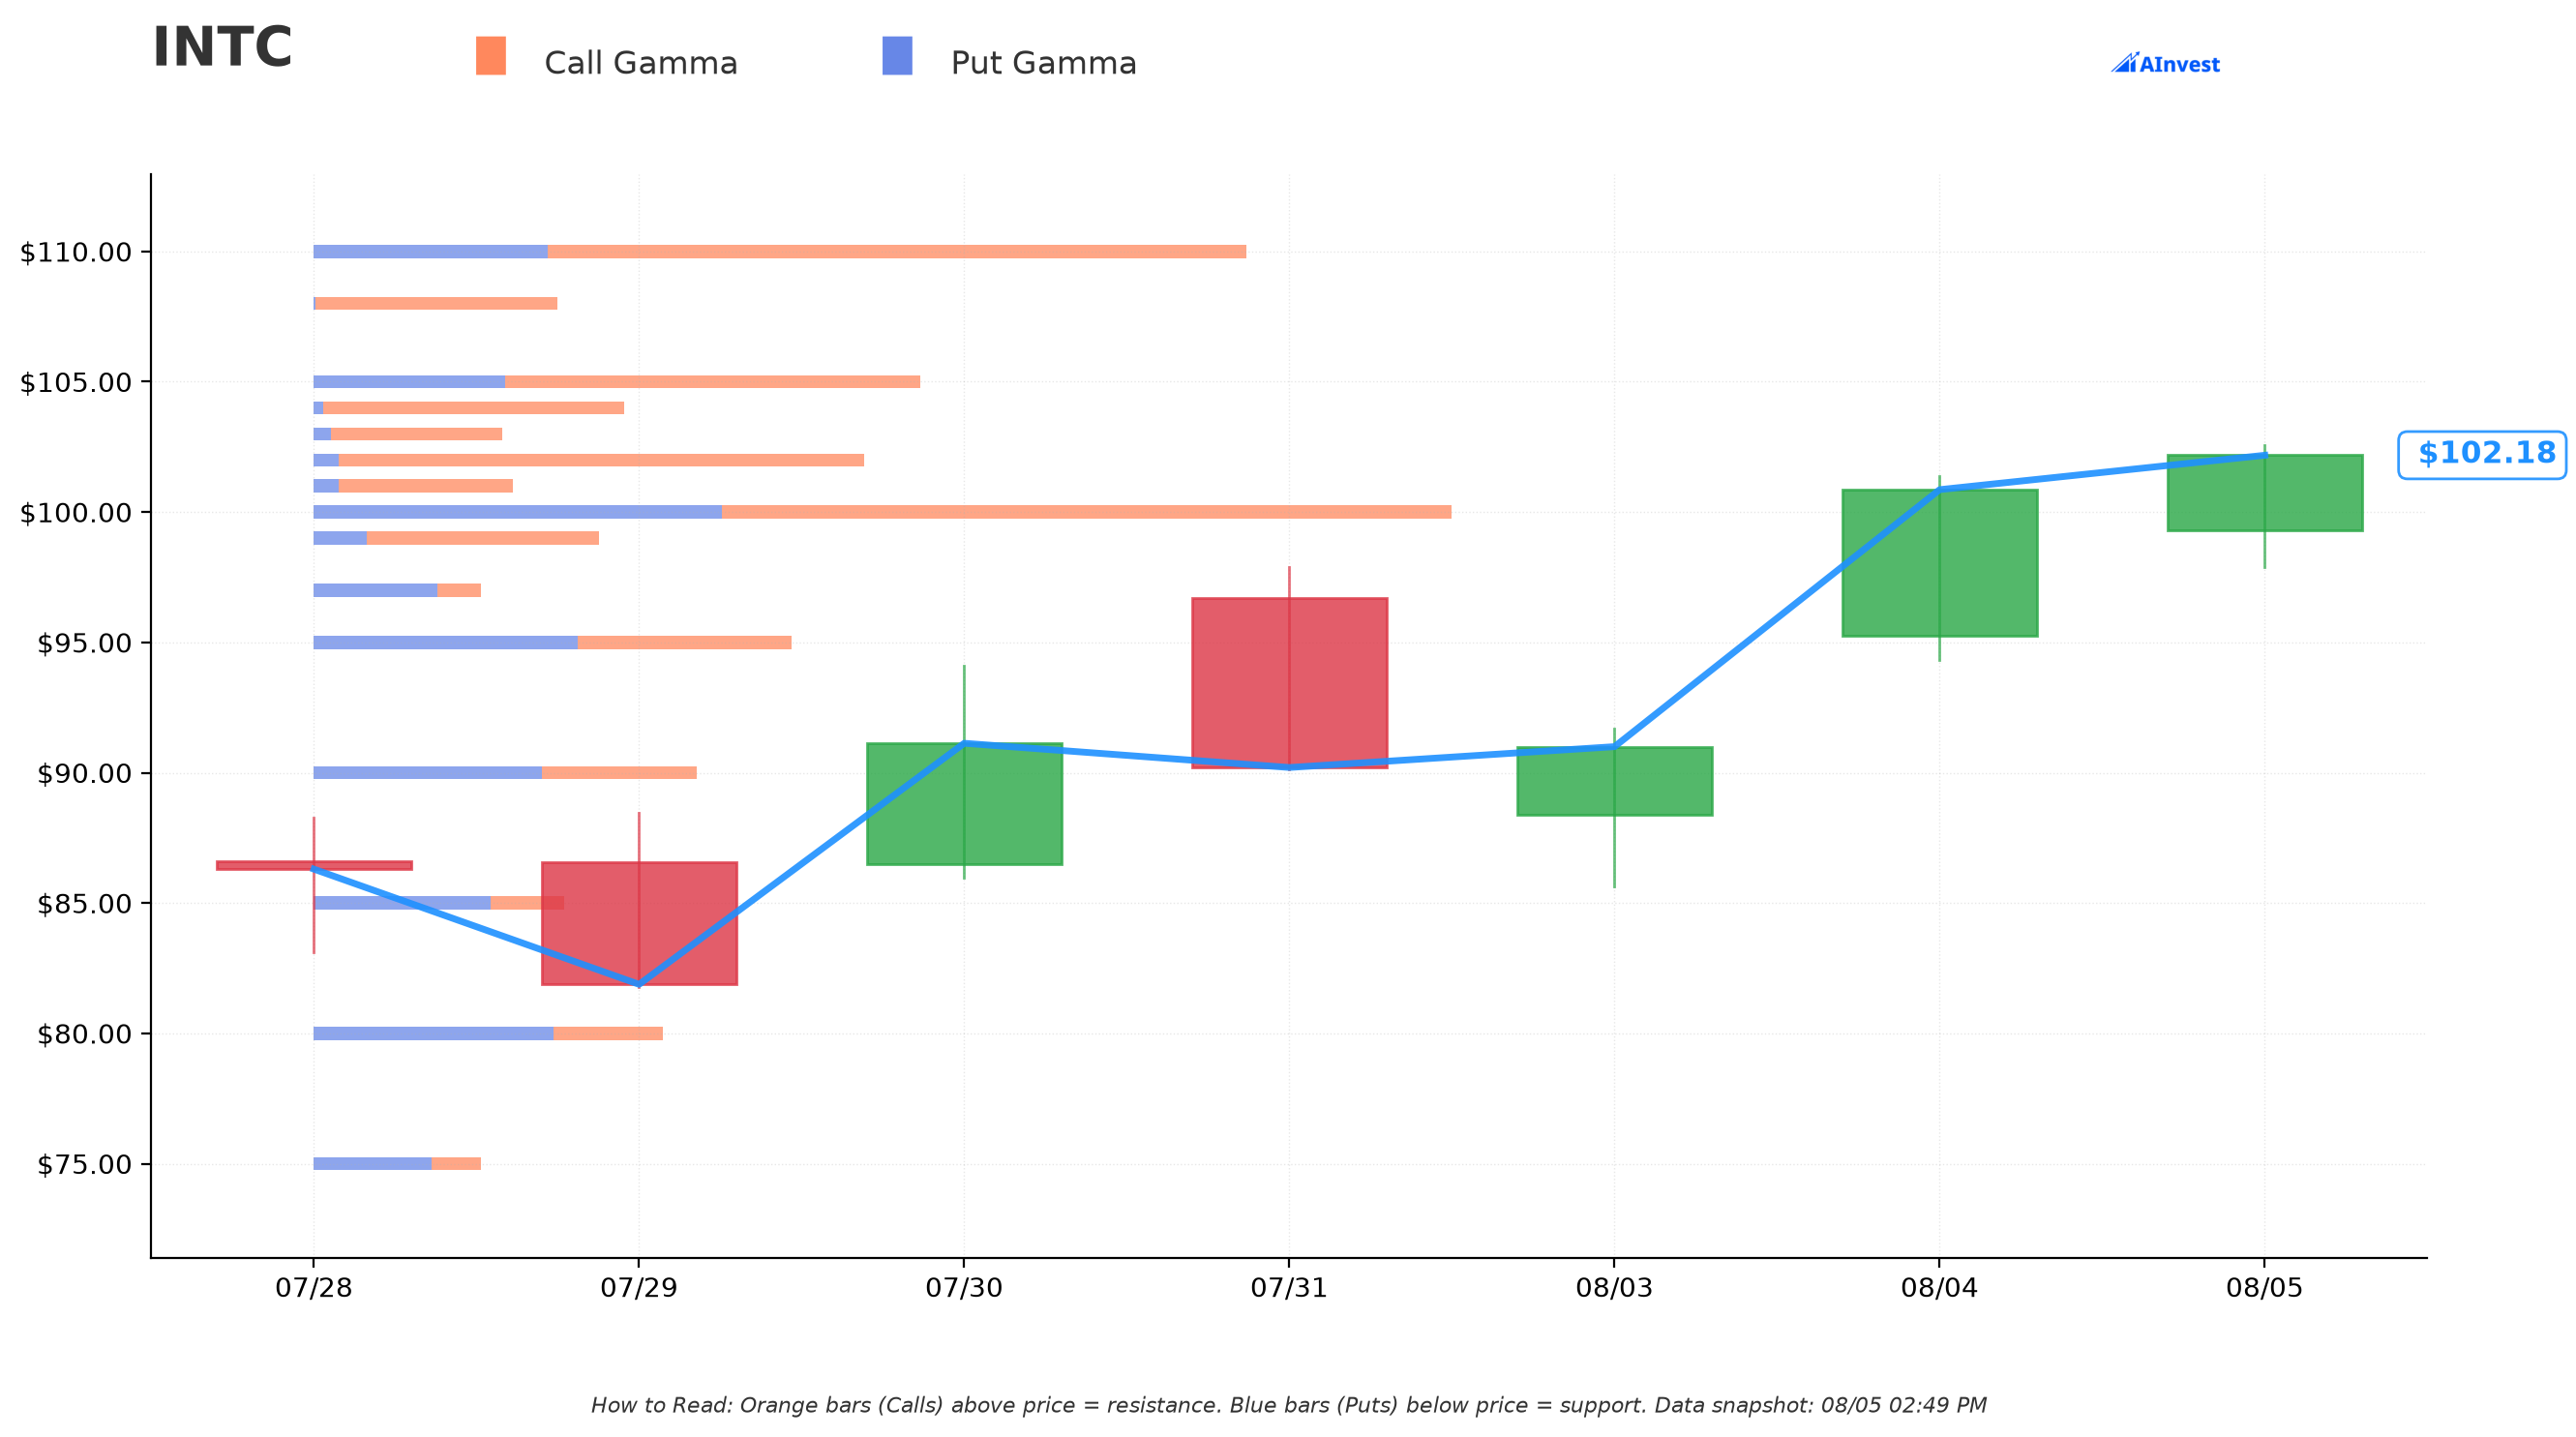
Reading dealer gamma exposure by strike (spot ≈$102.2 at the gamma snapshot):
- 🔵 Put Wall (support): $100 — the heaviest put-side gamma concentration below spot, "Very Strong" strength, just ≈2.2% below current price.
- 🟠 Call Wall (resistance): $110 — the heaviest call-side gamma above spot, also "Very Strong," ≈7.6% above current price.
- 🎯 Immediate pin risk: $102 — the strike closest to spot (≈0.2% away) carries a large, almost entirely call-side gamma cluster, which can act as a magnet in the very short term.
- Secondary resistance sits at $105 (≈2.7% away) and $120 (≈17.4% away) — a stack of overhead call walls the stock would need to work through to threaten new highs.
None of this directly touches the $70 strike sold today — that strike is deep below every gamma wall on the board, which is exactly what you'd expect from a position built for intrinsic value and time decay rather than a bet tied to near-term dealer-hedging mechanics.
Implied Move
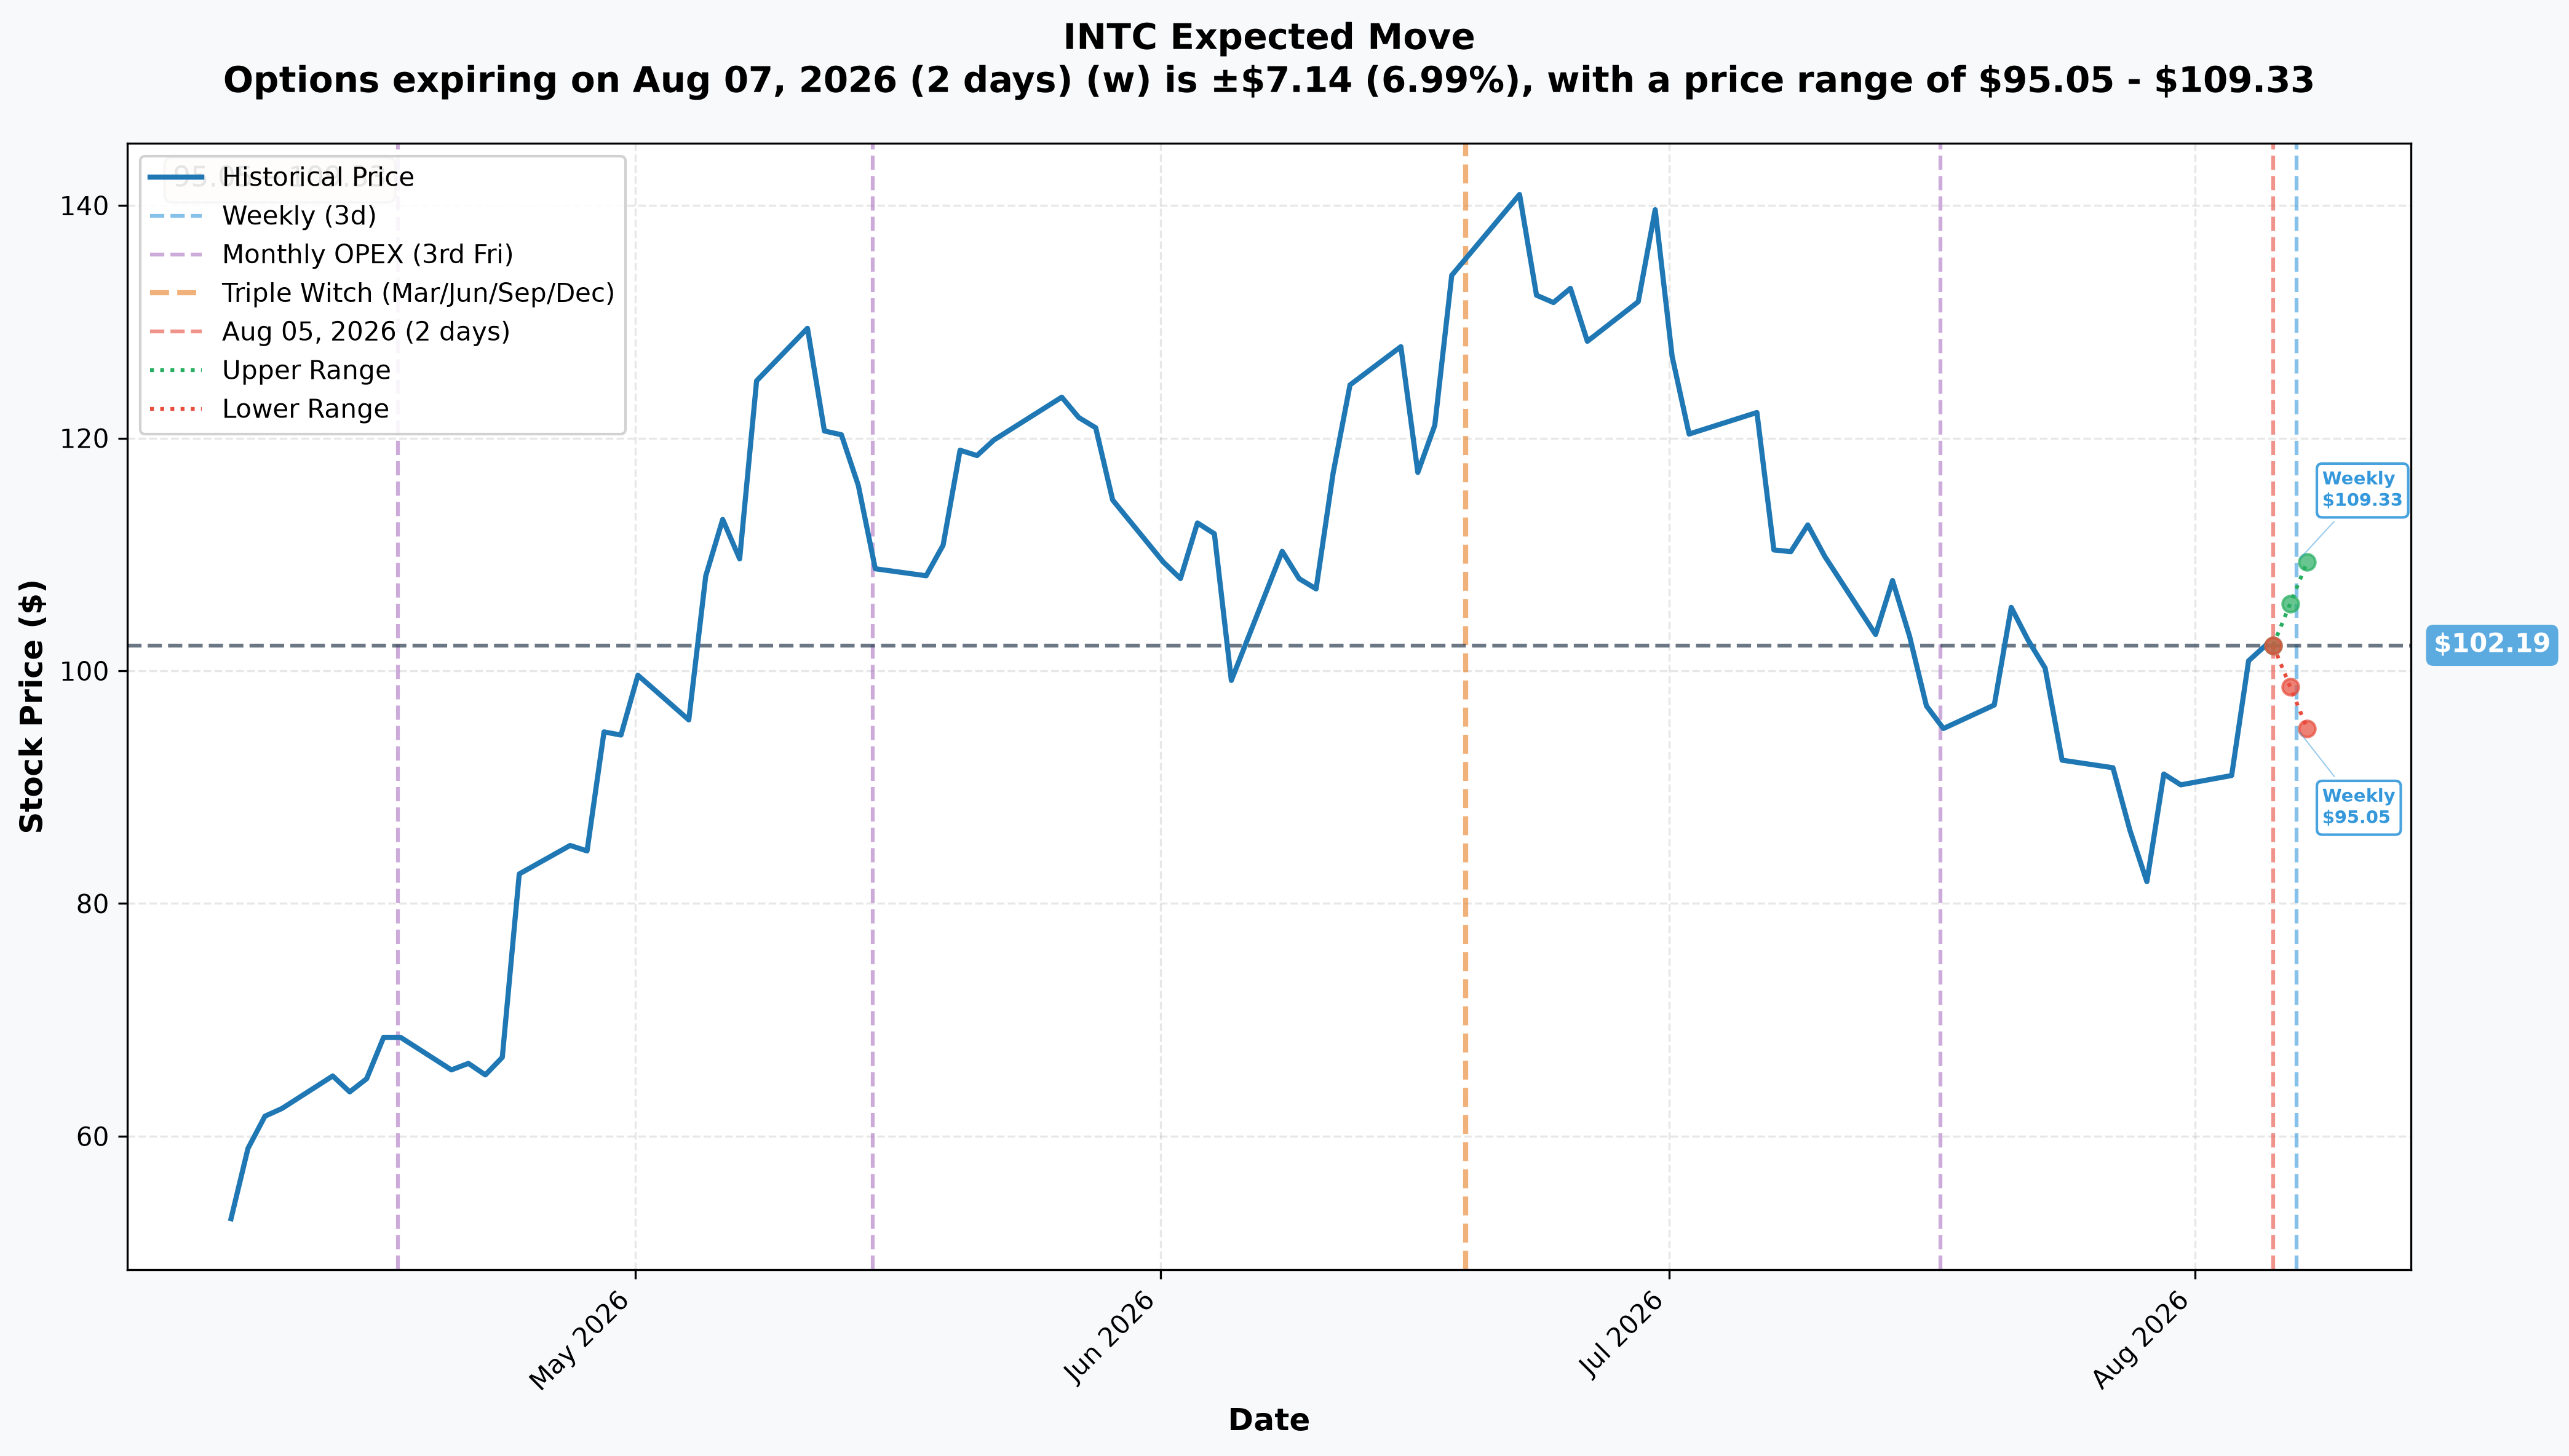
Straight from the options market's own pricing (spot $102.19 at the snapshot):
| Window | Expiry | DTE | Implied Move | Range |
|---|---|---|---|---|
| Weekly | 2026-08-07 | 2 | ≈6.99% (±$7.14) | $95.05 – $109.33 |
That's the only reliable window currently priced for INTC — a ≈7% weekly implied move is elevated for a mega-cap, another signature of how much volatility premium the market is still charging after the +510% run. Note this weekly window is far shorter than the Nov-20-2026 expiry on today's trade — no reliable longer-dated implied-move read was available for this position's actual expiry window at data-pull time.
🎲 Price Targets & Scenarios
Combining the gamma levels, the implied move, and the catalyst calendar:
- Bull case: Stock holds the $100 put wall as support and grinds back toward the $105–$110 resistance stack, aided by a clean Q3 print (≈Oct 22, inside this option's life) or a named foundry customer announcement. A short seller here would be underwater on the pure directional bet, though the position is already so deep in the money that the profit/loss math is dominated by the $4.01 of time value, not the intrinsic slice.
- Base case: Stock chops inside the weekly implied-move range (≈$95–$109) into the next earnings date, with the $70 strike staying deep in the money regardless — the real fight for whoever holds this trade is about the shrinking time-value cushion, not the strike being tested.
- Bear case: The Hold-consensus, two-downgrades-in-a-week narrative wins out and the stock slides toward or through the $100 put wall. That's exactly the scenario a fresh short-call seller would be positioned for — and exactly the scenario that would validate a position-trim read as premature.
💡 Trading Ideas
🛡️ Conservative
The OI print has resolved this as a trim of an existing long, which removes the coin-flip. That also removes most of the signal: a holder reducing a position tells you far less than a desk opening a new short would have. There is no action here worth taking on this print alone.
⚖️ Balanced
If you want defined-risk exposure around the Oct 22 (estimated) earnings date that this position brackets, a call or put spread built around the weekly implied-move range gives you a read on direction without the open-ended risk of a naked option, in a name where implied vol is still running rich.
🚀 Aggressive
Selling a deep-ITM call for time value (what this desk may be doing, if it's a trim/renewal) is a professional volatility-harvesting play, not a beginner one — you're on the hook for the full ≈427,150-share-equivalent delta if the stock keeps ripping. Anyone replicating this without an existing offsetting position is taking real directional risk, not a low-risk premium collection trade.
👥 Four Ways to Read This
🚀 YOLO Trader: This isn't a trade to copy — and now that OI has resolved it as a holder trimming a winning long, there is nothing directional to copy anyway. If you want to play the +510% fade narrative, do it with your own defined-risk position.
📊 Swing Trader: Watch the $100 put wall and $105/$110 resistance stack through the next few sessions. Note that the OI resolution came back as a trim, not a new short — so the bearish-tell scenario conditioned on a fresh short does not apply. Weigh the downgrades on their own merits.
💰 Premium Collector: The $4.01-per-share time value on this deep-ITM call is the number that matters if you're studying this as a covered-call or short-call template — it's a small residual premium relative to the $31.74 of intrinsic risk you'd be carrying, which is why size and hedging matter enormously here.
🌱 Beginner: A "$17.9M call SELL" headline sounds dramatic, but selling a call that's already $31.74 in the money isn't a fresh bearish conviction bet by default — it's often just someone managing an existing position. The honest answer to "is this bullish or bearish" is: we don't know yet, and anyone who tells you they do is guessing ahead of the data.
⚠️ Honest Risk & Limits — What the Tape Cannot Prove
- Open vs. close is unresolved today. Size (5,000) is below prior OI (83,141) — this genuinely could be an opening short or a closing/trim trade. Tomorrow's ≈06:30 ET OPRA snapshot is the definitive test.
- The "trim" read is inferred, not proven. We did not independently verify the direction (long or short) of the ≈75,000-contract position built in late July — we're reasoning from size-relative-to-OI, not from a confirmed prior position.
- No visibility into counterparty, broker, or customer identity on either side of the cross — OPRA never discloses this.
- No visibility into any offsetting stock, futures, or other-options hedge that may exist off the options tape.
- Q3 earnings date (≈October 22, 2026) is an estimate, not an Intel-confirmed date.
- U.S. government equity stake terms remain unpublished — existence is confirmed, size and structure are not, per available sourcing.
- Gamma and implied-move levels are dynamic and will shift as the tape develops and as any confirmed Q3 date approaches.
Disclaimer: Options trading involves substantial risk and is not suitable for all investors. This analysis is for informational purposes only and does not constitute investment advice. Past performance and options flow do not guarantee future results. Always do your own research and consider your risk tolerance before trading.
Last updated: 2026-08-06 (pre-market) — next-day OPRA open interest resolved the open-vs-close question. OI fell 83,141 → 78,127 (−5,014) on a 5,000-lot print, confirming a close/trim of the late-July long-call build rather than a new short. Title and the resolution section were updated.