🎪 LYV: A Desk Sold a $15.21M Straddle — And the Risk Sits on the Upside, Not the Downside
📅 2026-08-12 | 🤝 Stock-and-Options Cross Detected
✅ Updated 2026-08-13 pre-market — the next-day OPRA open interest confirmed both straddle legs, with the put side landing exactly on our published number. The $180 puts rose 71 → 6,071 (+6,000) — precisely the ≈6,071 we predicted — and the $180 calls rose 57 → 6,027 (+5,970) against a predicted ≈6,057. Both STO labels stand: this is a genuinely new short straddle. See the ✅ RESOLVED box.
At 14:54:35 ET, a desk sold 6,000 December-18 $180 calls at $15.93 and sold 6,000 December-18 $180 puts at $9.42 — a short straddle at the $180 strike, collecting ≈$15.21M in credit with Live Nation trading at $185.45. That's a bet that Live Nation goes nowhere for the next four months — but here's the twist: the math says the danger to this trade is a rally, not a selloff. The stock's own analyst targets sit above the upper breakeven, short interest is a crowded 18.21% of float, and the headline-grabbing Ticketmaster breakup fight has just been pushed outside this option's life. Let's dig into why. 👀
🏢 Company Overview
Live Nation Entertainment runs three businesses under one roof, per the company profile: Concerts (promoting shows and festivals at owned and rented venues — $6.4B in Q2 2026 revenue, +8% YoY), Ticketmaster (ticketing software and the primary/resale marketplace — $852M revenue, +15% YoY, and now the larger profit contributor at $331M AOI vs Concerts' $310M), and Sponsorship & Advertising ($383M revenue, +12% YoY). Headquarters is Beverly Hills, CEO is Michael Rapino, and the company employs ≈34,700 people (company profile).
Sector: Communication Services · Industry: Entertainment (company profile). Live Nation carries a $43.19B market cap on 232.96M shares outstanding, is up +20.3% year-to-date, and trades near its 52-week high of $188.00 (range $125.34–$188.00) — above both its 50-day ($177.07) and 200-day ($157.23) moving averages (statistics).
One number matters more than any other for reading this trade: 18.21% of the float — 25.27 million shares — is sold short (statistics). That's a crowded short base sitting underneath a stock that's already grinding toward its highs, and it's the fuel behind the headline finding below.
💰 The Trade in Plain English
A desk sold 6,000 December $180 calls and 6,000 December $180 puts — the same strike, same expiration, opposite option types — at the same moment. Selling a call obligates you to hand over shares at $180 if assigned; selling a put obligates you to buy shares at $180 if assigned. Doing both at once at the same strike is a short straddle: you're collecting a big pile of premium up front, and your position makes money as long as the stock sits near $180 through expiration.
The print carried a paired equity leg — the tape shows this as a stock-and-options cross — which is why we read this as a delta-hedged volatility sale (a desk positioning around implied volatility, with the share leg offsetting the option delta) rather than a naked directional bet. That framing, and the SELL label on each leg, is reported from the print, not proven the way a lit, liquidity-taking trade would be.
📊 Full Trade Details
| Time | Buy/Sell | Call/Put | Expiration | Premium | Strike | Volume | OI (prior) | Size | Spot | Option Price | Option Symbol |
|---|---|---|---|---|---|---|---|---|---|---|---|
| 14:54:35 ET | SELL 🤝 | Call | 2026-12-18 | $9,558,000 | $180 | 6,000 | 57 | 6,000 | $185.45 | $15.93 | LYV20261218C180 |
| 14:54:35 ET | SELL 🤝 | Put | 2026-12-18 | $5,652,000 | $180 | 6,000 | 71 | 6,000 | $185.45 | $9.42 | LYV20261218P180 |
Combined credit collected: $25.35/share ≈ $15.21M total. That gives breakevens at $154.65 (down 16.6%) and $205.35 (up 10.7%) — the position profits only if Live Nation stays inside a ≈±13.7% band through December 18.
✅ RESOLVED — Both Legs Opened; the Put Side Hit the Prediction Exactly
Updated 2026-08-13 pre-market. Resolving OPRA snapshot timestamped August 13 (reflects the August 12 close, after this print); baseline is the August 12 snapshot (reflects the August 11 close, before this print).
| Leg | Baseline (Aug-12) | Resolving (Aug-13) | Δ | Print size | What we published | Verdict |
|---|---|---|---|---|---|---|
| Dec-18 $180 put (sold) | 71 | 6,071 | +6,000 | 6,000 | "puts near ≈6,071" | ✅ OPEN (STO) — exact, 100.0% |
| Dec-18 $180 call (sold) | 57 | 6,027 | +5,970 | 6,000 | "calls near ≈6,057" | ✅ OPEN (STO) — 99.5% of size |
The short straddle is real, new, and the size on the tape. The put leg matched the prediction to the contract; the call leg came in 30 contracts light, meaning a handful of the printed calls matched against existing holders. Neither line fell, so no part of this was an unwind.
The article's central point survives the check. A desk has genuinely taken on new short volatility at $180 in both directions, and the resolution confirms the size at which the upside risk sits.
Unchanged limits: this printed as a stock-and-options cross, so the SELL tags are reported rather than tape-proven, and the paired share leg is invisible to the option open-interest check.
🤓 What This Actually Means — Plain English
A short straddle is not a bet on direction. It's a bet on boredom. By selling both a call and a put at $180, this desk collected $25.35 a share up front and is now betting Live Nation spends the next four months doing very little.
- You collect the premium immediately — the full $15.21M landed in the seller's account today, not gradually.
- It's short volatility, not short (or long) the stock. A straddle buyer wants a big move in either direction; a straddle seller wants the opposite — calm. The position doesn't care which way LYV eventually breaks, only whether it breaks the band at all.
- It loses on a big move in either direction. Above $205.35, the losses on the short call are open-ended — there's no ceiling on how high a stock can go, which means no ceiling on the loss. Below $154.65, the short put starts bleeding just as fast, though it's capped at zero (a stock can't go negative). Both sides carry real risk — this is not a "safe" income trade.
- The paired equity leg changes how you should read the SELL label. Because shares came attached to this print, the desk likely used the stock to neutralize the option position's directional exposure (delta) at the moment of the trade. That's consistent with a market-maker or vol-desk facilitation rather than someone making a personal bet that Live Nation goes nowhere — but it doesn't change the payoff math for whoever is now short this straddle.
🔥 The Headline Finding: The Risk Here Is a Rally, Not a Selloff
This is the counterintuitive part, and it's worth leading with:
- The upper breakeven of $205.35 is only ≈1.7% above the $201.96 consensus 12-month target (overview) — and it sits below the $210–$215 targets recently published by Goldman Sachs, Benchmark, BTIG and Citigroup, all raised or initiated between July 23 and August 3, 2026.
- Short interest sits at 18.21% of float (statistics) — a crowded short base that can accelerate any upside surprise into a squeeze.
- The stock is already ≈1.4% below its 52-week high of $188.00, trading above both its 50-day and 200-day averages — momentum is intact, not broken.
- By contrast, the lower breakeven of $154.65 (−16.6%) looks better protected: the two biggest single-day moves in the last three months were −6.3% (the April 15 antitrust verdict) and ≈−5% (the July 30 earnings reaction) — neither one came close to that level.
So the danger to this trade is Live Nation going up, not down.
⚖️ The Antitrust Case Is Far More Advanced Than "Pending" — But It's Calendared Outside This Trade
If you've followed Live Nation's antitrust saga, you might assume the entire straddle is a bet on how a pending trial resolves. It isn't — the trial already happened.
- A Manhattan federal jury already ruled against Live Nation on April 15, 2026, finding it operated an illegal monopoly in primary ticketing and the large-amphitheater market. The jury found consumers were overcharged $1.72 per ticket across 22 states and DC, covering roughly 20% of tickets at 257 venues. Shares fell 6.3% that day (Music Business Worldwide).
- The DOJ had already settled mid-trial on March 9, 2026 — a 15% fee cap, an eight-year consent decree, and a $280 million fund for state damages (company release summary).
- 33 states plus DC formally demanded a Ticketmaster divestiture on May 21, 2026 (Music Business Worldwide).
But the breakup fight itself is not inside this expiration. The remedies/penalties phase is reported to stretch into 2027 (news index, Courthouse News, May 7, 2026), and on August 11, 2026 — the day before this trade — Live Nation moved to stay the breakup fight pending a DOJ settlement review the company itself says could take up to a year (TicketNews, via news index). Live Nation had already won a separate pause on breakup discovery back on June 3, 2026. The single legal event most capable of breaking a ±13.7% band is calendared beyond the December 18 expiration — and that's very likely why this straddle was sold in the first place.
What IS inside the window: exactly one earnings report — Q3 2026, expected ≈November 3–11, 2026 (the date has not yet been announced; Q3 2025 landed November 4, 2025 and Q3 2024 landed November 11, 2024, via news index) — and it's the seasonal peak quarter. It's backstopped by a record $6.4B deferred revenue balance (+25% YoY) and 143 million-plus tickets sold through mid-July, 14 million ahead of last year's pace (Q2 2026 results). Q4 and Q1 are the company's seasonally loss-making trough quarters, which is exactly where the December 18 expiration lands.
The one genuinely live in-window legal binary is Judge Subramanian's pending ruling on Live Nation's post-trial motions, argued ≈August 3, 2026 and left pending with no deadline (TicketNews). Note its surprise direction is asymmetric to the upside for the stock: a grant would vacate the monopoly finding and remove the divestiture threat entirely.
Keep the dates straight: the catalysts above (earnings ≈Nov 3–11, the pending motion ruling with no set date) are separate from the option's December 18, 2026 expiration date.
📈 Chart Check-Up
YTD Performance
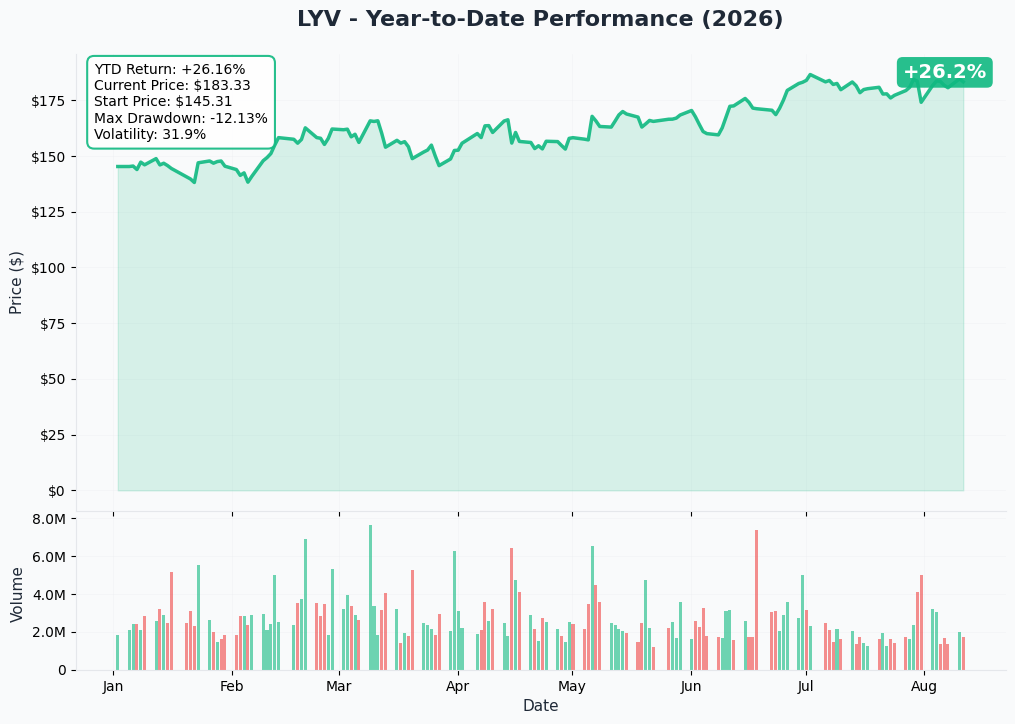
Live Nation is up +20.3% year-to-date, grinding within striking distance of its 52-week high of $188.00, and holding well above both its 50-day ($177.07) and 200-day ($157.23) moving averages.
Gamma Support & Resistance
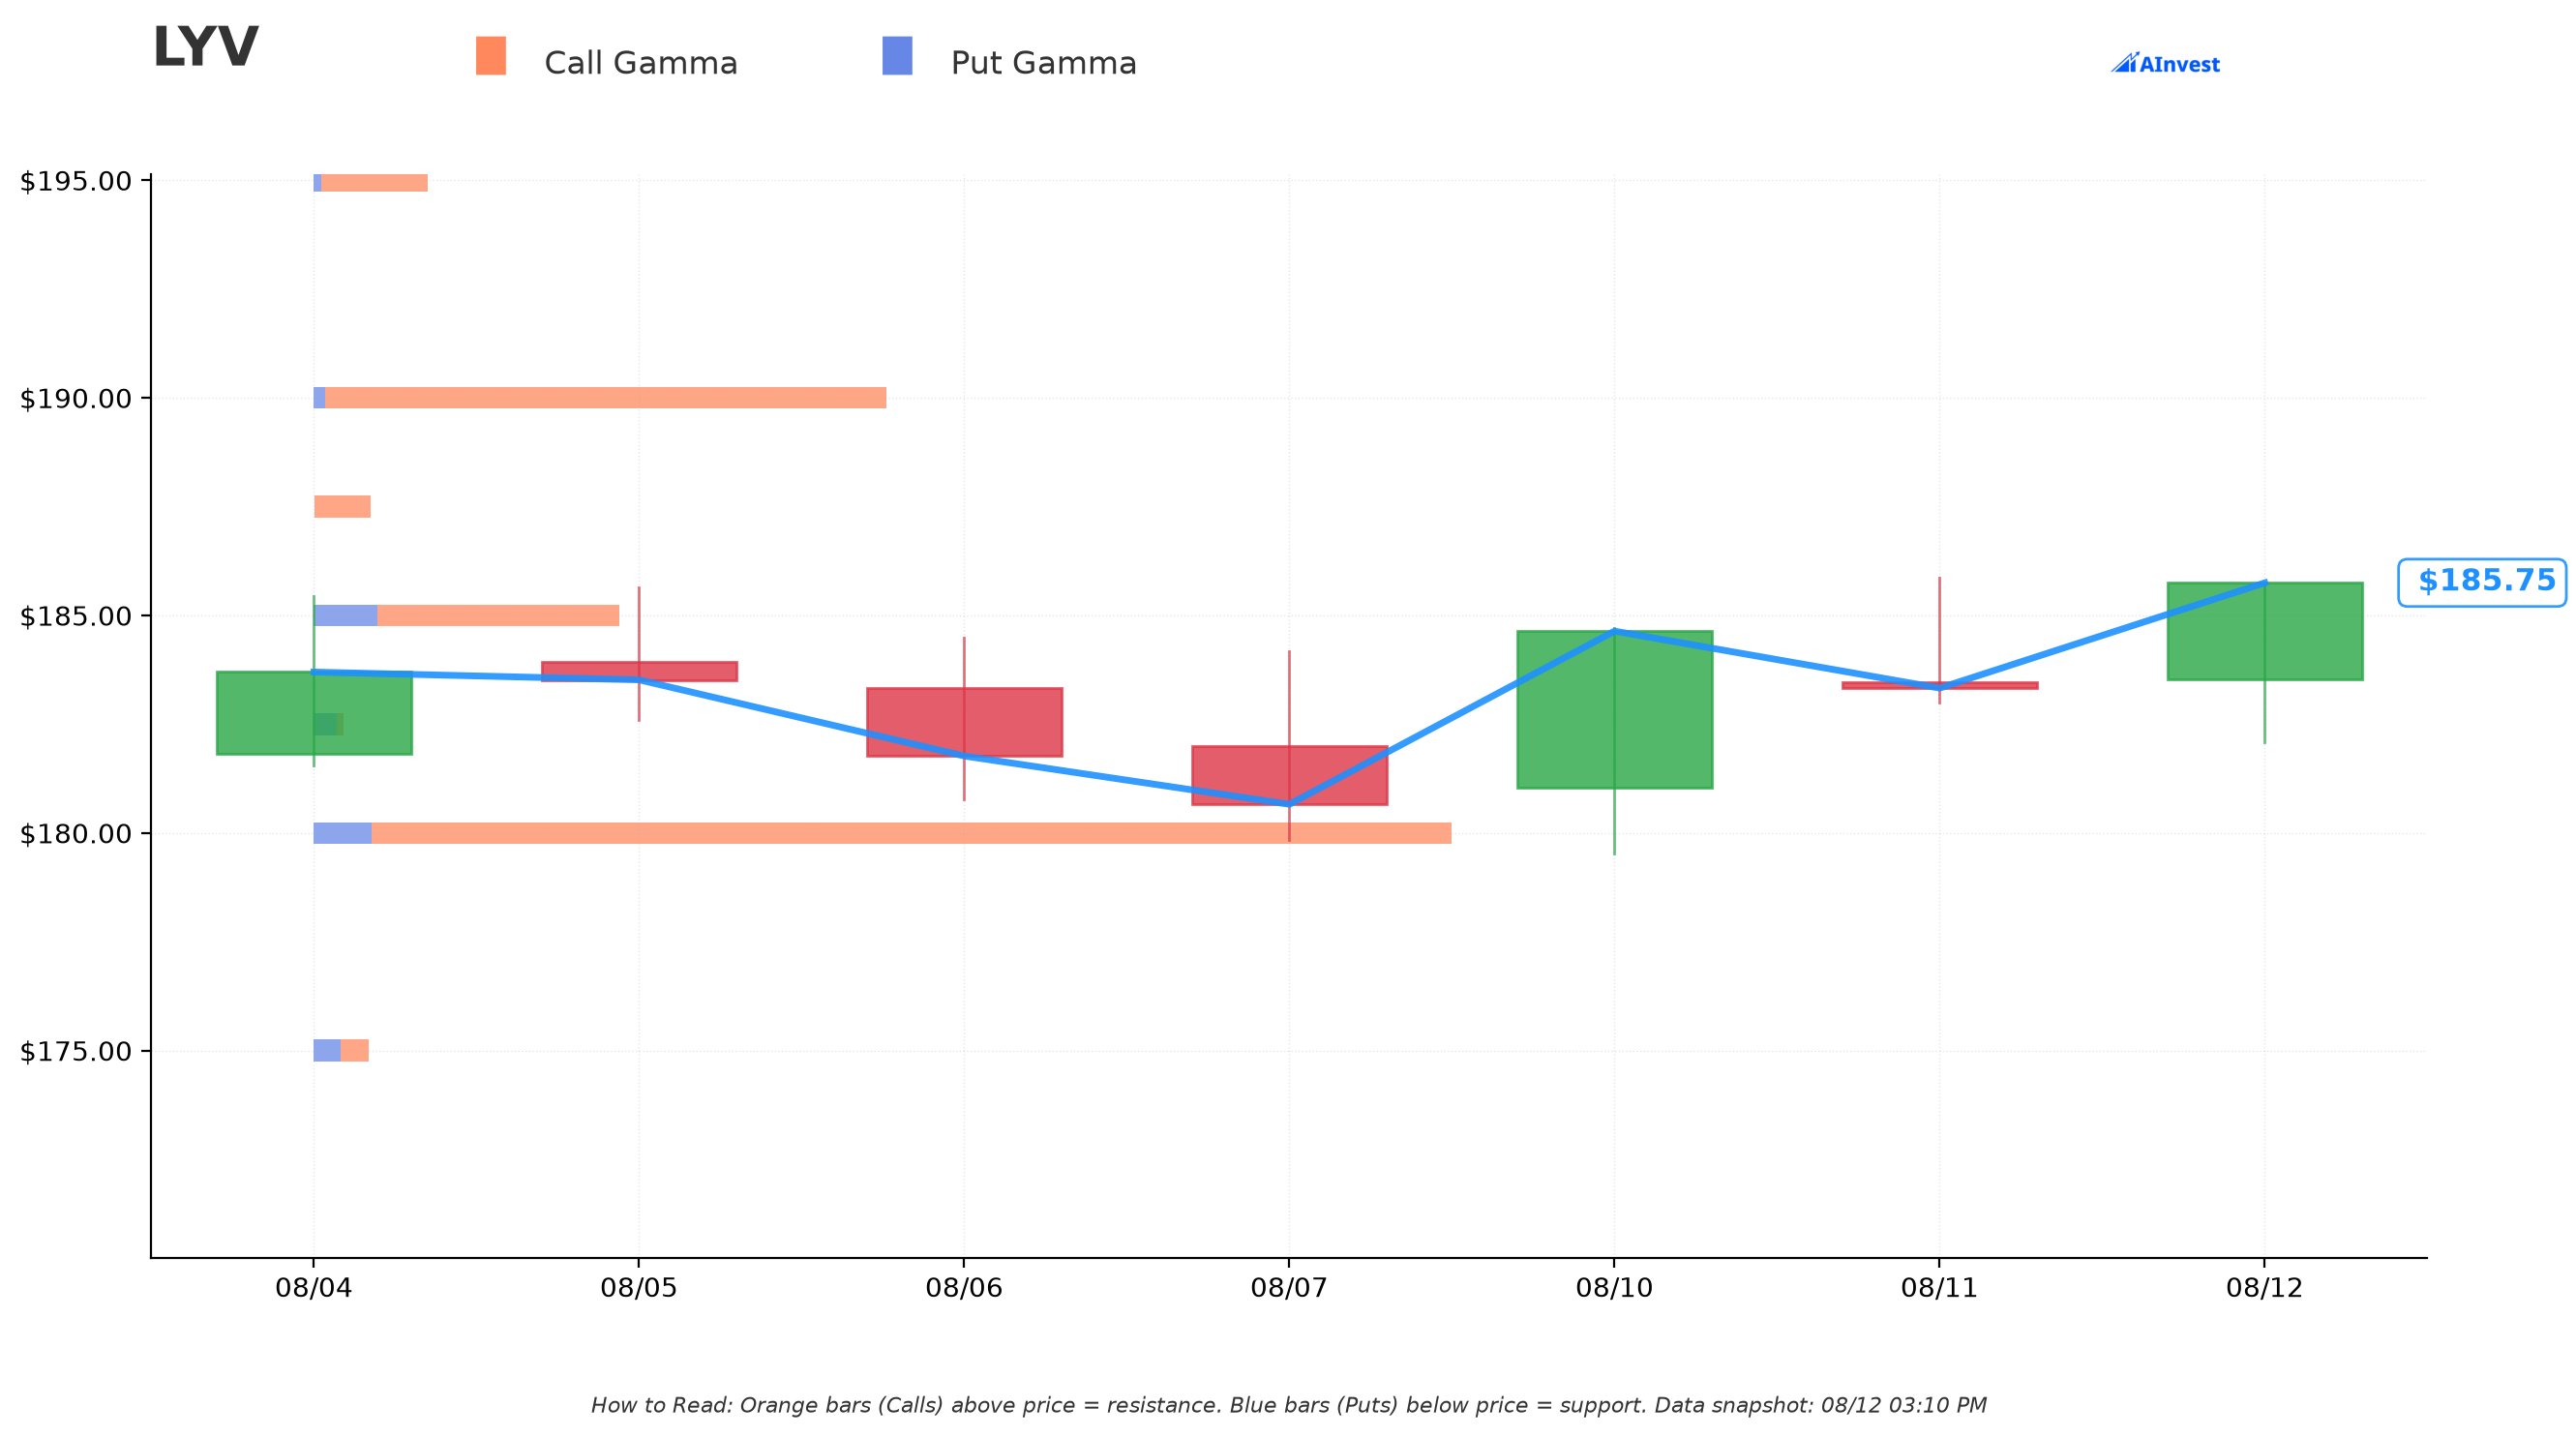
With spot at $185.68, the options market's own positioning shows resistance at $190 (Moderate strength), ≈2.3% above spot, and support at $180 (Strong strength), ≈3.1% below spot. 🔵 The blue $180 support bar is the biggest one on the board — and that's the exact strike this straddle was sold at. The desk picked the strike where dealer hedging flows already tend to cushion price, reinforcing the "stock stays near here" thesis embedded in the trade — though gamma levels shift throughout the day and aren't a guarantee.
Implied Move
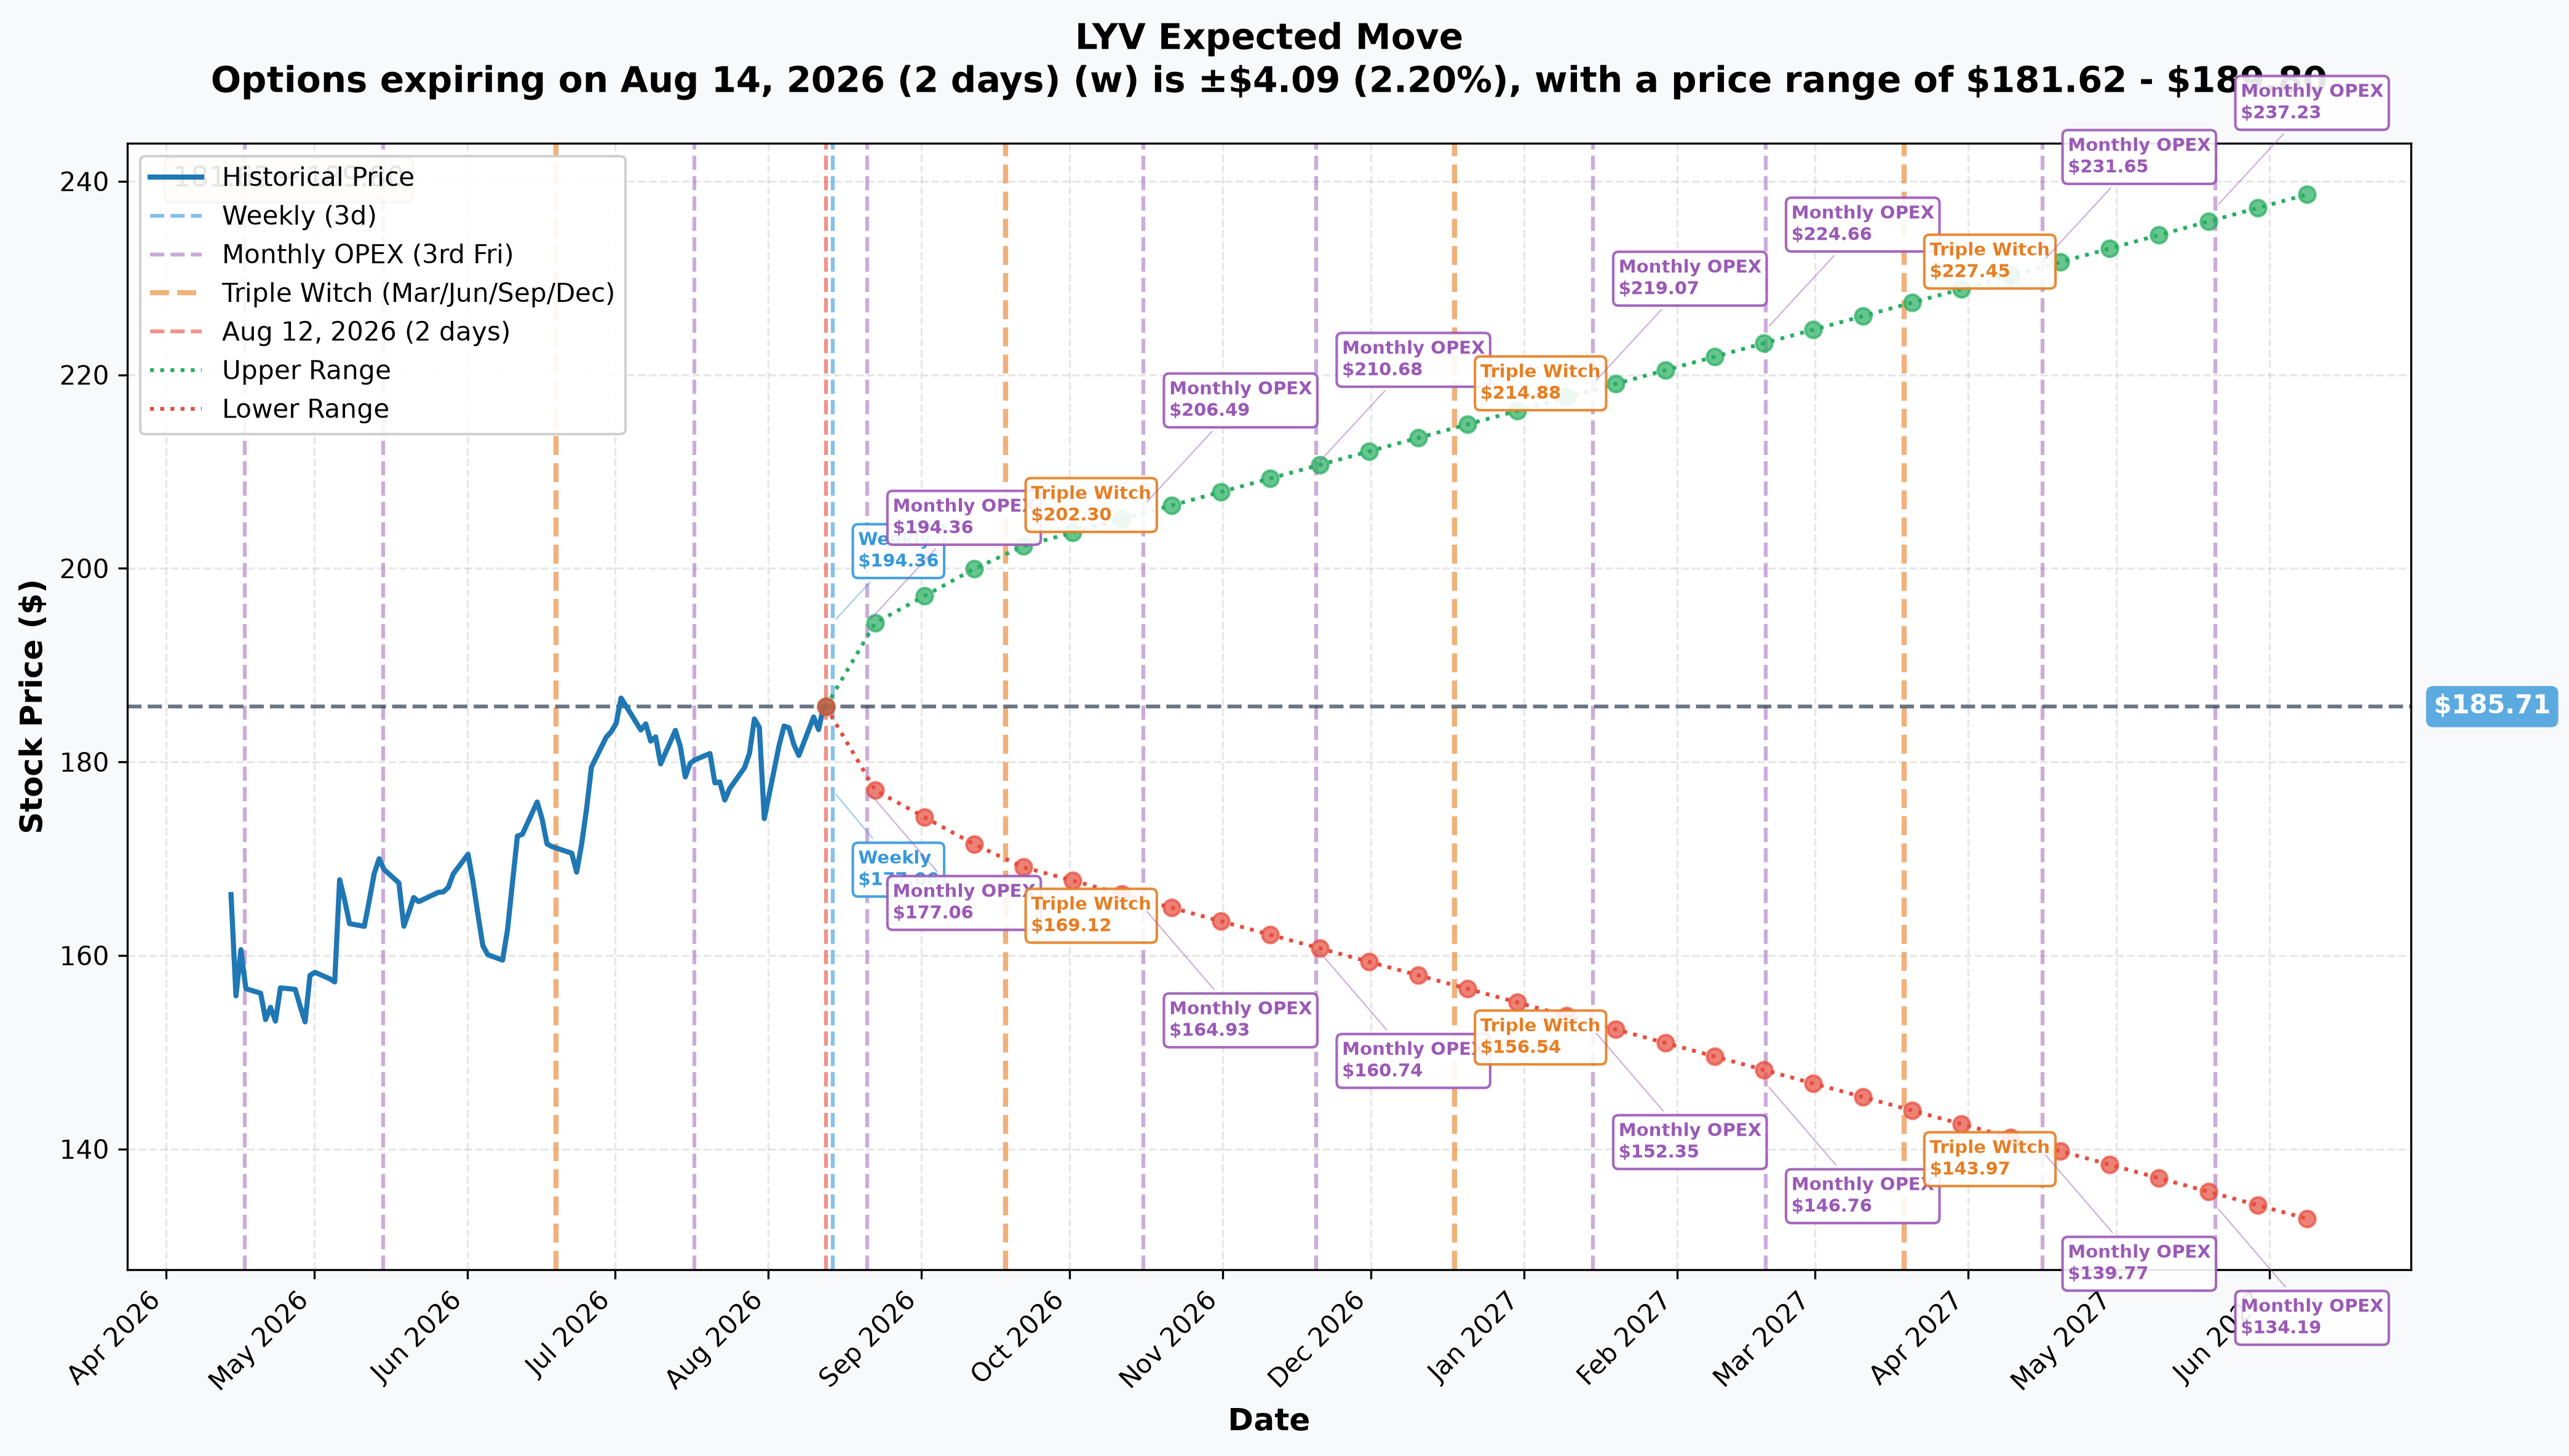
The options market is pricing:
- ±2.20% to Aug 14 ($181.62–$189.80)
- ±4.51% to Aug 21 ($177.34–$194.08)
- ±8.71% to Sep 18 ($169.54–$201.88)
Here's the tell: the five-week range tops out at $201.88 — short of the $205.35 upper breakeven. The market is not yet pricing a move big enough to blow through the top of this straddle within the next month. That's consistent with the "rally is the risk, but it's not an imminent one" read above — the danger is more about where LYV drifts into November earnings and the pending court ruling than about a move in the next few weeks.
🎪 Catalysts
Already happened (past 3 months)
- March 2, 2026 — federal antitrust trial began, SDNY, Judge Arun Subramanian (Music Business Worldwide)
- March 9, 2026 — DOJ settled mid-trial: 15% fee cap, eight-year decree, $280M fund (company release summary)
- April 15, 2026 — jury verdict: illegal monopoly; stock fell 6.3% (Music Business Worldwide)
- May 21, 2026 — post-trial motions filed; 33 states + DC demand Ticketmaster divestiture (Music Business Worldwide)
- June 3, 2026 — Live Nation wins pause on breakup discovery (TicketNews, via news index)
- July 30, 2026 — Q2 2026 results: $7.7B revenue (+9%), EPS $1.05, 49M fans (+10%), record $6.4B deferred revenue (+25%); stock fell ≈5% despite the beat (results release)
- July 23 – August 3, 2026 — analyst targets raised/initiated to $210–$215 by BTIG, Goldman Sachs, Benchmark and Citigroup (news index)
- August 3, 2026 — judge probed the verdict's evidentiary basis, left the ruling pending (TicketNews)
- August 11, 2026 (the day before this trade) — Live Nation moves to stay the breakup fight pending a DOJ review it says could take up to a year; states formally file the breakup demand; a congressional hearing presses for divestiture (TicketNews items, via news index)
Upcoming (next 6 months)
- ≈November 3–11, 2026 (unannounced) — Q3 2026 earnings, the seasonal peak quarter, backstopped by record deferred revenue and ticket sales running ahead of pace (results release; news index)
- No set date — could land any time from September through December — ruling on the Rule 50(b)/59 post-trial motions, argued ≈August 3, 2026; a grant would vacate the monopoly finding and is the one legal event whose surprise favors the upside (TicketNews)
- 2026-12-18 — this option's expiration date (third-Friday quarterly rebalance/triple-witching)
- 2027 (H1, outside this option's life) — the actual remedies/divestiture phase that decides Ticketmaster's fate (news index)
🎲 Four Ways to Read This Trade
🎲 The YOLO trader
You want the fireworks this straddle is betting against. A short straddle isn't your style — you'd rather buy cheap optionality on the one live binary: the Rule 50(b)/59 ruling. A cheap, further-out-of-the-money call spread expiring after a plausible ruling window (or simply riding the stock with a tight stop) captures the asymmetric-upside surprise this article flags, without writing uncapped risk against your own account. Selling straddles into event risk you don't control is a good way to get run over by the very headline you were hoping for.
📈 The swing trader
The setup here is actually a decent map for a directional trade, even though the straddle itself isn't directional. Gamma support at $180 and the implied-move ceiling of $201.88 through mid-September outline a likely trading range for the next month. A bull call spread or put credit spread anchored to those levels — sized much smaller than 6,000 contracts — lets you participate in the "stock stays contained near-term" thesis without the tail risk of a naked short straddle riding all the way to December.
💰 The premium collector
This is the main event, and it needs to be said plainly: a short straddle has undefined risk on both sides. You are not writing a covered call or a cash-secured put — there is no stock underneath capping the downside and no ceiling capping the upside on your own version of this trade. If you're drawn to "sell premium, collect income," study this trade's shape rather than copying its size: 6,000 contracts is a $15.21M institutional book, almost certainly hedged with the paired equity leg on the print. A retail-sized version of this idea should be far smaller, should consider wings (turning it into an iron condor by buying protection above $205 and below $155) to cap the tail, and should treat the $205.35/$154.65 levels as hard lines to manage well before expiration — not targets to ride to zero.
🌱 The beginner
Selling two options at once for a big credit can look like "free money," and this trade is a good teaching example of why it isn't. The $15.21M this desk collected today is the most they can ever make on this position — and it's already in hand. What's left is pure risk: if Live Nation is anywhere outside $154.65–$205.35 in December, the position loses money, and there's no cap on how much it can lose if the stock keeps running past $205.35. Before you ever sell a call or a put yourself, understand that collecting premium means taking on an obligation, not making a prediction that's guaranteed to pay off.
⚠️ Honest Limits — What the Tape Can't Prove
- The tape proves the trade happened and that both legs are new opens against flat prior open interest — it does not prove intent. The "delta-hedged volatility sale" read comes from the paired equity leg on the print, not from any statement of purpose; we don't know the counterparty, the broker, or whether more of this position gets added before December.
- This session's research ran on direct page fetches after the search budget was exhausted. Several primary sources actively blocked retrieval, most importantly the actual SDNY court docket — it was never read directly. The DOJ Antitrust Division case page, SEC EDGAR filings, and several news publisher pages (Reuters, AP News, Billboard, Variety, Pollstar, TicketNews article pages) also returned blocked/failed fetches, so a number of the legal-timeline items above are cited to a news-index listing rather than the original publisher page.
- Unsourced gaps: the exact Q3 2026 earnings date (unannounced as of today), Q3 2026 consensus revenue/EPS estimates, a precise 3-month (since mid-May) price return figure, primary-ticketing/concert-promotion market-share percentages, and any bearish analyst downgrades or price-target cuts in the last three months — none of these could be located or confirmed in this session, and their absence should not be read as proof they don't exist.
- Options trading involves substantial risk and is not suitable for every investor. A short straddle in particular carries theoretically unlimited risk on the call side and large capped-but-real risk on the put side. Nothing here is a recommendation to replicate this trade; it's a breakdown of what the tape shows and what it doesn't.
Last updated: 2026-08-13 (pre-market) — the next-day OPRA open-interest snapshot confirmed both legs. Dec-18 $180P 71 → 6,071 (+6,000, exactly the predicted ≈6,071) and $180C 57 → 6,027 (+5,970 against 6,000): OPEN (STO) on both. The ⏳ callout was replaced with the ✅ RESOLVED box; no thesis or title change was required.