📎 MMM $1.79M Call Buy — A Modest Bet 3M Climbs Past $190 by Mid-September
📅 2026-08-04 | 🤝 Floor-Negotiated Block
🎯 The Quick Take
A trader bought 6,000 September $190 calls on 3M for $1,788,000, printed as a floor trade at 14:41:27 ET when the stock was at $180.18. The size (6,000) clears the prior open interest of ≈1,672 contracts, so most of this is a new position — but because it was negotiated on the floor at the midpoint rather than lifted off the lit book, the tape can't tell us how urgent or aggressive the buyer was. This is a real position, not a huge one for a $93B industrial name, and it needs 3M to rally about 7% in 45 days to break even.
🏢 Company Overview
3M Company (MMM) is a diversified industrial conglomerate operating across Safety & Industrial, Transportation & Electronics, and Consumer segments — everything from Post-it notes and Scotch tape to industrial adhesives, respirators, and electronics materials. Market cap is roughly $93.2 billion. It's a slow-moving, dividend-paying industrial name, not a high-beta momentum stock — which matters when you're pricing a 45-day, out-of-the-money call.
💰 The Option Flow Breakdown
📊 What Just Happened
| Time (ET) | Buy/Sell | Call/Put | Expiration | Premium | Strike | Volume | Prior OI | Size | Spot | Option Price | Option Symbol |
|---|---|---|---|---|---|---|---|---|---|---|---|
| 14:41:27 | BUY | CALL | 2026-09-18 | $1,788,000 | $190 | 7,400 | 1,672 | 6,000 | $180.18 | $2.98 | MMM20260918C190 |
- Net: $1,788,000 debit paid for 6,000 contracts of the September 18 $190 call.
- Mechanism (tape-confirmed): a single-leg floor trade. This was manually negotiated on the exchange floor and filled at the midpoint — not a sweep that tore through the offer, and not an off-book cross between two pre-arranged counterparties in the aggressive sense either. It's a facilitated block: a broker worked this size and matched it at $2.98.
- Strike $190 sits about 5.5% above the $180.18 spot. Delta on the print was ≈0.275, so this position carries roughly +165,000 shares of directional exposure (6,000 contracts × 100 × 0.275).
- Breakeven: $192.98, which is +7.1% from spot, with 45 days left until expiration.
✅ RESOLVED — Confirmed Open
Updated 2026-08-05 pre-market. The ≈06:30 ET OPRA snapshot (reflecting the August 4 close) has published.
| Leg | Baseline OI (Aug-4 snap) | Resolving OI (Aug-5 snap) | Δ | Print size | Δ as % of print | Verdict |
|---|---|---|---|---|---|---|
| Sep-18-2026 $190 C (bought) | 1,672 | 8,354 | +6,682 | 6,000 | ≈111.4% | ✅ OPEN (BTO) — confirmed |
We expected roughly 7,600; the actual number is 8,354. Open interest rose by more than the print size, so none of this was existing holders unwinding against the buyer — the position is confirmed brand-new, with a bit of additional opening flow from others at the same strike (day volume 7,767).
🤓 What This Actually Means — Plain English
The trade prints as a "BUY," and the structure backs that up: it's a single call leg, size dwarfs the prior open interest, so this reads as buy-to-open (BTO) — someone is establishing a new long call position, not closing out an old one.
But here's the nuance the headline number glosses over. This printed as a floor trade — a manually negotiated block, worked by a broker and crossed at the mid-price ($2.98, roughly the midpoint of the bid-ask at the time). That's different from a sweep that races up through the offer to grab liquidity. A sweep tells you someone was in a hurry and willing to pay up. A floor-negotiated block tells you someone wanted size filled cleanly without moving the market — which could mean genuine conviction executed patiently, or it could just mean a fund rebalancing a position without caring about urgency.
We checked the implied volatility move through the print and it came back essentially flat-to-slightly-lower (≈−1.06%) — but that check doesn't actually apply here, because a negotiated floor trade doesn't take displayed liquidity the way a lit sweep does. IV barely moving is exactly what you'd expect for this kind of print regardless of the buyer's intent, so it's not usable as a direction signal on this trade. Bottom line: the structure supports "long call opened," but the tape does not prove aggressive, urgent buying — it's a real, size-confirmed position, just not a screaming conviction trade.
For context on scale: $1.79M is a real ticket, but on a name where 3M's daily options volume and market cap run large, this sits toward the smaller end of what typically shows up on an unusual-activity board. Treat it as a position, not a headline.
📈 Technical Setup / Chart Check-Up
YTD Chart
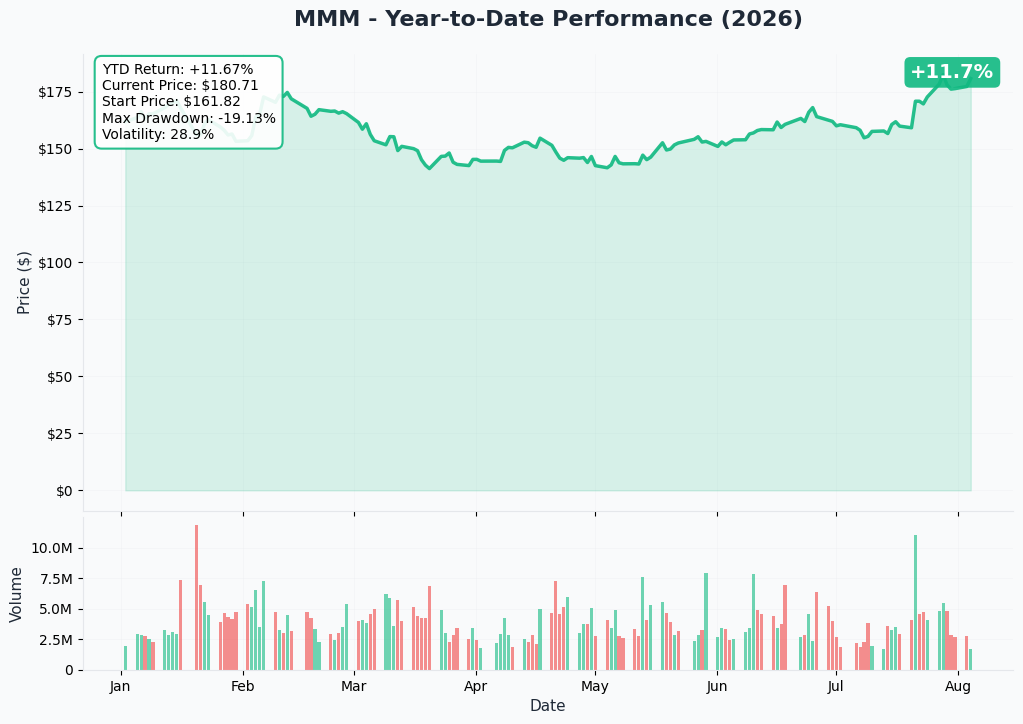
3M shares are up roughly +11.7% over the past year — a steady, unspectacular climb consistent with an industrial name working through a multi-year turnaround rather than a stock in the middle of a violent trend. That backdrop matters: getting from $180.18 to the $192.98 breakeven in 45 days would require a faster move than the stock's trailing year-long pace suggests is typical.
Gamma-Based Support & Resistance Analysis
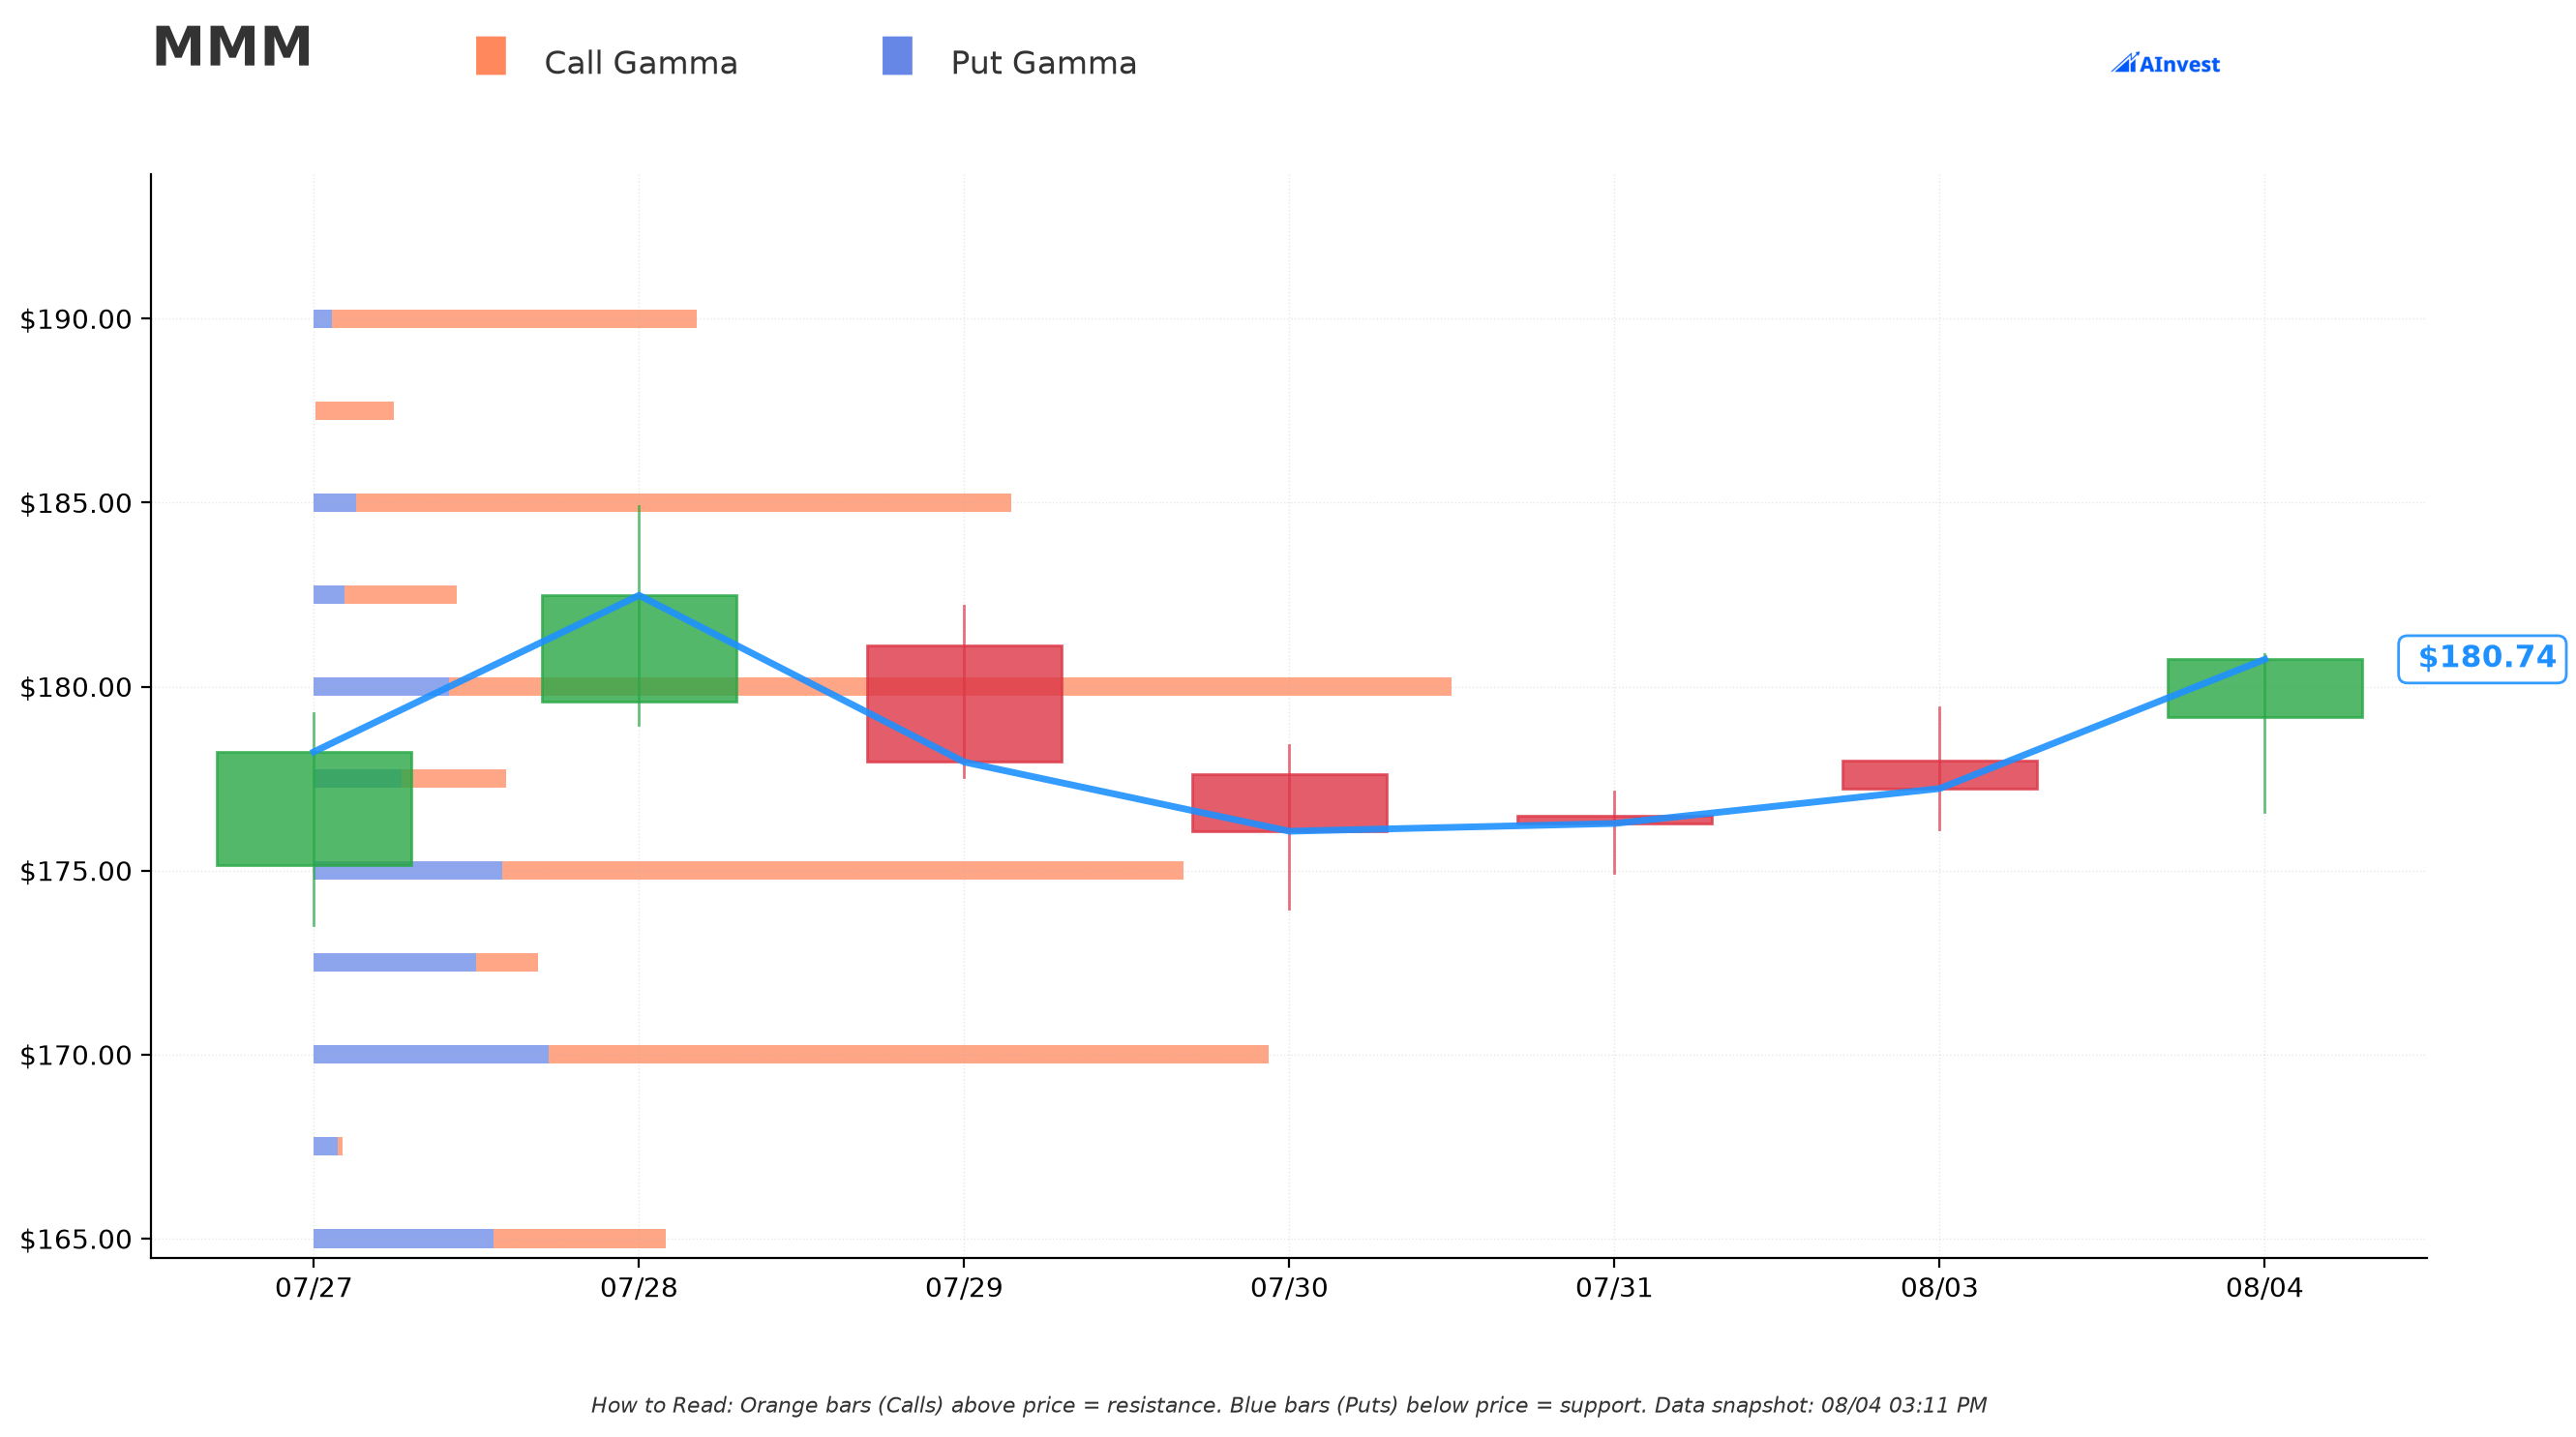
With MMM near $180.76, dealer gamma positioning shows:
- Nearest resistance: $185 — moderate strength, total gamma exposure ≈2.71 (in the chart's scaled units), about 89% of it concentrated on the call side (call gamma ≈2.55 vs put gamma ≈0.16). That's roughly +2.3% above spot.
- At/just-below spot: $180 carries the single biggest gamma concentration on the board (total ≈4.43), also heavily call-dominated (≈3.91 call vs ≈0.53 put) — it's acting as a pivot right where the stock is trading, not a clean floor.
- Support below: $175 (≈3.2% down, total gamma ≈3.39, moderate) and $170 (≈6.0% down, total gamma ≈3.72, moderate).
- Worth noting for this specific trade: the $190 strike itself carries a real gamma footprint too (total ≈1.49, ≈95% call-side) — meaning dealers already have meaningful hedging flow positioned exactly at the strike this call needs the stock to clear. That can act either as a magnet (if dealers are short gamma and have to chase the stock up) or as friction (if they're long gamma and selling into strength) — the sign isn't something the raw gamma table alone resolves.
Implied Move Analysis
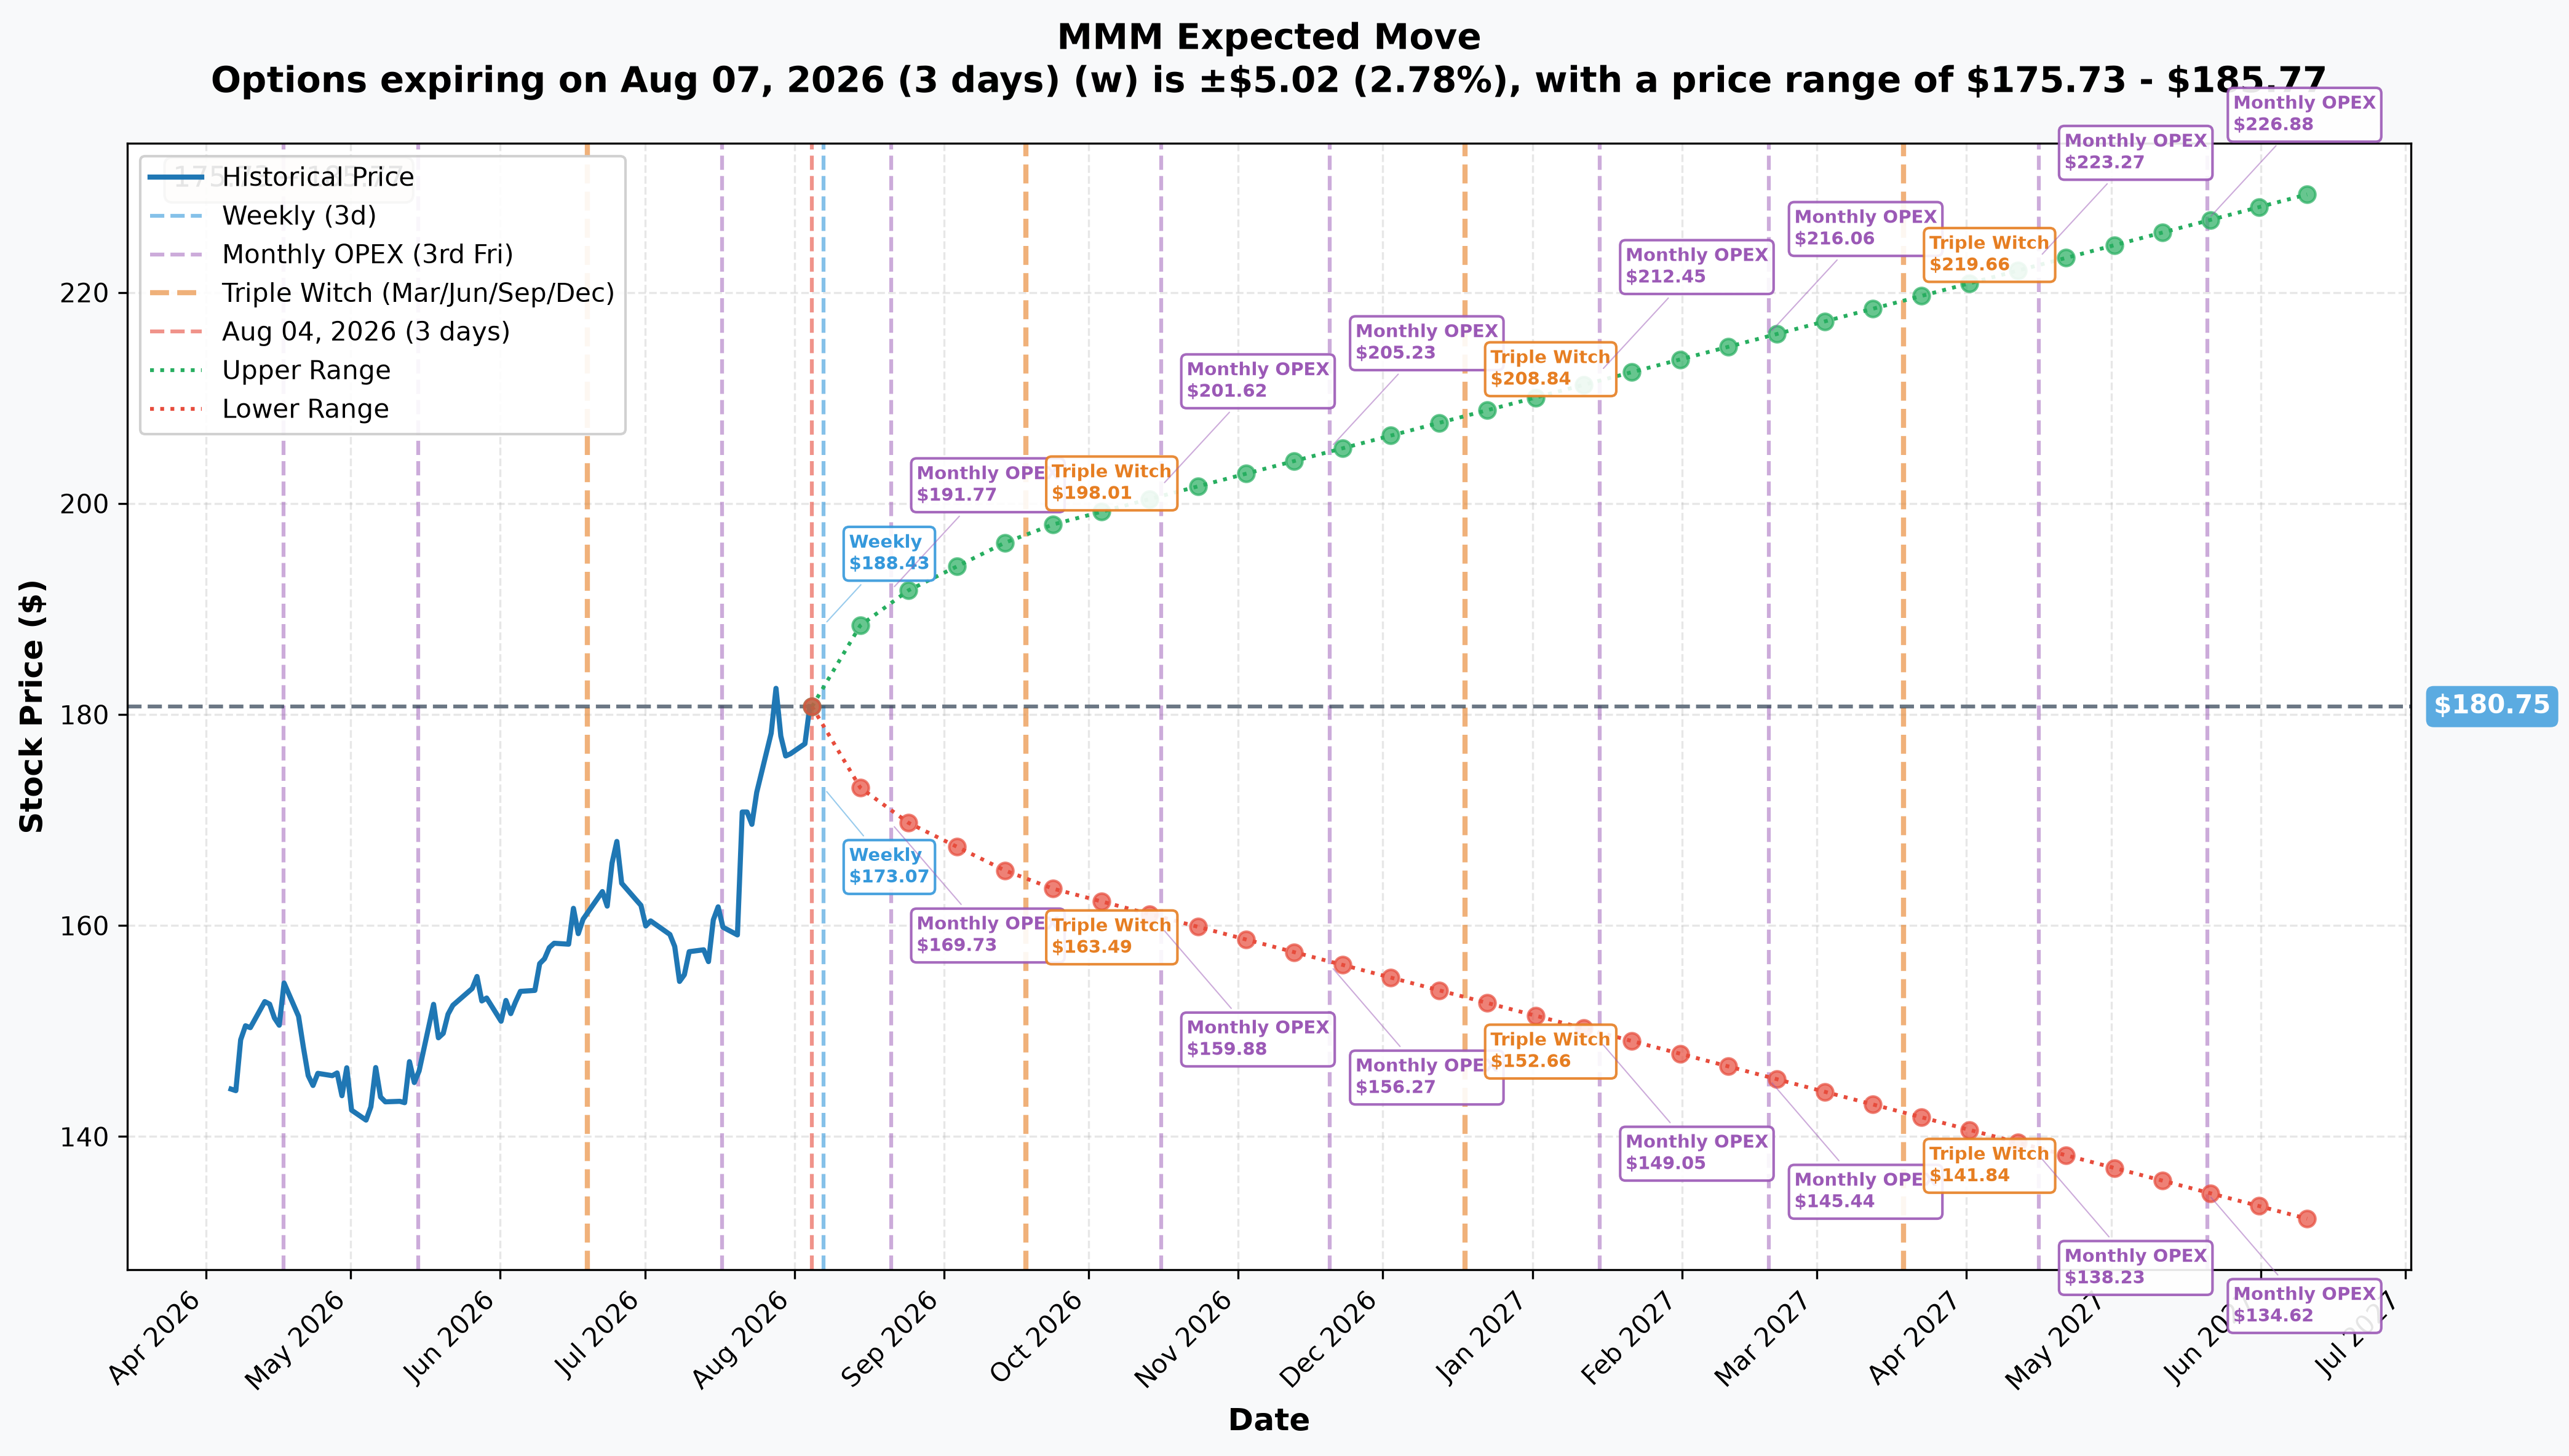
The options chain prices its own expected move, and the most relevant comparison here is the one that matches this trade's own expiration:
- September 18, 2026 (45 days out — the exact expiration on this call): implied move of ≈9.22%, or ≈$16.66, putting the priced range at $164.09 to $197.41.
- That matters directly: this call's $192.98 breakeven sits inside the option market's own implied range, about $4.43 below the $197.41 upper edge — not a target the market is pricing as impossible, just not the base case either. An implied move is roughly a one-standard-deviation band, so landing near the top of it (where breakeven sits) is a real but non-default outcome, not the expected center of the distribution.
- For scale, the shorter August 21 monthly opex (17 days) implied move is ≈5.72% ($170.41–$191.09) — notice its upper bound, $191.09, already brushes the $190 strike, and the August 7 weekly (3 days) implied move is a tight ≈2.78% ($175.73–$185.77).
🎪 Catalysts
Past (already happened):
- 3M beat on both lines in Q2 2026, reported July 21, 2026: adjusted EPS of $2.40 vs. $2.25 expected (a $0.15 beat), revenue of $6.50B vs. $6.40B expected, and organic growth of +5.4%. Management raised full-year 2026 adjusted EPS guidance to $8.80–$8.95 from a prior $8.50–$8.70 (StockTitan, MarketBeat). That beat and guidance raise are already fully priced in — this trade happened two weeks later.
- The beat triggered a wave of price-target increases on July 22–23: UBS $190→$218, Citigroup $166→$183, Mizuho $160→$180, and JPMorgan upgraded to Overweight at $180 (MarketBeat). But the beat didn't convince everyone — Bernstein ($145) and RBC ($132) both raised targets while keeping Underperform ratings, sitting roughly 20–27% below the current stock price. That's a real, unresolved disagreement among analysts, not a rounding error.
- On July 15, 2026, 3M announced a partnership with Microsoft to supply Expanded Beam Optical technology for AI data-center infrastructure (StockTitan). No dollar figure has been disclosed yet — it's a live, unquantified wildcard rather than a confirmed revenue driver.
Upcoming:
- Next earnings date is ESTIMATED for Tuesday, October 20, 2026 — not yet company-confirmed, per MarketBeat, which projects it off last year's reporting schedule. That date falls after this call's September 18 expiration, so this position does not own an earnings print — whatever thesis is behind it, it's not betting on the next quarterly number.
- Analyst targets are split on whether MMM has more room to run. Spot is roughly 2.3% below the 52-week high of $184.90. StockAnalysis (18 analysts) rates it Buy with an average target of $181.85; MarketBeat (15 analysts) rates it Hold with an average target of $177.21 — below the current price. Either way, the average consensus target implies roughly zero upside from here, well short of the +7.1% this call needs. The honest read: this trade is betting the stock outruns both the average analyst and, per the gamma table above, pushes cleanly through a strike that already carries real dealer hedging flow.
🎲 Price Targets & Probabilities
Pulling the gamma table, the implied-move cone, and analyst targets together:
- Breakeven for the buyer: $192.98 (+7.1% from the $180.18 trade-time spot) — inside the $164.09–$197.41 range the options market itself is pricing for the September 18 expiration (±9.22%), but toward the upper edge of it, not the middle.
- Bull case / target zone: above the $190 strike and the nearby $185 gamma resistance — both levels the stock would need to clear, and both already have real dealer gamma sitting on them.
- Base case: the market's own average analyst targets ($177.21–$181.85) and the heaviest gamma concentration ($180, right at spot) both cluster near where the stock already is — the base case, statistically, is closer to flat than to a 7%+ rally.
- Bear case / floor: the $175 and $170 gamma support zones, and the implied-move's own $164.09 downside edge, mark where the stock would need to hold for this to just be an unrealized loss rather than a wipeout.
💡 Trading Ideas — Four Ways to Read This
🚀 YOLO / Aggressive
If you want to ride the same call, the September $190s are exactly what was bought here — $2.98 as of the print, needing +7.1% by September 18. This is a directional swing bet on a normally slow-moving industrial; size small, because a 45-day OTM call on a low-beta name can go to zero without much drama.
⚖️ Swing Trader
Consider a tighter-dated or lower-strike call, or a call spread (long $190 / short $200) to cut the premium outlay and reduce the breakeven hurdle, since the flow itself doesn't prove urgency — you're not chasing a sweep, you're following a patiently-worked block.
🛡️ Premium-Collector
If you think $190 is a stretch in 45 days for a stock that's only moved ≈11.7% in a full year, selling a covered call around the $190-$195 area against existing MMM shares could monetize the same skepticism the slow YTD trend implies — just size it around your own cost basis and risk tolerance.
📚 Beginner
This is a good example of why a "BUY" tag isn't the whole story. Someone opened a real position (size beat the prior open interest), but it was filled as a floor-negotiated block at the midpoint, not a sweep — meaning we can't tell how confident or rushed the buyer was. Don't chase headline premium numbers without checking how the trade actually printed.
⚠️ Risk Factors & Honest Limits
- The math is real: the stock needs to close above $192.98 by September 18, 2026 — a +7.1% move in 45 days — just to break even. MMM's trailing one-year performance (+11.7%) suggests that's a faster pace than its recent norm, though it doesn't rule it out.
- Direction is not tape-proven by aggression. This printed as a negotiated floor block at the midpoint, not a lit sweep. The BUY label and the opening-size evidence support a long call being established, but we cannot say the buyer was urgent or highly conviction-driven — the IV check that would normally confirm aggressive buying doesn't apply to this kind of negotiated print.
- Open interest isn't confirmed yet. We're calling this "mostly a new position" because size (6,000) comfortably exceeds prior OI (1,672), but the exact next-day OI print (expected ≈06:30 ET) is the only thing that fully resolves how much of this was genuinely new versus matched against existing positions unwinding.
- What the tape cannot tell us: who's on the other side, the buyer's cost basis or hedges elsewhere (stock, other options, or other names), whether this is a standalone directional bet or part of a larger multi-leg or cross-asset position, and the buyer's actual time horizon beyond the stated expiration.
- This is a real-money trade discussion, not investment advice — size and risk any position around your own account, not around someone else's $1.79M ticket.
Last updated: 2026-08-05 — next-day OPRA open-interest resolution added: confirmed OPEN (BTO) — OI rose 6,682 on a 6,000-contract print.