🐋 MSFT $13M ITM Put — Institutions Load Downside Protection for the Second Time in Three Days
📅 June 15, 2026 | 🔥 Unusual Options Activity Detected
✅ Updated 2026-06-16: Next-day OPRA OI resolves the size<OI flag — the Aug $420 put rose 8,132 → 11,599 (Δ +3,467 ≈ the 3,500 traded). Confirmed a net-new bearish/hedge put, not a roll or close.
🎯 The Quick Take
Someone just paid $13 million to protect against — or bet on — Microsoft falling further, and this is not the first time. Three days ago on June 12, a different desk crossed a $22M block in these exact same $420 puts. Today's follow-on cross adds ≈3,500 more contracts to the same August 21 expiry, and institutions keep coming back for downside cover ahead of the July 28 Q4 earnings. With MSFT already ≈28-30% off its 52-week high, a $190B capex overhang crushing free cash flow, and earnings arriving squarely before this put expires, smart money is clearly paying up for a floor.
📊 Company Overview
Microsoft Corporation (NASDAQ: MSFT) is a ≈$2.9 trillion mega-cap in the Information Technology / Software & Infrastructure sector (SIC: Prepackaged Software).
- Market Cap: ≈$2.9 trillion
- Current Price: ≈$398.83 (June 15, 2026)
- 52-Week Range: $356.28 – $555.45 — stock sits ≈28-30% below its high
- Core Business: Three segments — Intelligent Cloud (Azure, GitHub, server products), Productivity & Business Processes (Microsoft 365, Copilot, LinkedIn, Dynamics), and More Personal Computing (Windows, Xbox, Surface). Azure is the central growth engine, compounding at ≈40% in constant currency. The tension driving every options trade right now: spectacular fundamentals vs. a ≈$190B FY2026 capex plan that is squeezing free cash flow and keeping the multiple compressed.
💰 The Option Flow Breakdown
📊 What Just Happened
At 10:13:31 ET on June 15, a desk crossed 3,500 contracts of the MSFT August 21 $420 put in a single pre-arranged block, paying $36.45 per contract — $13M total for downside protection (or a bearish bet) expiring in just over 9 weeks.
| Time | Buy/Sell | Type | Strike | Expiration | Volume | OI | Size | Premium | Spot | Option Price | Option Symbol |
|---|---|---|---|---|---|---|---|---|---|---|---|
| 10:13:31 | BUY | PUT 🤝 | $420 | 2026-08-21 | 3,500 | 8,100 | 3,500 | $13M | $398.83 | $36.45 | MSFT20260821P420 |
Mechanism: 🤝 Single-leg block cross — this was a pre-arranged, negotiated block between a known buyer and seller off the open book. It is not a lit sweep. It is not an auction. A broker matched both sides before the print hit the tape. There is no "panic sweep" urgency to read into this — the $13M was agreed before the cross printed on-exchange.
The put is in-the-money: With MSFT at $398.83 and the strike at $420, the put is already $21.17 in-the-money — this desk is not hoping for a dramatic crash; they already have intrinsic value baked in and are paying an extra ≈$15.28 in time value and vol premium on top of that. The total cost of $36.45 per contract is the full premium at risk.
✅ RESOLVED — Next-Day OI Confirms a Net-New Open (2026-06-16)
| Leg | Pre-print baseline (EOD 2026-06-12) | Resolving (EOD 2026-06-15) | Δ | Verdict |
|---|---|---|---|---|
| Aug-21 $420P | 8,132 | 11,599 | +3,467 | OPEN — net-new bearish/hedge put confirmed |
The next-morning OPRA snapshot resolves the size-below-OI ambiguity: open interest rose from 8,132 to 11,599, a +3,467 gain that matches the 3,500 puts traded. Even though the block size was below the prior OI (which left open/close unprovable from the tape alone), the OI clearly rose — so this is a genuine new bearish/hedge put, not a roll or a close. The second downside block in three sessions adds real new protection.
🤓 What This Actually Means — Plain English
The ITM Put: What Is a $420 Put With MSFT at ≈$399?
Here is the simplest way to think about it. A put gives you the right to "sell" MSFT at $420, regardless of where the stock actually is.
- With MSFT at ≈$399, the $420 put is already worth $21.17 in pure intrinsic value — that is the in-the-money amount, real money baked in right now.
- The desk paid $36.45 per contract. That extra ≈$15.28 above intrinsic is the time value and volatility premium — the cost of the option not expiring for another ≈67 days, and the insurance premium for protection if MSFT drops further.
- Breakeven for the put buyer: $420 − $36.45 = $383.55 — MSFT needs to be at or below ≈$383.55 at August 21 expiry for the position to break even on cost. Below $383.55, every dollar MSFT falls adds a dollar of profit per share (×100 contracts × 3,500 lots).
- Maximum loss: $36.45 per contract ($13M total), if MSFT is at or above $420 at expiry. The put expires worthless and the full premium is gone.
Why the Same $420 Strike — Twice in Three Days?
This is the part that makes today's flow meaningful. On June 12, a different desk crossed 5,000 contracts of this exact same MSFT August 21 $420 put for $22M. That put the prior OI at ≈4,362 contracts the night before the June 12 block, and next-day OI confirmed ≈3,770 net new long puts were added (the rest was transfer). Today the OI sits at 8,100 — reflecting that confirmed June 12 position — and now a new desk (or possibly the same desk adding) crosses another 3,500 contracts.
Two blocks on the same strike and expiry in three days = persistent institutional demand for this specific downside hedge.
The thesis is clear: with Q4 FY2026 earnings on July 28 landing ≈24 days before the August 21 put expires, this strike is being used as a defined-risk earnings hedge. The $420 strike sits ≈$21 above the current price — it is the level where institutions want guaranteed profits if MSFT trades sideways to down into the earnings print. A miss, another capex upside surprise, or a disappointing FY2027 capex guide on that July call would drive the put deeper into the money.
Open, Close, or Hedge — Three Reads, All Plausible
As we noted above, size (3,500) less than OI (8,100) means we need to frame this conditionally.
-
If opening — more downside added: A second desk is building the same hedge as the June 12 buyer. Combined, the two blocks represent ≈$35M in August $420 put exposure — a substantial institutional lean against MSFT into earnings. This read is directionally bearish / hedge-seeking.
-
If closing — the June 12 buyer trimming risk: The June 12 position had ≈3,770 confirmed new long puts added. If 3,500 of those are now being crossed out (sold via block cross), the June 12 buyer is booking partial profit or cutting their exposure as MSFT has traded up from ≈$388 to ≈$399. This read is actually bullish on the margin — the institution is taking money off the table.
-
If a hedge against a long MSFT stock position: A desk with a large long MSFT equity position buying deep-ITM puts is paying for insurance, not expressing a directional conviction short. In this case the $13M is pure cost of protection, not a "bet" in the directional sense.
The tape cannot distinguish between these three. Frame conditionally, and use next-day OI as the decisive data point.
📈 Technical Setup / Chart Check-Up
YTD Performance
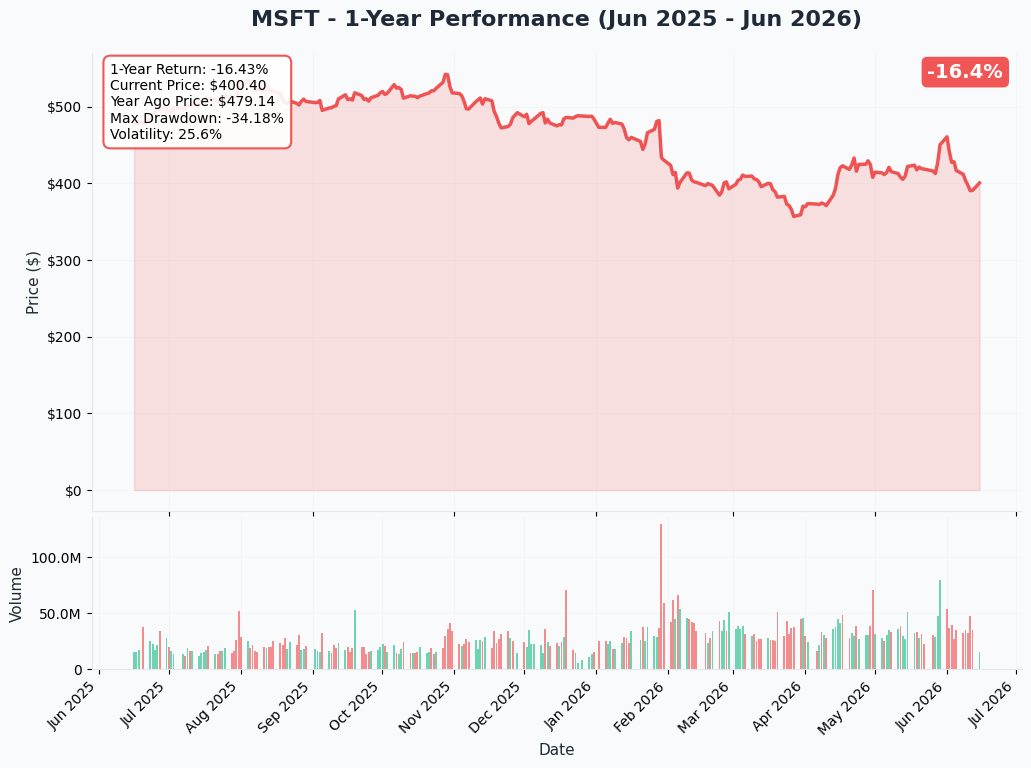
It has been a rough year for Microsoft shareholders. After touching ≈$555 at its 52-week peak, MSFT has fallen ≈28-30% to the current ≈$399 — a brutal de-rating for a company that just posted 18% revenue growth and Azure at +40%. The market's message is unmistakable: the $190B FY2026 capex plan is the dominant overhang, and until AI revenue demonstrably closes the gap with spending, the multiple stays depressed.
Key observations from the chart:
- 📉 ≈28-30% off the 52-week high; 52-week low at $356.28
- 🔄 Grinding consolidation in the ≈$370–$420 band since the April 30 earnings-day drop
- 📊 $390-$400 has repeatedly acted as a battleground zone; rallies above $420 have failed
- ⚠️ The $420 put strike sits at the TOP of the current YTD range — exactly where every rally attempt has stalled
Gamma-Based Support & Resistance
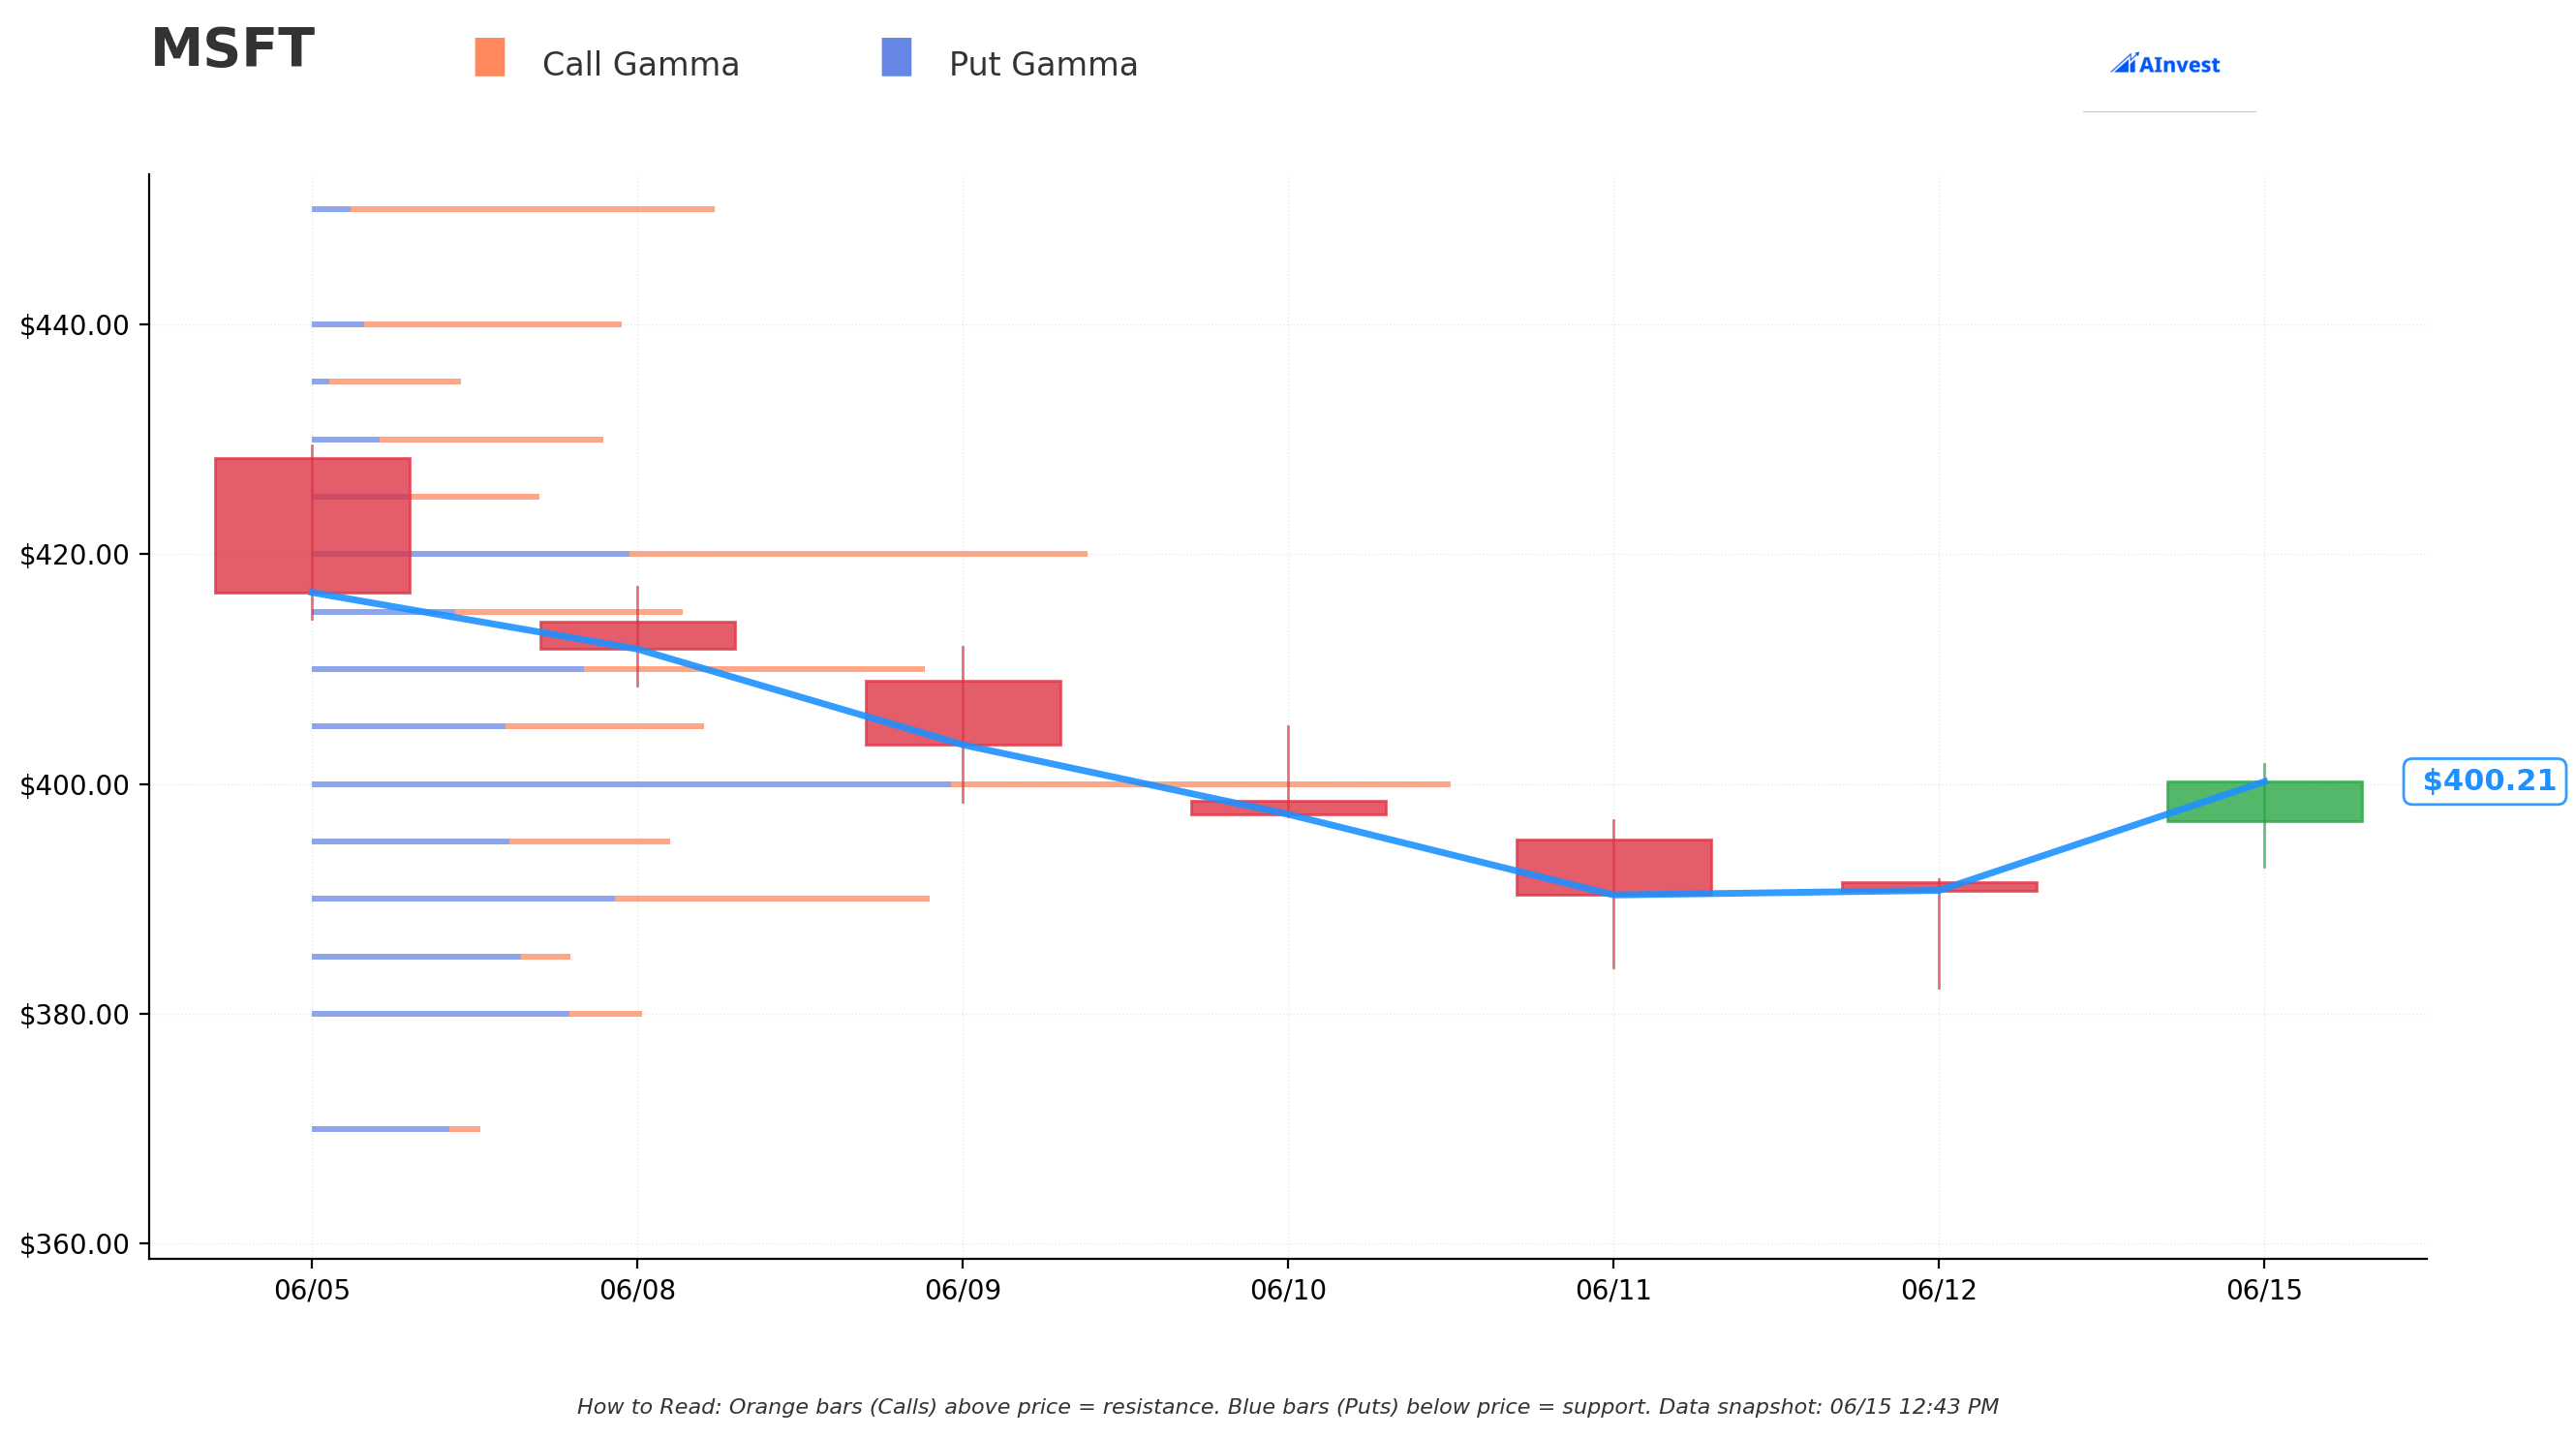
With spot near ≈$400.4, the gamma exposure map shows market makers are tightly hedged in a well-defined corridor — and the $420 put strike sits right at the gamma ceiling.
🔵 Support Levels (Put Gamma — market makers step in and buy the dip):
- $400 / $395 — The first two gamma floors below current price. Market makers with short puts at these strikes will buy MSFT stock as it dips, cushioning the move. The ≈$400 zone is the immediate support zone to watch.
- $390 — Secondary support; a close below $390 would signal this floor is giving way.
- $385 / $380 — Deeper support band; the $380 zone has consistently absorbed selling pressure over the past two months. A break below $380 opens space toward the put's $383.55 breakeven quickly.
🟠 Resistance Levels (Call Gamma — market makers sell rallies to hedge):
- $405 / $410 — Overhead resistance just above current levels; any short-term bounce runs into these walls.
- $420 — The critical level. The $420 gamma wall is the TOP ceiling of the current range AND the strike of the put block. This is where the institutional thesis is anchored — the put buyer is betting this gamma wall holds as a ceiling and the stock cannot punch through it before August 21. Every failed rally at $420 adds value to this position.
What the gamma map tells you: MSFT is currently pinned between the ≈$400 gamma support and the ≈$420 gamma resistance. The put block's structure is perfectly calibrated to this range — it profits if the stock stays below $420 at expiry (already the case), and accelerates in value if the gamma support at $400–$390 gives way. The July 28 earnings print is the likely catalyst to break either direction out of this band.
Implied Move Analysis
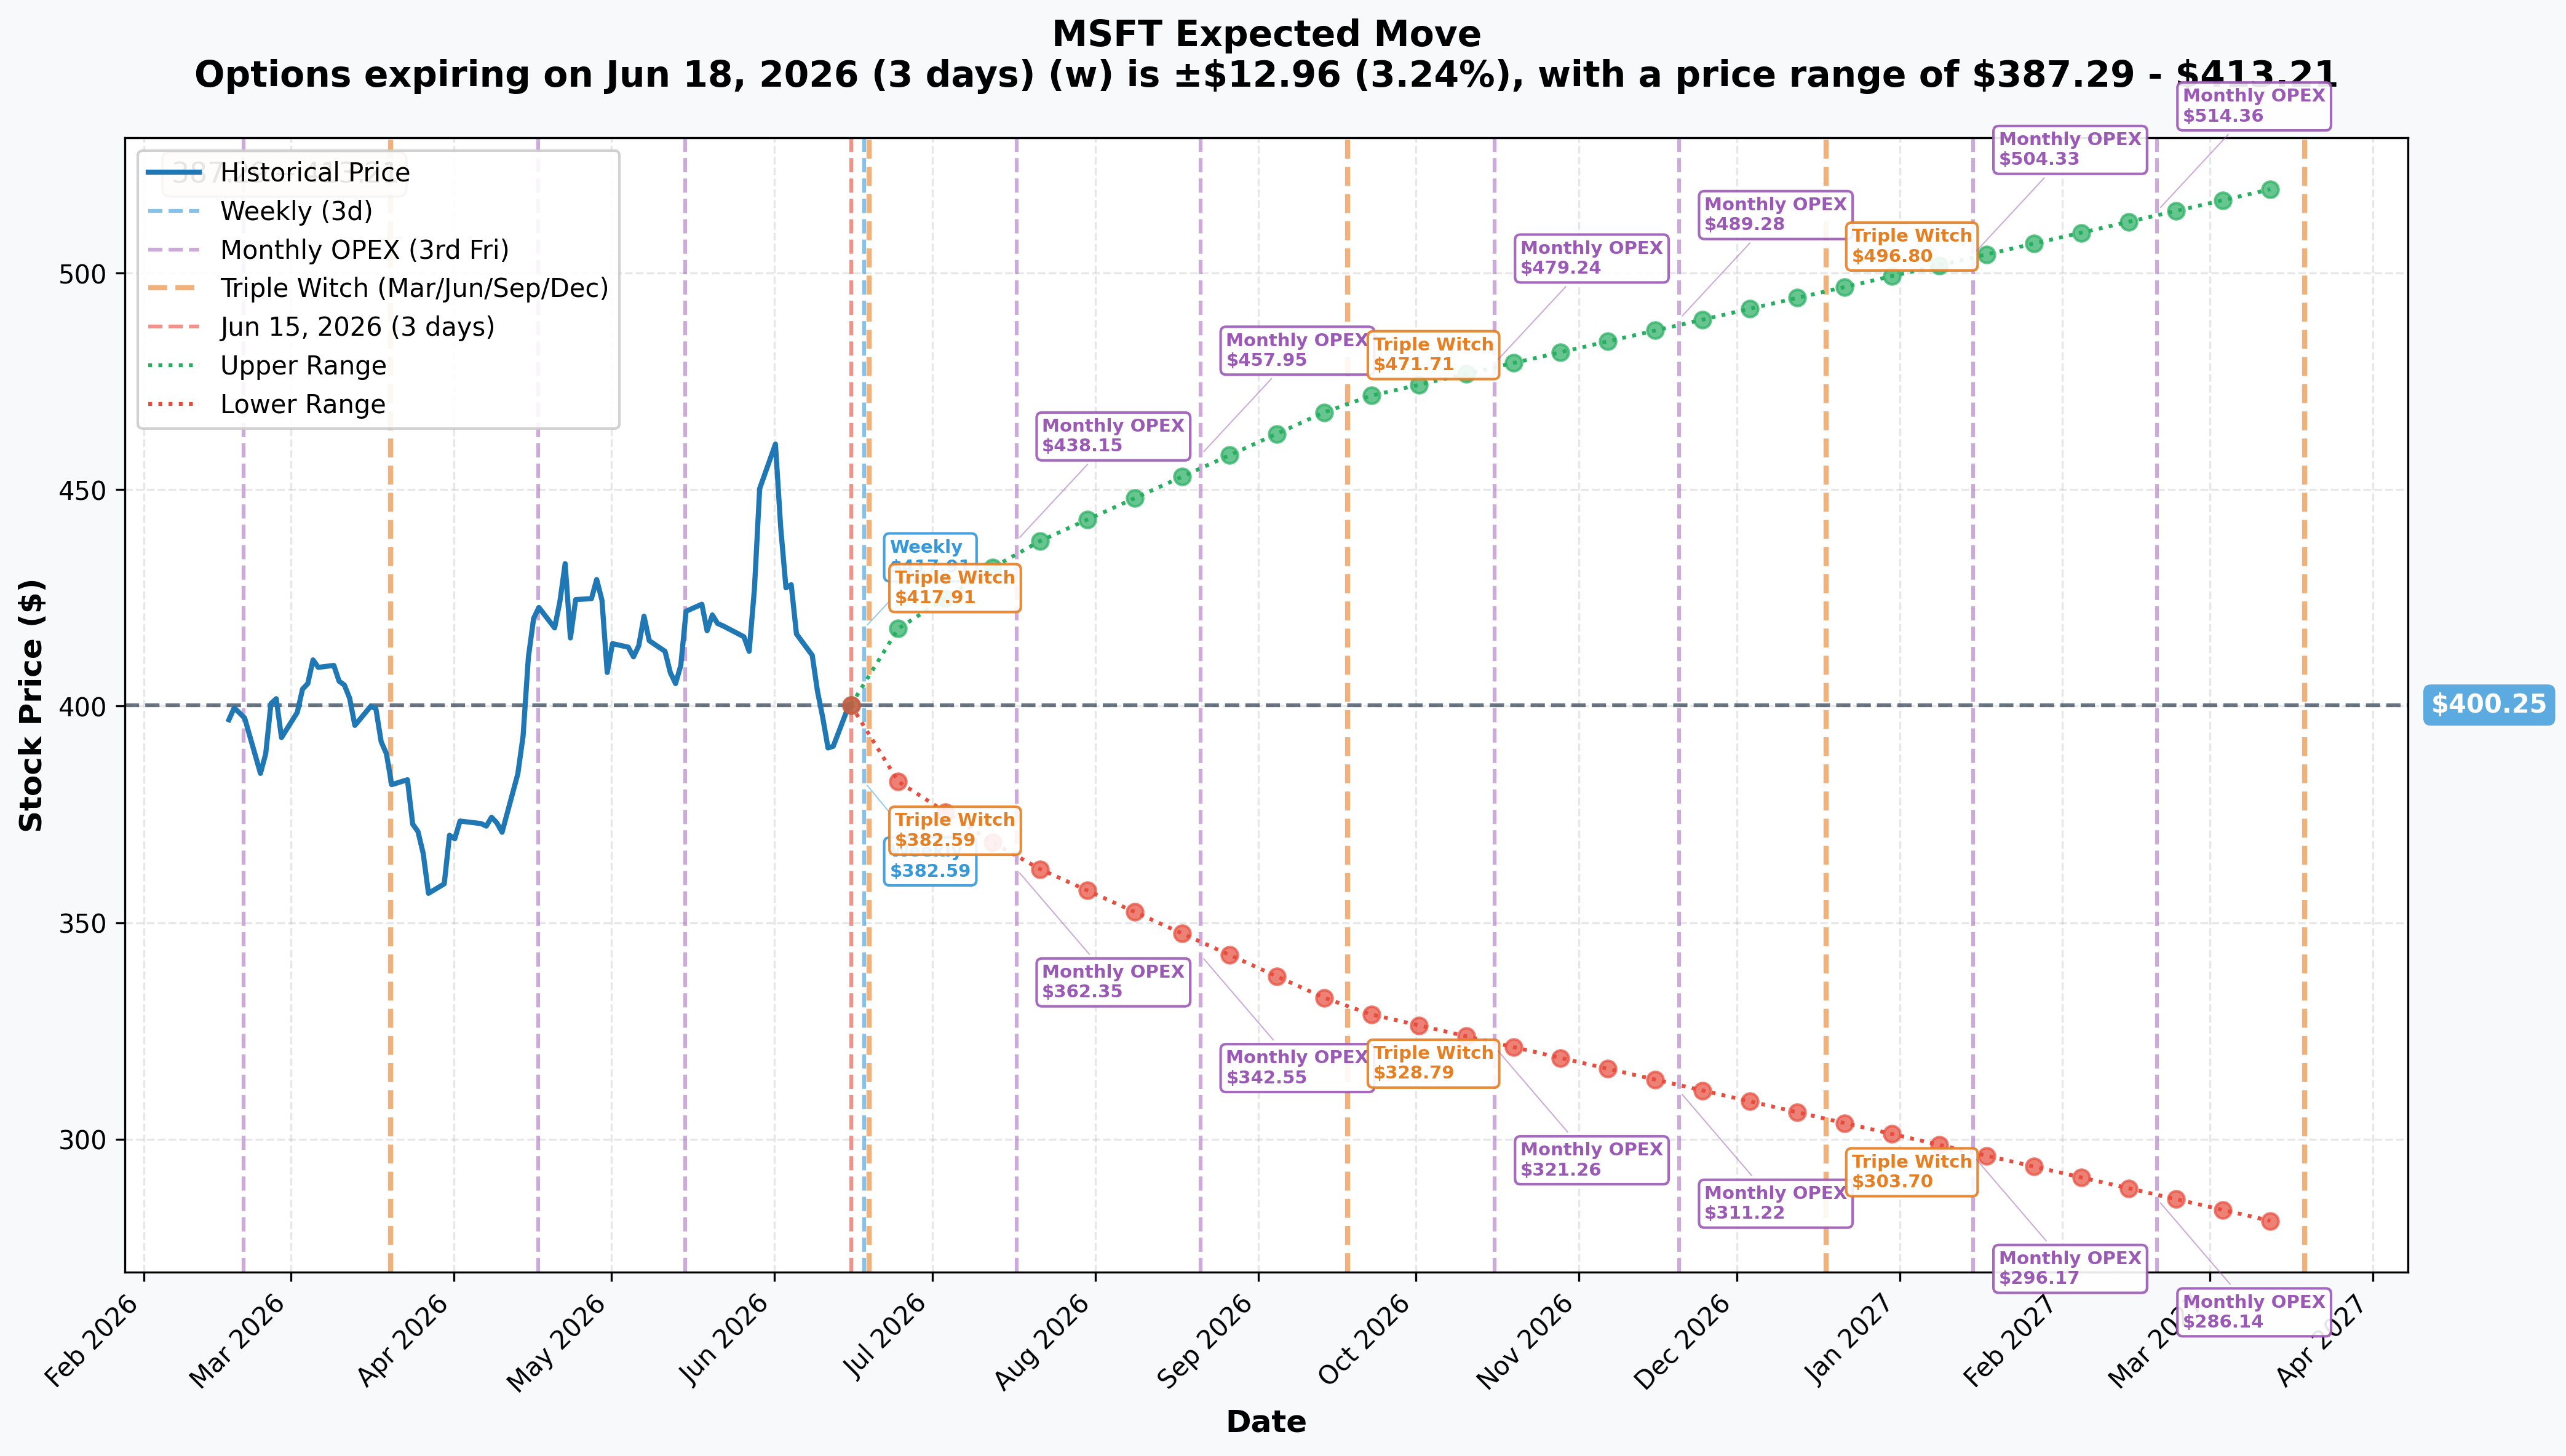
The options market is pricing in these expected price ranges from the current ≈$399 spot:
| Expiration | Implied Move | Expected Range |
|---|---|---|
| 📅 Monthly OPEX (July 17, 2026) | ±8.92% | $364.55 – $435.95 |
| 📅 Quarterly (September 18, 2026) | ±17.58% | $329.90 – $470.60 |
What these numbers mean for the put:
- The July 17 implied range shows the options market pricing a downside of $364.55 and an upside of $435.95 through July OPEX — meaning a move to $399 → $364 is within the market-priced 1-standard-deviation band for next month alone.
- The put's breakeven of $383.55 sits inside the July implied move's downside range. The market is already pricing meaningful probability that MSFT reaches (and exceeds) the breakeven before the July 17 monthly expiry — let alone before the August 21 put expires.
- The $420 strike is also inside the July implied range to the upside ($435.95 ceiling). This means if MSFT rallies hard into the July print, the put could move toward worthless on the upside too — a risk the buyer is fully paid up for in the $36.45 premium.
Bottom line on levels: The put is well-structured within the current implied move framework. The downside scenario (stock toward $380–$364 on an earnings miss) is well within the 1-sigma band for the option window.
🎪 Catalysts
🔥 Already Happened — The Overhang Was Created Here
FY26 Q3 Earnings (April 29, 2026) — beats the numbers, drops anyway
Microsoft's Q3 results were genuinely outstanding: revenue $82.9B (+18% YoY), EPS $4.27 (+23%), Azure +40% constant currency, Microsoft 365 Copilot crossing 20M paid commercial seats with an AI run-rate of ≈$37B. The stock fell ≈4.4% the next session. Why? CFO Amy Hood disclosed FY2026 capex will reach ≈$190B — ≈$37B above Wall Street expectations, with ≈$25B of that increase from higher memory and component pricing, not added capacity. The free-cash-flow math spooked the market and has kept the stock range-bound since.
OpenAI relationship restructured (completed late October 2025, detailed in May 2026 10-Q)
Microsoft holds a 27% stake in OpenAI (valued at ≈$135B), down from a prior estimated ≈32.5% as new investors entered at a ≈$500B valuation. The deal came with a meaningful structural concession: OpenAI can now sell API access through any cloud provider, the IP license is non-exclusive with a 2032 expiration, and Microsoft lost its cloud right-of-first-refusal. In exchange, OpenAI committed to ≈$250B of incremental Azure cloud purchases — a multi-year backlog tailwind that partially offsets the structural weakening of the prior exclusivity.
Prior $420 Put Block — June 12, 2026 ($22M, 5,000 contracts)
Three sessions ago, a desk crossed 5,000 contracts of this exact same August 21 $420 put for $22M (spot ≈$388 that session). Next-day OPRA OI confirmed ≈3,770 net new long puts opened. Today's follow-on cross on the same strike and expiry — with MSFT having recovered to ≈$399 since then — shows institutional interest in this specific level has not gone away. Whether today is opening or trimming depends on next-day OI.
📅 Upcoming — The July 28 Earnings Print Is Everything
Q4 FY2026 Earnings: July 28, 2026 (CONFIRMED, after close) — THE pivotal event
Confirmed by TipRanks, July 28 lands ≈24 days before the August 21 put expires. This is the binary event the put buyers are positioned around. Consensus expects ≈$4.24 EPS for Q4. What the market actually cares about:
- Azure cc growth — guided to 39-40%; any deceleration from Q3's 40% is bearish. Acceleration above 40% is the re-rating catalyst.
- FY2027 capex framing — the single biggest swing factor. If management signals the $190B run rate continues into FY2027, the FCF overhang gets worse. Capex discipline would relieve the overhang and potentially trigger a sharp re-rate.
- Memory/component cost trends — ≈$25B of the FY2026 capex surprise came from DRAM/HBM pricing, not added capacity. If that pricing pressure is easing, gross margins recover. If it persists, margins stay compressed.
- Copilot seat momentum — crossing 20M paid seats is impressive, but penetration is still ≈3.3% of the commercial Microsoft 365 base. The bull case needs this accelerating into a meaningful revenue ramp.
- OpenAI Azure backlog conversion — the $250B Azure commitment from OpenAI should start converting into recognized revenue; early evidence of that would support the bull case.
FY2027 capex framing on the July call is, in short, the bear or bull catalyst that determines whether the put expires deep in the money or worthless.
🎲 Price Scenarios Through August 21 Expiry
📉 Bear Case — Put Profits, Stock Falls Below Breakeven
MSFT at or below ≈$383.55 by August 21
- 💡 July 28 earnings delivers an Azure deceleration or another FY2027 capex acceleration. The market reacts like it did after Q3 — sell first, ask questions later.
- 📉 Stock retreats from the ≈$399 level toward the $385–$380 gamma support band, then through the put's $383.55 breakeven if selling accelerates.
- 🐻 BofA's near-term gross-margin pressure thesis plays out; momentum stays broken.
- 💰 Put value: every dollar MSFT falls below $383.55 adds $1 per share (×100 × 3,500) in profit. At $370, the put is worth ≈$50 per contract — a ≈37% gain on the $36.45 cost. At $356 (52-week low), the put is worth ≈$64 — a ≈76% gain.
Gamma watch: the $380 support wall is the first key level to break in a bear scenario. Below $380, gamma cushioning thins and the put accelerates.
⚖️ Base Case — Gridlock Continues, Put Decays
MSFT grinds between $385–$420 through August 21
- 📊 July 28 delivers a soft beat — Azure holds 39-40%, capex tracks in line, no directional catalyst.
- 🔄 The gamma corridor ($390-$420) continues to contain price action.
- ⏳ The put has intrinsic value but the ≈$15.28 time premium decays daily (theta bleeds the put buyer). At $399 spot on August 21, the put is worth ≈$21.17 in intrinsic vs. a cost of $36.45 — a ≈$15.28 loss.
- 👀 Outcome depends heavily on the July 28 print; in true range-bound action the put buyer loses a meaningful portion of premium to time decay.
🚀 Bull Case — Put Expires Worthless, MSFT Re-Rates
MSFT rallies above $420 into earnings, closes above $420 at August 21 expiry
- 💥 Clean Q4 beat: Azure accelerates above 40%, FY2027 capex guidance signals discipline, Copilot seat growth inflects.
- 📈 Morgan Stanley's $650 target and Wedbush's $575 attract momentum; stock clears the $420 gamma ceiling.
- 💔 Put expires worthless above $420; full $13M premium is a sunk cost.
- 📊 ≈95% of analysts carry a Buy rating with a ≈$560 average price target — if the July narrative flips, the consensus re-rates fast.
💡 Trading Ideas (4 Reader Types)
🚀 YOLO Trader
Real talk: this is a binary earnings trade positioned 24 days before expiry. If you want to express the same bearish-hedging thesis as the institution at a smaller size, the cheapest way is a put debit spread — for example, buy the MSFT August 21 $420 put and sell the $390 put. The $30 wide spread limits your max gain but dramatically cuts your premium cost vs. an outright $420 put. You need MSFT to fall below your long strike to profit, but you cap your cost.
Risk: HIGH. A clean July 28 beat sends this worthless instantly. Size for total loss.
⚖️ Swing Trader
The two block crosses on the $420 put (June 12 $22M, June 15 $13M) paint a clear range: the institutional community is treating $420 as the ceiling and $380-$384 as the zone where the hedge activates. Your swing playbook:
- Bearish: wait for the July 28 print. If MSFT gaps below $390 on earnings with a capex miss, the $380 gamma wall is the first target. The put's ≈$15 time-value cushion above intrinsic gives you room to wait for the right entry.
- Bullish bounce: if the earnings beat is clean and MSFT clears $420, the gamma wall breaks and open air toward $430-$435 (the July implied upper range of $435.95) becomes the trade.
The July 17 implied move range ($364.55–$435.95) is your earnings-month planning guide.
🛡️ Premium Collector (Conservative)
Your angle is to wait for the July 28 earnings-driven vol crush. With two consecutive $420 put blocks hitting the tape in three sessions, implied volatility in the August expiry is elevated — that is what is driving the $36.45 option price (of which ≈$15.28 is pure time/vol premium). Post-earnings, that vol premium typically collapses whether the stock moves or not. After the July 28 print resolves the binary:
- If MSFT is in a new range, sell a cash-secured put at the new gamma support level and collect premium into September on the vol crush.
- The $390-$395 strike zone (the top gamma support band) makes a sensible anchor for a put sale post-earnings.
📚 Entry-Level Investor (Just Starting With Options)
Here is the big-picture lesson from today's trade. A deep in-the-money put is not a speculative lottery ticket — it is expensive insurance with real intrinsic value baked in.
When a desk pays $36.45 for the right to sell MSFT at $420 when it is already trading at $399, they are paying $21.17 for the value that exists today (the ITM amount) and $15.28 for the protection that covers the next 67 days through a known earnings event.
Think of it like this: buying car insurance after your car already has a small dent (you are in-the-money) — you are paying for both the dent's existing value and the coverage on any new damage.
Two blocks on the same strike in three days — that is institutions saying they are not comfortable riding MSFT into July 28 without a defined floor. Whether you agree or disagree with their thesis, this is how professionals hedge large equity positions. You do not need $13M to do the same — a single contract (100 shares) of the same put is ≈$3,645.
⚠️ Risk Factors
What could go wrong — and what the tape cannot tell us:
-
📅 July 28 is the decisive event, full stop. Q4 FY2026 earnings is the catalyst that drives the put in or out of the money on the earnings reaction. A miss sends MSFT lower and the put gains; a clean beat with capex discipline sends MSFT above $420 and the put expires worthless. This is a binary catalyst trade.
-
💸 $190B capex remains the primary bear driver. Free cash flow has crashed under the weight of the spend, and BofA flags near-term gross-margin pressure as the top downside risk. Until AI revenue demonstrably offsets the spend, the de-rating pressure persists.
-
🤝 Block cross = known counterparty — weigh the mechanism. A block cross is not an aggressive lit sweep. A desk agreed on price off the open book; there is a counterparty on the other side who was SELLING these puts (i.e., expressing a less bearish or bullish view). The $13M is one side of a negotiated block — not an uncontested signal. The seller is just as informed.
-
⏳ Open vs. close is unresolved. The most important thing you can know about this trade — whether the institution is adding exposure or trimming it — requires next-day OPRA OI. Frame your interpretation conditionally until that resolves.
-
🔗 OpenAI relationship dilution is a structural negative. Non-exclusive IP (2032 sunset), no cloud right-of-first-refusal, and an independent AGI adjudication panel all weaken Microsoft's prior lock on the most valuable AI franchise. This adds to the fundamental uncertainty rather than resolving it.
-
📊 The consensus-vs-price disconnect is stark. ≈95% of analysts rate MSFT Buy with a ≈$560 average target — implying ≈40% upside — yet the stock is 28-30% off its high. Either the market knows something the analysts do not, or this is a massive opportunity. The July 28 earnings print will start answering which one it is.
-
🔍 What the tape cannot tell us. OPRA shows us the structure, size, price, and mechanism of the cross. It cannot tell us: whether the put buyer holds a large long MSFT equity position (making this pure insurance, not a directional bet); whether this is the same June 12 desk adding or trimming; the broker or counterparty identity; or what happens to this position if MSFT is acquired, halts, or has a non-earnings catalyst before August 21.
🎯 The Bottom Line
Here is the deal: Two institutional desks have now crossed ≈$35M of MSFT August $420 puts in three sessions — $22M on June 12, $13M today. That is a persistent and meaningful institutional lean toward downside protection (or a directional bearish bet) heading into the July 28 Q4 earnings print. With MSFT already ≈28-30% below its 52-week high, a $190B capex plan squeezing free cash flow, and the $420 gamma wall capping every rally attempt, the bear thesis has real structural logic behind it.
But — and this matters — the $13M is a negotiated block cross, the open/close status is provisional pending next-day OI, and a "Strong Buy" analyst consensus with a ≈$560 average target reminds us that the bull case (Azure at 40%, $37B AI run-rate, $250B OpenAI Azure backlog) is just as real. The July 28 earnings print is the arbiter.
Key dates to mark:
- 📅 June 16, 2026 (pre-market ≈06:30 ET) — OPRA OI snapshot for the $420 put. The definitive open/close verdict. If OI rises ≈3,500 → new position opened (more bearish hedging). If flat or falls → partial close of the June 12 block (bullish on the margin).
- 📅 July 28, 2026 — Q4 FY2026 earnings, after close. Azure growth rate, capex actuals, FY2027 capex guide, and Copilot seat momentum are the market-moving variables. This is the binary event the put buyers are positioned for.
- 📅 August 21, 2026 — $420 put expiry. Full intrinsic value if MSFT is below $420 at expiry; put expires worthless above $420. Breakeven for the buyer: $383.55.
Disclaimer: Options trading involves substantial risk of loss and is not suitable for all investors. This analysis is for educational and informational purposes only and does not constitute financial advice or a recommendation to buy or sell any security. The trade described carries a defined but material risk of total premium loss ($36.45 per contract, $13M total). The open/close status of this trade is provisional pending the June 16 pre-market OPRA OI snapshot — interpretation may change materially once that data is available. Past performance is not indicative of future results. Always consult a licensed financial advisor before making investment decisions.
Last updated: 2026-06-16 — next-day OPRA OI resolved the size<OI flag: net-new open confirmed (+3,467).
About Microsoft Corporation: Microsoft is a ≈$2.9 trillion mega-cap technology company in the Software & Infrastructure sector, operating Azure (Intelligent Cloud), Microsoft 365/Copilot (Productivity & Business Processes), and Windows/Xbox (More Personal Computing). Azure and its AI services are the central growth engine and dominant share-price driver in 2026.